Transcription
Q3 2020 EARNINGS PRESENTATIONSeptember 9, 2020International is a registered trademark of, Inc.NYSE: NAV
Safe Harbor Statement and Other Cautionary NotesInformation provided and statements contained in this presentation that are not purely historical are forward-lookingstatements within the meaning of Section 27A of the Securities Act of 1933, as amended ("Securities Act"), Section 21E of theSecurities Exchange Act of 1934, as amended ("Exchange Act"), and the Private Securities Litigation Reform Act of 1995. Suchforward-looking statements only speak as of the date of this presentation and the company assumes no obligation to updatethe information included in this presentation. Such forward-looking statements include information concerning our possible orassumed future results of operations, including descriptions of our business strategy. These statements often include wordssuch as believe, expect, anticipate, intend, plan, estimate, or similar expressions. These statements are not guarantees ofperformance or results and they involve risks, uncertainties, and assumptions. For a further description of these factors, see therisk factors set forth in our filings with the Securities and Exchange Commission, including our annual report on Form 10-K forthe fiscal year ended October 31, 2019 and our quarterly report on Form 10-Q for the period ended April 30, 2020. Althoughwe believe that these forward-looking statements are based on reasonable assumptions, there are many factors that couldaffect our actual financial results or results of operations and could cause actual results to differ materially from those in theforward-looking statements. All future written and oral forward-looking statements by us or persons acting on our behalf areexpressly qualified in their entirety by the cautionary statements contained or referred to above. Except for our ongoingobligations to disclose material information as required by the federal securities laws, we do not have any obligations orintention to release publicly any revisions to any forward-looking statements to reflect events or circumstances in the future orto reflect the occurrence of unanticipated events.The financial information herein contains audited and unaudited information and has been prepared by management in goodfaith and based on data currently available to the company.Certain non-GAAP measures are used in this presentation to assist the reader in understanding our core manufacturingbusiness. We believe this information is useful and relevant to assess and measure the performance of our core manufacturingbusiness as it illustrates manufacturing performance. It also excludes financial services and other items that may not be relatedto the core manufacturing business or underlying results. Management often uses this information to assess and measure theunderlying performance of our operating segments. We have chosen to provide this supplemental information to investors,analysts, and other interested parties to enable them to perform additional analyses of operating results. The non-GAAPnumbers are reconciled to the most appropriate GAAP number in the appendix of this presentation.Q3 2020 Earnings – 9/9/2020NYSE: NAV2
Third Quarter 2020 Summary Persio Lisboa appointed President and CEO Q3 results lower YoY due to weaker industryconditions and COVID-19 Ended Q3 with strong manufacturing cashbalance of 1.6 billion Generated 154 million of manufacturingfree cash flow Actions underway to further improve cost structure 225million recovery zone bonds refinanced in August, lowering interest rate by 2full points New San Antonio plant will be capable of building both diesel and electric trucks Multiple strategic partnerships announced related to advanced technologies inautonomous and electric vehicles and in the area of connectivityNote: This slide contains non-GAAP information; please see the REG G in appendix for a detailed reconciliation.Q3 2020 Earnings – 9/9/2020NYSE: NAV3
Impact of COVID-19 PandemicBusiness Update Safety measures enhanced to protectour employees, communities andoperations Navistar 4.0 strategy remains focus Industry recovery underway followingeasing of states’ restrictions Navistar facilities remained open as anessential business Supply chain disruptions easing Parts distribution centers and dealerbodies fully operationalLearnings from the Pandemic April cash conservation activitiessuccessful Salary deferral program endedSeptember 1st Focus shifted to additional sustainablecost savings actions Evaluating facility footprint Pursuing outsourcing opportunities Flattening organizational structure Reducing third-party supplierexpenses SG&A goal of 7% to 9% of revenuesQ3 2020 Earnings – 9/9/2020NYSE: NAV4
Third Quarter 2020 Consolidated Results( in millions, except per share and units)ChargeoutsQuarters EndedJuly 31(A)Sales and Revenues (B) Net Income (Loss)Diluted Income per Share (Loss)(B)Adjusted Net Income (Loss)(C)(C)Adjusted EBITDAAdjusted EBITDA Margin(C)(A) Includes U.S. and Canada School buses and Class 6-8 trucks.(B) Amounts attributable to Navistar International Corporation.(C) Non-GAAP information; please see the REG G in appendix for a detailed reconciliation.2020201911,40024,400 3,042(37) 156 (0.37) 1.56 (8) 147 266 1,6751046.2%8.7%Q3 2020 Earnings – 9/9/2020NYSE: NAV5
Third Quarter 2020 Segments Results( in millions)Sales and RevenuesSegment Profit (Loss)Quarters EndedQuarters EndedJuly 31July 312020TruckParts 1,2032019 20202,387 2019(22) 16741457197149Global Operations479011Financial Services49741030Q3 2020 Earnings – 9/9/2020NYSE: NAV6
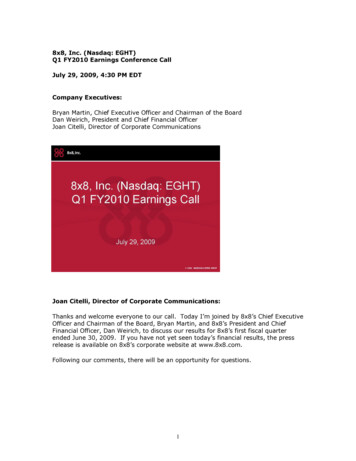
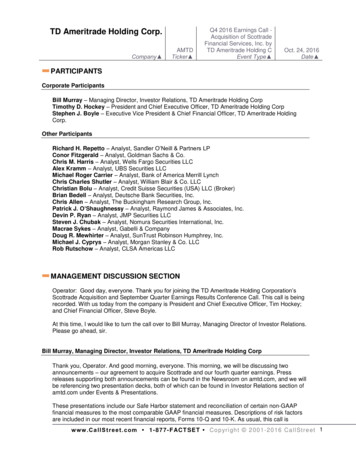
Strong Cash Balance,No Near-Term Manufacturing Debt Maturities( in millions)Manufacturing Debt Maturities(B)Manufacturing Cash Balance(A) 2,150 2,000 600April offeringof seniorsecured notesAugust refinancingof recovery zonebonds 1,550 1,100 1,000 225 020202021-20242025Note: This slide contains non-GAAP information; please see the REG G in appendix for a detailed reconciliation.(A)Amounts include manufacturing cash, cash equivalents, and marketable securities. Q3 2020 consolidated equivalent cash balance was 1.6 billion.Amounts exclude restricted cash.(B)Total manufacturing debt of 3.5 billion as of July 31, 2020. Graph does not include financed lease obligations and other, totaling 89 million.2026ThereafterNYSE: NAV7
AppendixQ3 2020 Earnings – 9/9/2020NYSE: NAV8
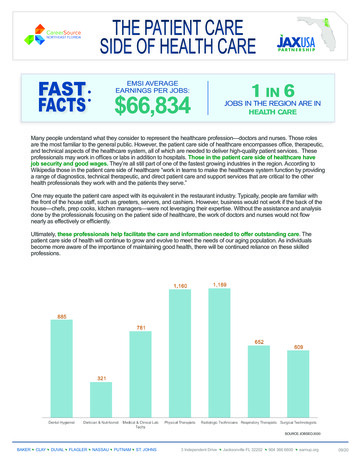
Days Sales Inventory On-Hand160140Days1401201008060Normal range is 80-120days inventory on hand40200Jul-14 Jan-15 Jul-15 Jan-16 Jul-16 Jan-17 Jul-17 Jan-18 Jul-18 Jan-19 Jul-19 Jan-20 Jul-20Includes US and Canada Class 6-8 company and dealer truck inventory, but does not include IC Bus*Calculation is based on the 3-month rolling average of inventory-to-retail sales ratioQ3 2020 Earnings – 9/9/2020NYSE: NAV9
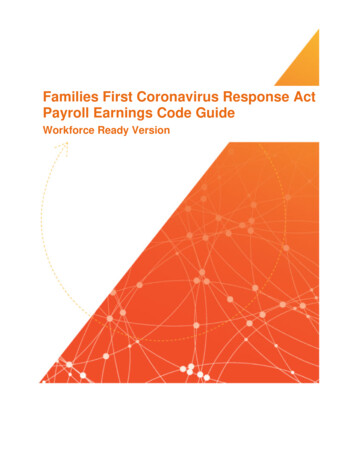
Retail Market Share in Commercial Vehicle SegmentsThree Months EndedJuly 31,2020April 30,2020January 31,2020October 31,2019July 31,2019Core Markets (U.S. and Canada)Class 6 and 7 medium trucks . 22.1%22.9 %20.3 %25.9%26.8 %Class 8 heavy trucks . 10.6%11.6 %6.1 %14.3 %13.8%Class 8 severe service trucks . 16.5%14.6%14.0 %19.7 %14.1 %Combined class 8 trucks . 12.6%12.5%8.5 %15.7 %13.9 %Class 6/7Medium-DutyClass 8HeavyClass 8Severe ServiceQ3 2020 Earnings – 9/9/2020NYSE: NAV10
Worldwide Truck ChargeoutsThree MonthsEnded July 31,2020(in units)2019%ChangeChangeCore Markets (U.S. and Canada)School Buses.Class 6 and 7 Medium Trucks .Class 8 Heavy Trucks .Class 8 Severe Service Trucks.Total Core Markets.Other Markets(A).Total Worldwide %)(50%)(53%)Combined Class 8 Trucks .5,30012,100(6,800)(56%)We define chargeouts as trucks that have been invoiced to customers. The units held in dealer inventory represent theprincipal difference between retail deliveries and chargeouts. The above table summarizes our approximate worldwidechargeouts.We define our Core markets to include U.S. and Canada School bus and Class 6 through 8 trucks.(A)Other markets primarily consist of Class 4/5 vehicles, Export Truck, Mexico, and post-sale Navistar Defense. Othermarkets include certain Class 4/5 vehicle chargeouts of 1,500 and 3,300 GM-branded units sold to GM during thethree months ended July 31, 2020 and 2019, respectively.Q3 2020 Earnings – 9/9/2020NYSE: NAV11
Financial Services SegmentHighlights Financial Services segment profit of 10M for Q3 2020 and 51M YTD 2020 Segment financing availability of 802M as of July 31, 2020 Financial Services debt/equity leverage of 3.1:1 as of July 31, 2020 Issued 300M of two-year dealer funding notes in July 2020NFC(1) FacilitiesDealer Floor Plan NFSC wholesale trust as of July31, 2020– 1,250M funding facility– Variable portion maturesMay 2021– Term portions mature Sept.2020, May 2021 and July 2022 On balance sheet1Retail NotesCAPITALFunded by BMO Financial Group Program management continuityBroad product offeringAbility to support large fleetsAccess to less expensive capitalNavistar Financial Corporation (NFC) is the U.S. financial entity of Navistar’s Financial Services segment.Bank Facilities Bank revolver capacity of 748M matures May 2024– Funding for retail notes,wholesale notes, retail accounts,and dealer open accounts 200M TRAC facility extendedto June 2021 On balance sheetQ3 2020 Earnings – 9/9/2020NYSE: NAV12
Frequently Asked QuestionsQ1: What is included in Corporate and Eliminations?A:The primary drivers of Corporate and Eliminations are Corporate SG&A, pension and OPEB expense (excluding amountsallocated to the segments), annual incentive, manufacturing interest expense, and the elimination of intercompany salesand profit between segments.Q2: What is included in your equity in income of non-consolidated affiliates?A:Equity in income of non-consolidated affiliates is derived from the ownership interests in partially-owned affiliates that arenot consolidated.Q3: What is your net income attributable to non-controlling interests?A:Net income attributable to non-controlling interests is the result of the consolidation of subsidiaries in which the companydoes not own 100% and is primarily comprised of Ford's non-controlling interest in our Blue Diamond Parts joint venture.Q4: What are your expected 2020 and beyond pension funding requirements?A:For the nine months ended July 31, 2020 and 2019, we contributed 30 million and 140 million, respectively, to ourpension plans to meet regulatory funding requirements. We expect to contribute 5 million to our pension plans duringthe remainder of 2020. During the nine months ended July 31, 2020, under provisions of the Coronavirus Aid, Relief, andEconomic Security Act, our previously expected remaining 2020 pension contributions of 157 million are deferred untilthe first quarter of 2021. During the first quarter of 2019, we accelerated the payment of a substantial portion of our 2019minimum required funding. Future contributions are dependent upon a number of factors, principally the changes invalues of plan assets, changes in interest rates, and the impact of any future funding relief. We currently expect that we willbe required to contribute to our pension plans in 2021 approximately 325 million, and in 2022 and 2023 approximately 185 million and 175 million per year, respectively, depending on asset performance and discount rates.Q5: What is your expectation for future cash tax payments?A:Cash tax payments are expected to remain low in 2020 and could gradually increase as the company utilizes available netoperating losses (NOLs) and tax credits in future years.Q3 2020 Earnings – 9/9/2020NYSE: NAV13
Frequently Asked QuestionsQ6: What is the current balance of net operating losses as compared to other deferred tax assets?A: As of October 31, 2019, the Company had deferred tax assets for U.S. federal NOLs valued at 465 million,state NOLs valued at 166 million, and foreign NOLs valued at 151 million, for a total undiscounted cashvalue of 782 million. In addition to NOLs, the Company had deferred tax assets for accumulated taxcredits of 196 million and other deferred tax assets of 1.2 billion resulting in net deferred tax assetsbefore valuation allowances of approximately 2.1 billion. Of this amount, 2.0 billion was subject to avaluation allowance at the end of FY2019.Q7: What adjustments do you make to the ACT forecast to align with company’s presentation?A:Reconciliation to ACT - Retail SalesACT*CY to FY Adjustment"Other Specialty OEMs" included in ACT's forecast; we do not includethese specialty OEMs in our forecast or in our internal/external reportsTotal (ACT comparable Class 8 Navistar)2020194,30015,000(5,000)204,300*Source: ACT N.A. Commercial Vehicle Outlook - August 2020Q8: Please discuss the process from an order to a retail delivery?A:Orders* are customers’ written commitments to purchase vehicles. Order backlogs* are orders yet to bebuilt as of the end of a period. Chargeouts are vehicles that have been invoiced to customers. Retaildeliveries occur when customers take possession and register the vehicle. Units held in dealer inventoryrepresent the principal difference between retail deliveries and chargeouts.* Orders and units in backlog do not represent guarantees of purchases and are subject to cancellation.Q3 2020 Earnings – 9/9/2020NYSE: NAV14
Frequently Asked QuestionsQ9: How do you define manufacturing free cash flow?A:Consolidated Net Cash from Operating Activities. Less: Net Cash from Financial Services Operations.Net Cash from Manufacturing Operations(A).Less: Capital Expenditures.Manufacturing Free Cash Flow.(A)Quarters EndedJul. 31, 2020( in millions)250Apr. 30, 2020 (17)179(200)25 (217)71154Jan. 31, 2020 31 (231) 99Oct. 31, 2019 346Jul. 31, 2019 29441014220(311)204274594424(370) 160 250Net of adjustments required to eliminate certain intercompany transactions between Manufacturing operations and Financial Services operations.Q10: What is your revenue by product type(A)?A:A.B.Includes other markets primarily consisting of Bus, Export Truck and Mexico.Retail financing revenues in the Financial Services segment include interest revenue of 13 million and 15 million for the three months ended July 31, 2020 and 2019, respectively.Wholesale financing revenues in the Financial Services segment include interest revenue of 6 million and 11 million for the three months ended July 31, 2020 and 2019, respectively.Q3 2020 Earnings – 9/9/2020NYSE: NAV15
Outstanding Debt BalancesJuly 31,2020( in millions)October 31,2019Manufacturing operationsSenior Secured Term Loan Credit Agreement, due 2025, net of unamortized discount of 5 and 6, respectively, and unamortized debt issuance costs of 8 and 10, respectively .1,547 1,5569.5% Senior Secured Notes, due 2025, net of unamortized debt issuance costs of 11.589-6.625% Senior Notes, due 2026, net of unamortized debt issuance costs of 13 and 15,respectively .1,0871,085Loan Agreement related to 6.75% Tax Exempt Bonds, due 2040, net of unamortized debtissuance costs of 5 at both dates.Financed lease obligations .Other .Total Manufacturing operations debt .Less: Current portion .Net long-term Manufacturing operations debt .22048413,532733,459 22060112,932322,900 July 31,2020( in millions)October 31,2019Financial Services operationsAsset-backed debt issued by consolidated SPEs, at fixed and variable rates, due serially through2022, net of unamortized debt issuance costs of 4, at both dates .Bank credit facilities, at fixed and variable rates, due dates from 2020 through 2025, net ofunamortized debt issuance costs of less than 1 and 1 respectively .Commercial paper, at variable rates, program matures in 2022 . 1,008 991914-1,05984Borrowings secured by operating and finance leases, at various rates, due serially through 2024105122Total Financial Services operations debt . .Less: Current portion .Net long-term Financial Services operations debt . .2,0277921,2352,2568391,417 Q3 2020 Earnings – 9/9/2020NYSE: NAV16
SEC Regulation G Non-GAAP ReconciliationSEC Regulation G Non-GAAP Reconciliation:The financial measures presented below are unaudited and not in accordance with, or an alternative for, financial measures presented inaccordance with U.S. generally accepted accounting principles ("GAAP"). The non-GAAP financial information presented herein should beconsidered supplemental to, and not as a substitute for, or superior to, financial measures calculated in accordance with GAAP and arereconciled to the most appropriate GAAP number below.Earnings (loss) Before Interest, Income Taxes, Depreciation, and Amortization (“EBITDA”):We define EBITDA as our consolidated net income (loss) attributable to Navistar International Corporation plus manufacturing interest expense,income taxes, and depreciation and amortization. We believe EBITDA provides meaningful information as to the performance of our businessand therefore we use it to supplement our GAAP reporting. We have chosen to provide this supplemental information to investors, analysts andother interested parties to enable them to perform additional analyses of operating results.Adjusted Net Income and Adjusted EBITDA:We believe that adjusted net income and adjusted EBITDA, which excludes certain identified items that we do not consider to be part of ourongoing business, improves the comparability of year to year results, and is representative of our underlying performance. Management usesthis information to assess and measure the performance of our operating segments. We have chosen to provide this supplemental informationto investors, an
NYSE: NAV Q3 2020 Earnings –9/9/2020 4 Impact of COVID-19 Pandemic Safety measures enhanced to protect our employees, communities and operations Navistar 4.0 strategy remains focus Industry r