Transcription
2 0 19A PUBLICATION OF THE NATIONAL INDEPENDENTAUTOMOBILE DE ALERS ASSOCIATION
22019 N I A DA U S E D C A R I N D U S T RY R E P O R T
W W W. N I A DA .CO M3
42019 N I A DA U S E D C A R I N D U S T RY R E P O R T
TABLE OF CONTENTS2019 USED CAR INDUSTRY REPORTSECTION 01 2018 NIADA MEMBERSHIP DATA.6SECTION 11 THE QUEST FOR ROI - AUTOSOFT.52SECTION 02 NIADA 2019 Q2 BUSINESS CONFIDENCE SURVEY.12SECTION 12 THE CARVANA BUSINESS MODEL: WHY IT WORKS - DOMINION/CROSS-SELL.56SECTION 03 BUY HERE-PAY HERE.14SECTION 13 SUBPRIME CREDIT & LENDING TRENDS - EQUIFAX.60SECTION 04 2018 NADA USED CAR SALES BY MONTH BY CHANNEL.22SECTION 14 RETENTION VALUES ANALYSIS - BLACK BOOK.64SECTION 05 2019 MARKET INSIGHTS AND OUTLOOK - COX AUTOMOTIVE.26SECTION 15 TIPS TO IMPROVE CREDIT APPLICATION APPROVALS - HOME LOAN AUTOMOBILE LENDING.66SECTION 06 2019 USED VEHICLE OUTLOOK - EDMUNDS.30SECTION 16 DEALERS GAIN IMPOUND FEE RELIEF - GOLDSTAR BY SPIREON.68SECTION 07 MERCHANDISING IN TODAY’S DIGITAL WORLD - CARFAX.36SECTION 17 THE DIGITAL CUSTOMER EXPERIENCE - ROUTEONE.72SECTION 08 2019 CAR BUYER JOURNEY STUDY - COX AUTOMOTIVE.40SECTION 18 MOBILE CHAT LEAD SUCCESS - OFFERUP.74SECTION 09 CLOSING THE TRUST GAP IN THE PURCHASE & TRADE-IN PROCESS - TRUECAR.44SECTION 19 AUCTION PERSPECTIVES:SECTION 10 CHANGING BODY STYLE TASTES - CARGURUS.48MANHEIM, ADESA, SERVNET, IAG, AMERICA’S AUTO AUCTION, BLACK BOOK.76LETTER FROM THE CEOINDUSTRYCONFIDENCEREMAINSSTRONG:CONTINUED GROWTH IN RETAIL SALES AND LOW UNEMPLOYMENT ARE KEY INDICATORSDEALERS REMAIN CAUTIOUSLY OPTIMISTIC AS THEY MANAGE INDUSTRY DISRUPTION AND THE UPCOMING PRESIDENTIAL ELECTION.by Steve Jordan, NIADA CEOThe 2019 Used CarIndustry Report perfectlydescribes this narrative asthe industry rebounds fromthe fluctuations in automotivelending and underwritingover the past couple of years.Prime and near-prime lenders arenormalizing their marketplace positionsand competing for customers with strongerincomes, and by extension are placingtighter restrictions on auto finance contractsfor non-prime and subprime customers.Auto lenders lending in their normalchannels is good for the industry, especiallyBuy Here-Pay Here dealers and operators.Our 2019 report begins with detailedstatistics and demographics from NIADA’smembers, and is a valuable tool for ourdealer members to compare their dealershipnumbers and operations to other dealermembers nationwide.Special thanks to those who take the timeto complete our membership surveys. Yourtime and effort is extremely important,ensuring statistical relevance and creating abenchmark for NIADA membership.The NIADA Business Confidence Survey(Section 2) continues to add a unique, realtime dealer perspective on the state of theindustry and its confidence regarding keybusiness indicators.The quarterly results, compiled withthe assistance of industry partner Equifax,are a great educational tool to pass on tolegislators, regulators, media and others whoseek better insight into the industry on atimely, consistent basis.As NIADA continues to educate national,state and local officials about the used autoindustry, our strong alliances with industryassociations like NADA, NAAA and NABD, aswell as our many industry vendor partnerswho assist with data efforts throughout thisreport are vital to our advocacy efforts.In Section 3, NABD provides in-depthanalysis of the Buy Here-Pay Here segmentfor the year past, along with forecasts forwhat BHPH dealers can expect for the rest of2019 and beyond.As mentioned, the Used Car IndustryReport is also filled with invaluable datafrom several of NIADA’s industry vendorpartners and leading nationally recognizedautomotive brands. These companiesspend millions of dollars on research ofthe used vehicle industry, including dealerand consumer studies and white papers,contributing to the overall perspective andconfidence we all have in the automotiveindustry.In Section 4, J.D. Power/NADA Used CarGuide provides a breakdown of used carsales by channel by month for the year2018, followed in Sections 5 and 6 by 2019in-depth market insights and outlooks fromCox Automotive and Edmunds. CPO dataand trends are also noted within Section 6on page 33. And speaking of CPO, our NIADACertified Pre-Owned program continuesto evolve with a brand new NIADA CPOinventory tool. Visit www.niadacertified.com for more information and to sign up tobecome an NIADA CPO dealer today.Moving on, our longtime industry partnerCARFAX kicks off a series of consumerstudies in Sections 7 through 10. Dealersneed to carefully review the researchgraciously provided by CARFAX, CoxAutomotive, TrueCar, and CarGurus, as thesesections detail merchandising in the digitalworld and provide updated informationon car buyers’ journeys from beginning ofsearch all the way to post sale. New TrueCardata provides a study on trade-in processtrust issues, and CarGurus is back for asecond year in our report with consumerdata detailing vehicle body style preferences.New data from AutoSoft in section 11focuses on dealer ROI. Dominion Cross-Sellin Section 12 provides a unique perspectiveon the Carvana business model and providestips on how to compete with it.Financial data from Equifax on subprimecredit and lending trends is noted in Section13. Industry partner Black Book once againprovides very important narrative andcharts on retention values in Section 14.Continuing with financial themes, Section 15,provided by Home Loan Investment Bank,offers tips to assist your customers in gettingcredit application approvals.GoldStar by Spireon in Section 16 providesa fresh perspective and data on impoundfee relief and how it affects dealers’ bottomlines. More consumer data is presented byRouteOne in Section 17, summarizing thelatest in digital consumer experiences in theautomotive finance industry.Dealer marketing is highlighted in Section18, as OfferUp details the rise of mobilemarketing and lead generation data throughthis growing marketing medium.Our report ends this year with a series ofAuction Industry Perspectives from severalauction industry partners and independentauction groups. The auction industry isa vital part of our industry, and NIADAcontinues to work closely with the NationalAuto Auction Association (NAAA) on manyinitiatives and programs to keep dealersand auctions informed, educated and on thesame page.I’d like to thank all of our industrypartners who help us make NIADA’s annualUsed Car Industry Report a must-have inunderstanding our industry.And I want to thank you, our dealermembers and our allied industry partnersfor your ongoing feedback and support ofour shared goals.A Publication Of The National Independent Automobile Dealers Association. Used Car Dealer (ISSN# 0279425X)is published monthly with one additional special issue, Used Car Industry Report, that is published in October by the National IndependentAutomobile Dealers Association Services Corporation, 2521 Brown Blvd., Arlington, TX 76006-5203; phone (817) 640-3838. Annual subscription rates for NIADA members: 8. Non-member subscription rates are 150. Periodicals postage paid at Dallas, TX.POSTMASTER: Send address changes to Used Car Dealer, 2521 Brown Blvd., Arlington, TX 76006-5203. The statements and opinions expressed herein are those of the individual authors and do not necessarily represent the views of Used Car Dealer or the NationalIndependent Automobile Dealers Association. Likewise, the appearance of advertisers, or their identification as member of NIADA, does not constitute an endorsement of the products or services featured. Copyright 2019 by NIADA Services, Inc. All rights reserved.W W W. N I A DA .CO M5
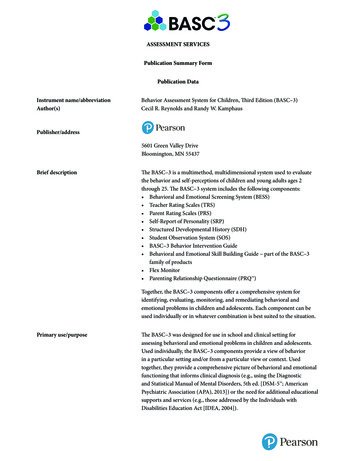
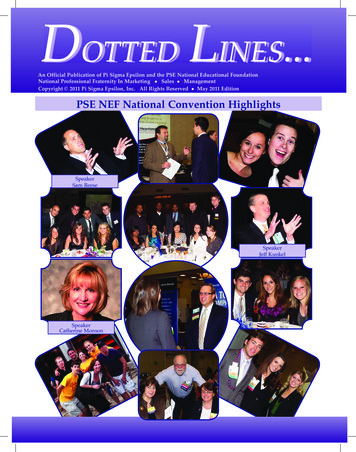
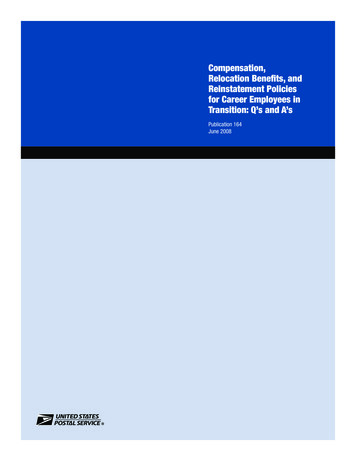
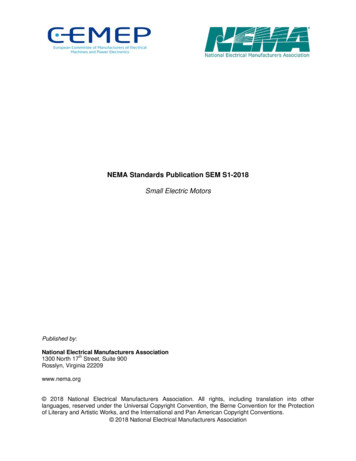
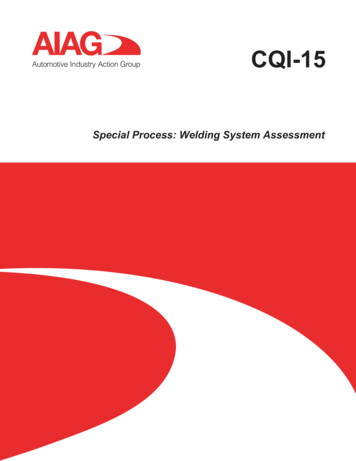
Section 01Major results of the member survey indicate theOne of the best ways to gauge thefollowing:success of your dealership and its O ver 55% of our membership sell vehicles in the 6-10operations is to compare your dealeryear old range.demographics and your dealer data O ver the past year there has been a big shift in theto those of other NIADA membersaverage retail price of vehicles sold by our members.around the country. Each yearOver 37% of our members are selling vehicles withNIADA surveys its members on aaverage retail prices of 5,000 or less, and 33% arequarterly basis on a variety of topicsselling vehicles in the 5,000 to 10,000 price range.covering demographic and business 7 3% of our dealer members sell 400 units or fewerdata.per year.In addition, we were able to pull 9 6% of our dealer members are single locationsix key data points of our dealerdealers.members from our InfoGroup data 6 5% of our dealer members have 1-4 employees.on page 7 of this section. The six N IADA dealer members overwhelmingly rely oncharts on page 7 are derived fromonline advertising as their main advertising avenue.over 9,200 confirmed dealer memberAlso, mobile advertising ranks third behind onlinerecords within our InfoGroup data,and radio among media used to promote theirproviding a 100% confidence levelvehicles.in the validity of the data on thisparticular page of the report.MEMBERSHIPDATAAge of Vehicles Sold(PERCENTAGE OF RESPONDENTS) SOURCE: NIADA MEMBER SURVEY2017 What is the Nature of Your Business?(PERCENTAGE OF RESPONDENTS)201855 SOURCE: NIADA MEMBER SURVEY 2018NOTE: NUMBERS WON’TNECESSARILY ADD UP TO 100%BECAUSE DEALERS CAN CHOOSEMORE THAN ONE CATEGORY.705020176045405035304025302015 SOURCE: NIADA MEMBER SURVEY352017 Average Retail Price2018(PERCENTAGE OF RESPONDENTS)SOURCE: NIADA MEMBER SURVEY 2017 hicles62019 N I A DA U S E D C A R I N D U S T RY R E P O R T51-7576-100101-200200 0-5,000 5,001-10,000 10,001-15,000 1%68.9%011 YEARSAverage Vehicles in Inventory(PERCENTAGE OF -2YEARS53.2%055.8%1028.3%530.5%4.2%104.5%20 20,001
SOURCE: INFOGROUP 2017Annual Retail Sales by Unit SOURCE: NIADA MEMBER SURVEY2018352017 20187.3%Annual Sales Volume6.2%Section 01NIADA INFO GROUP DATA3030252520201515less than 1million 1-2.5million 2.5-5million SOURCE: INFOGROUP 20170 - 100101 - 250251 - 40090302017 3.3%851 - 1000 SOURCE: INFOGROUP1000 20172018706070506040403030201-5 years6-10 years11-15 years16-20 years 2017singlelocation 9%4.0%96.1%021 yearsAdvertising Spend AnnualSOURCE: %22.8%27.0%596.0%205-9Dealership Size by Square Footage201835SOURCE: INFOGROUP8.5%10508.0%1510.1%2003.3%6.0%701 - 85020188025551 - 700Number of EmployeesSOURCE: INFOGROUP 7.1%401 - 550Multiple %0more than 10 million 5-10millionNumber of Years in 6.0%03.5%553.1%101010-19 201720 2018656030555025454020353015252010less than 10K 10-20k 21-50k 51-100kmore than 100kless than 2,500square feet2,500-10k squarefeet10k-40k square 2.4%22.0%28.1%28.0%33.7%35.0%066.0%107.0%155more than 40ksquare feetW W W. N I A DA .CO M7
Section 01NIADA MEMBERSHIP, FINANCINGHow do you Finance/Floorplan your Inventory? (PERCENTAGE OF RESPONDENTS)NOTE:2017 What Finance Options do you Supply to your Customers?2018 (PERCENTAGE OF RESPONDENTS)2017 2018NUMBERS WON’T NECESSARILY ADD UP TO 100% BECAUSE DEALERS CAN CHOOSE MORE THAN ONE CATEGORY.302525202015151010banksauction floorplanning49.6%0BHPHcashAdvertising Media Used(PERCENTAGE OF RESPONDENTS)566.1%31.8%027.5%27.5%5 2017 bankscredit unionAverage Down Payment2018NOTE: NUMBERS WON’TNECESSARILY ADD UP TO 100%BECAUSE DEALERS CAN CHOOSEMORE THAN ONE CATEGORY.80finance .5%555034.8%5553.6%6055.8%NOTE: NUMBERS WON’TNECESSARILY ADD UP TO 100%BECAUSE DEALERS CAN CHOOSEMORE THAN ONE CATEGORY.65 (PERCENTAGE OF RESPONDENTS) 201720185045704060355030402520301520Average Term of Contract (PERCENTAGE OF RESPONDENTS)2017 up to 1,000201835 1,001- 1,500If you are a BHPH Dealer,do you have a RelatedFinance Company?(PERCENTAGE OFRESPONDENTS) 1,501- 2,000 2,001- 2,5002017YES19.4% 2,501 2018YES38.3%30NO61.7%NO80.6%2520Separate F&I Department150-12 months13-24 months25-36 months2019 N I A DA U S E D C A R I N D U S T RY R E P O R T37-48 4.8%3.8%3.0%082018(PERCENTAGE OFRESPONDENTS)105201749 21.3%newspaper13.3%TV014.0%1010NO78.4%
W W W. N I A DA .CO M9
Section 01NIADA MEMBERSHIP, AUCTIONS, SERVICE, AFTERMARKET2540402030301520201010105What do you Spend per UnitReconditioning your Vehicles?5045 2017 none0How Many Service Bays do you Operate?(PERCENTAGE OF RESPONDENTS) 3020182017 201825353020%If Yes, What Functionsare 0%10%01-5Do you Sell Aftermarket Products? 201720186-10 11-2021-30NO74.3%YES26.2%NO73.8%2019 N I A DA U S E D C A R I N D U S T RY R E P O R T031 Do you Offer Certified Pre-Owned Vehicles? 20172018GPSSTARTERINTERRUPTPAYMENTREMINDERDo you Have a Rental Car Operation? 2017YES11.2%YES15.5%YES25.7%64.865 %.3%5.0%34.8%201760%YES46.6%10% 6 7.0%6.9%30% 201670%40%NO44.3%3-528.2%27.8%YES55.7% 2,001 1,001- 2,00020181-2Do you Use GPS Devices? 8.8%9.0%10.7%12.5%NO43.8%0If Yes, How Many Warranties/Service Contracts do you SellPer Month?50%YES56.2%018.5%18.8%13.4%14.1% 2017548.6%45.6%Do you Sell Warranties/Service Contracts? 16.0%18.2%43.7% 501- 1,0000- 25.8%202510201835(PERCENTAGE OF RESPONDENTS)4015.9%other dealerswholesalersauctions0online37.3%31.9%other 046.8%3082.8%6081.1%356037.0%407035.8%807044.8%80 30.1%20174528.4% 8 or more times90NOTE: NUMBERS WON’TNECESSARILY ADD UP TO 100%BECAUSE DEALERS CAN CHOOSEMORE THAN ONE CATEGORY.21.3%201823.0% 5-7 times90201747.0%NOTE: NUMBERS WON’TNECESSARILY ADD UP TO 100%BECAUSE DEALERS CAN CHOOSEMORE THAN ONE CATEGORY.46.6% 20181-4 times 1.5%201722.5% How Often Does your Dealership AttendAuctions Per Month? (PERCENTAGE OF RESPONDENTS)(PERCENTAGE OF RESPONDENTS)2.0%How do you Wholesale your Vehicles?Where do you Buy your Vehicles?(PERCENTAGE OF .0%NO89.2%
W W W. N I A DA .CO M11
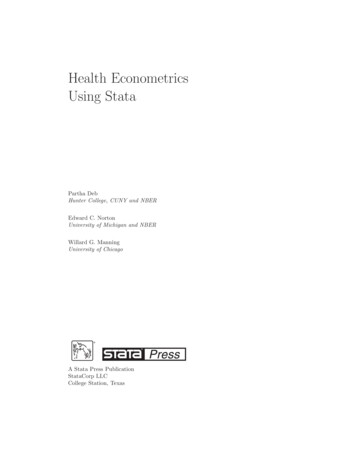
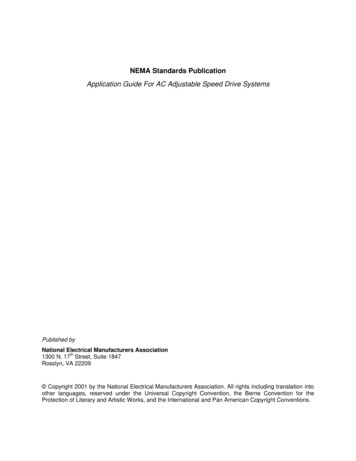
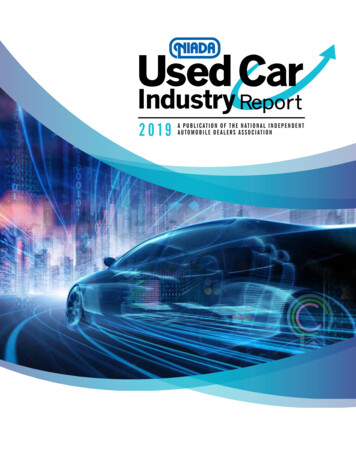
Section 02Not only did the number who believetheir cash flow would increase drop from52 percent to 46 percent, those who expectit to decline soared from 3 percent to 14percent. Similarly, 14 percent of the dealerssurveyed said they expected retail salesto decrease in the next quarter, up from 5percent in the previous survey.That sentiment aligns with theCommerce Department’s retail sales andmanufacturing activity report heading intoQ2. Retail sales fell a seasonally adjusted0.2 percent in April from the previousmonth, driven by declines in categoriessuch as electronics, home improvement,motor vehicles, auto parts and onlineshopping.The sagging retail sales could have beenan effect of tax refunds that weren’t aslarge as consumers expected, promptinghouseholds to put off major purchases.The April retail sales decline could alsobe a sign households were rattled by theU.S.-China trade dispute.In May, President Trump said tariffs on 200 billion in Chinese goods would riseto 25 percent from 10 percent, and leftopen the possibility of additional actionsas negotiations continue. China retaliatedby raising tariffs on 60 billion in U.S.imports.Dealers’ expense pressure expectationsQ2BUSINESSCONFIDENCESURVEYThe confidence of independent vehicle dealers in theeconomy softened heading into the second quarter of2019, according to the latest NIADA Business ConfidenceSurvey.The quarterly survey of NIADA members foundthe number of respondents expecting the economyto improve was down almost 10 percent from theprevious survey, dropping from 42 percent to 38 percent.In addition, expectations for higher retail sales andcustomer traffic growth both fell.The lack of confidence showed up in the 17.5 percentdecrease in dealers’ plans to invest in expanding theirbusinesses (from 40 percent in Q1 to 33 percent), and intheir doubt that cash flow would improve in the comingquarter.rose as wholesale inventory pricescontinued to hit record highs. Independentdealers are continuing to trim nonessential expenses, improve productivityand implement new technologies toincrease efficiencies.As a result, fewer independent dealerssaid they planned to add staff in any of thekey areas of the dealership – sales, financeand service – and 42 percent said theydon’t anticipate hiring at all, up from 36percent the quarter before.Fraud prevention is an important factorin holding down expenses, and the surveyshowed dealers were seeing less identitytheft, employment verification fraudand synthetic IDs than in the previoussurvey. But income verification fraud wasup significantly, with 50 percent of therespondents saying it’s the type of fraudthey see occurring most often.To address that concern, many dealersare using new technologies and resourcesto aid in the battle against incomeverification fraud and other schemes.By Scott Lilja andJennifer ReidScott Lilja is NIADA’s senior vicepresident of member services. Hecan be reached at scott@niada.com. Jennifer Reid is Equifax’s vicepresident of Automotive Marketingand Strategy Leader. She can bereached at jennifer.reid@equifax.com.Overall, does your dealership expect economic Do you anticipate your dealership’s totalconditions to improve, stay the same, orexpenses (cost of business) to increase, staydecline in the auto industry over the nextthe same or decrease over the next quarter?quarter?Did your dealership see fraud and cybersecurityrelated customer transaction issues increase, staythe same, or decrease during the last 6 months?Does your dealership plan to expand itsbusiness over the next quarter? (i.e. addnew equipment, enhance your building/property)Does your dealership expect customer trafficWhattypes of customer transactional frauddoyou see occuring most often?What percentage of the following categoriesmakes up your total retail automobile sales?Do you see your dealership’s cash flowimproving, staying the same, or decliningover the next quarter?Q3IMPROVE47%STAY SAME43%DECLI
Financial data from Equifax on subprime credit and lending trends is noted in Section 13. Industry partner Black Book once again provides very important narrative and charts on retention values in Section 14. Continuing with financial themes, Section 15, provided by Home Loan Investment Bank, offers tips to assist your customers in getting