Transcription
THE ZENDESKBENCHMARKYour Prescription for OptimizingCustomer Service
Table of ContentsIntroIntroducing the Zendesk BenchmarkWhat matters most: the key metricsZendesk Benchmark: the global resultsDigging deeper into the data: the benchmark metricsTicket metrics - direct one-to-one customer supportForum metrics - customer self serviceComparing metrics by industry, by use case, by company sizeYour prescriptionConclusionCoda: a bit about the sciencewww.zendesk.com support@zendesk.com 1.888.670.4887The Zendesk Benchmark: Your Rx for Optimizing Customer Service 2
IntroAs Zendesk has grown - over 20,000 companies now use Zendesk to engage their customers - we started thinking how cool and helpful itwould be if our customers could compare their customer service performance against their peers. After all, customer interactions producea lot of results - support tickets, forum page views, comments, tweets, customer satisfaction ratings, etc.; what better way to understandthese metrics than in the context of companies similar to your own?These metrics have always been available on an individual company basis. Zendesk users have these critical metrics front-and-centereverywhere. Agents can view the company’s satisfaction score; it’s easy to view web analytics for Zendesk forums; team leads and adminscan slice and dice key support metrics to their hearts’ desire.But as helpful as this data is to your individual company, it becomes even more valuable when you compare it with the 20,000 othercompanies that use Zendesk as well. That’s a big reason we’re all using these cloud-based software tools - to benefit from the wisdom ofcrowds; to share best practices; to optimize how we run our businesses.That’s what our new initiative, the Zendesk Benchmark, is all about.Introducing the Zendesk BenchmarkOver the past year, Zendesk has gathered key demographic and product usage data to produce our first Zendesk Benchmark. Thebenchmark is based on data collected from Q2 (April-June) 2012: over 20,000 help desks, 80 million tickets, 50 million forum page views,supporting over 65 million end customers.This isn’t your typical “expert” survey. We’re talking metrics based on real product usage and customer engagement. The benchmarkprovides you and your company: Insights based on actual help desk usage: metrics you need to measure your Support Volume, Support Efficiency andQuality of EngagementLoads of comparisons: compare yourself to the overall population of Zendesk-powered support teams; to your industrypeers; to companies of similar size; or to companies supporting similar end-users.In this paper, we are going to look at the metrics and industry segments that make up the Zendesk Benchmark. We will then provide somestrategies for how to improve your own metrics if you find yourself performing below that of your peers. If you are already familiar with thebenchmark and customer support metrics, feel free to skip ahead to the section about improving your own metrics.www.zendesk.com support@zendesk.com 1.888.670.4887The Zendesk Benchmark: Your Rx for Optimizing Customer Service 3
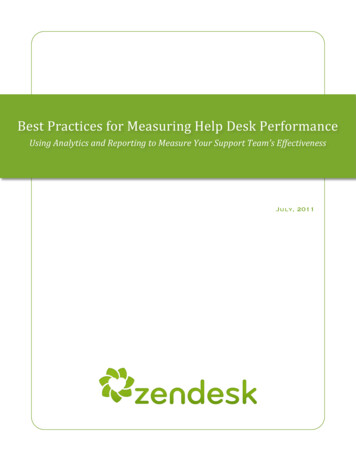
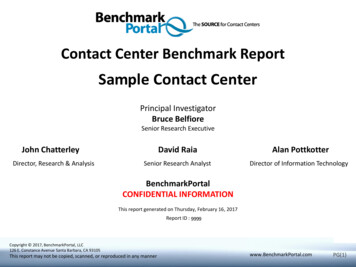
What matters most: the key metricsThe Zendesk Benchmark includes ten individual metrics, but with just three of them, you can measure your overall support performance.In geeky terms: Customer Satisfaction F(x) (Scale * Efficiency * Quality). In other words, if you efficiently deliver high-quality support at alarge scale, you can bet on having satisfied customers.Zendesk Benchmark: the global resultsWith that in mind, here are aggregated customer satisfaction, quantity, and efficiency metrics across the entire Zendesk customer basefrom www.zendesk.com/benchmark84%Customer Satisfaction777Tickets/Month24.2hrsAverage First Response Time Satisfaction. Ask any customer support person you know, and they’ll tell you the same thing: customer satisfaction is themeasure which matters the most. That’s why we built customer satisfaction ratings right into the Zendesk ticket flow.Across all of our customers, the average Satisfaction Rating is 86%. Pretty good. Scale. Let’s face it, size matters. Support teams these days must deal with a constant stream of tickets across many channels.Each ticket constitutes a customer interaction, so it’s a good measure of the frequency and scale of your customer touches.On average, a Zendesk-powered help desk handles more than 600 tickets per month. Efficiency. We don’t have unlimited budget and people, so we need to make sure we are delighting as many of our customersas efficiently as possible. This is why First Response Time is a great efficiency measure. The average first response time acrossall Zendesk tickets is almost 24 hours*. If you’re taking more than a day to get back to your customers, you may want to look atways to improve.*Note: we at Zendesk were actually surprised by this number; we don’t like seeing such a high First Response Time. Admittedly, some ofthat has to do with our math - we are looking at all of the tickets in your help desk, including non-critical issues and tickets that tend to situnopened for long stretches of time. Plus, this metric does not fully factor in business hours (a feature available only to Zendesk Plus andEnterprise accounts). However, we have noticed that many support teams do not address their customer issues quickly. This is one numberwe’d like to see drop across the board of all Zendesk users. In the words of one customer: “first response time is our best leading indicatorof customer satisfaction. When this slips, our customers will be unhappy.”Overall, the quality of your customer support is likely a function of these three metrics. Ask yourselves - how are you doing onthese measures?www.zendesk.com support@zendesk.com 1.888.670.4887The Zendesk Benchmark: Your Rx for Optimizing Customer Service 4
Digging deeper into the data: the benchmark metricsBeyond the three main metrics, we are tracking additional ones that can give you a more complete picture of how you compare with your peers.We’ve broken these metrics down into two categories -- ticket metrics: measuring how well a company delivers direct one-to-one customersupport; and forum metrics, which measure the level and success of a company’s customer self-service.Our goal is not to overwhelm you, but to provide a bit more context in case you want to see the contributing factors to customer satisfaction,support efficiency, and/or volume of customer engagement.Ticket metrics - direct one-to-one customer supportCustomer SatisfactionTickets per MonthFirst Response TimeTickets/Active Agent% Tix 1 Touch84%77724.2 hrs29483% Customer Satisfaction - overall customer satisfaction ratingTickets per Month - total volume of new ticketsFirst Response Time - average time it takes to respond to a new ticketTickets per Agent - number of tickets solved per active agent% of Tickets in One Touch - tickets are resolved in one human interactionForum metrics - customer self serviceForum ViewsForum:Ticket Ratio1,0301.4 Total Forum Views - number of page views your forum receives Forum View : Ticket Ratio - measure of customer self-service; the higher the number, the more your customers are serving themselvesComparing metrics by industry, by use case, by company sizeSeemingly every company wants to answer the same question about their support metrics: “how does this compare with my peers?”Whether it’s by industry, company size or primary customer support audience, we have you covered.Over 15,000 companies have opted into the Zendesk Benchmark. Because Zendesk’s customer base is so broad, this has allowed us togather metrics across 20 separate industries; across different size companies - SMBs, mid-sized and large companies; and across differenttypes of support teams - i.e. those which serve consumers, businesses or internal service desks. All of this means you can compare yoursupport performance against the performance of other companies by industry, size, and customer type.www.zendesk.com support@zendesk.com 1.888.670.4887The Zendesk Benchmark: Your Rx for Optimizing Customer Service 5
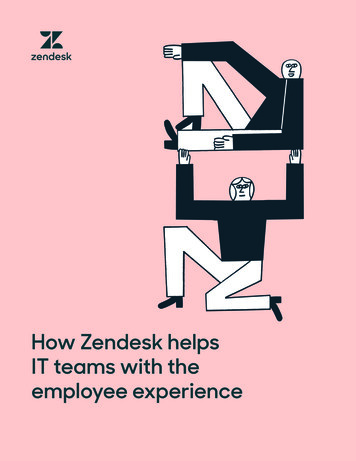
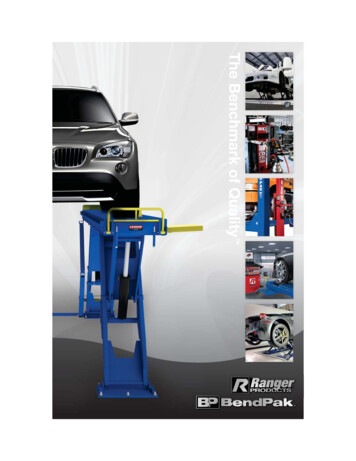
IndustryIndustryCustomerSatisfactionTickets perMonthFirstResponseTimeTickets/ActiveAgent% Tix 1TouchForumViewsForum : TicketRatioIT Services & Consultancy96%29525.6 hrs8862%6291:4Education95%56627.7 hrs13872%1,5121:1Entertainment & Arts80%1,82221.5 hrs53971%11,1493:7Financial & Insurance Services79%92525 hrs14172%3,8111:2Technology - Hardware85%46324.8 hrs12459%5,6538:1Healthcare96%53226 hrs14671%1,5681:9Technology - Hosting91%42019.3 hrs15264%1,4323:2Manufacturing82%45128.5 hrs11566%1,7861:1Marketing84%1,75724.5 hrs24068%8432:3Media & Telecommunications87%95021.3 hrs20368%2,9695:9Nonprofit88%45530.1 hrs12871%2,5762:9Professional Services90%45922 hrs12471%1,8194:3Real Estate93%30726.9 hrs11675%1,1511:2Retail & Wholesale78%1,64023.4 hrs32975%1,8864:7Social Media61%2,06420.8 hrs38174%7,7513:1Software88%62521.9 hrs14862%4,7658:7Personal & Business SupportServices74%226022.2 hrs15065%5,5392:3Travel, Hospitality & Tourism88%2,89422.9 hrs23872%11,9382:5Web Applications85%85422.1 hrs18167%3,5035:9Other70%1,96025.1 hrs18668%9171:6Average84%77724.2 hrs29583%1,0301:4Source: Zendesk Benchmark, June 2012Looking at the benchmark metrics by industry show some expected (and unexpected) trends: There’s a pretty clear correlation between slow response times and low customer satisfaction (social media andentertainment companies demonstrate this most).Hosting companies care a lot about First Response Time - they have the lowest first response time of any industry bya large margin.Love your health care provider? Your realtor? Your consultant? These three industries have the highest level ofcustomer satisfaction.Consumer-focused industries crank through the most tickets; and face very predictable challenges with scaling asupport organization (long wait times, low satisfaction levels).www.zendesk.com support@zendesk.com 1.888.670.4887The Zendesk Benchmark: Your Rx for Optimizing Customer Service 6
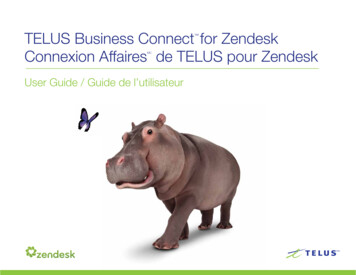
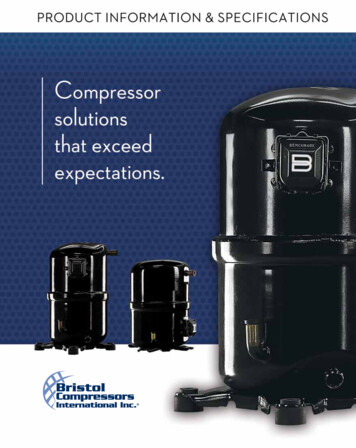
Company sizeCompany Size (# of Employees)CustomerSatisfactionTickets perMonthFirstResponseTimeTickets/ActiveAgent% Tix 1TouchForumViewsForum:Ticket Ratio1-991%26922 hrs13566%1,7134:910-9982%1,22023.8 hrs24168%4,4502:3100-49981%1,99628.4 hrs15769%7,0671:1500-499984%2,04529.5 hrs13570%4,5457:45000 82%1,04120.7 hrs20862%14,4364:1Average83%88723.6 hrs17667%3,5172:3Source: Zendesk Benchmark, June 2012Some observations here: Very small companies and enterprises score high on customer satisfaction, while the middle class (10-99 employees, 100-499)suffer to deliver high ratings. Could this be the struggles with scaling support operations?The very largest companies (5000 ) are the best at driving self-service support (Forum:Ticket ratio over 8).10-99 and 100-499 are handling by far the most tickets per agent - this would corroborate the statistic of low satisfactionratings for these size companies, and might be a flag for any company in this demographic. As you grow, don’t neglect yoursupport team!Target audienceTarget AudienceCustomerSatisfactionTickets perMonthFirstResponseTimeTickets/ActiveAgent% Tix 1TouchForumViewsForum: TicketRatioBusinesses92%38123.3 hrs9363%1,9054:3Consumers79%1,93621.5 hrs35573%6,1670:6Internal (employees)95%49228.7 hrs10469%1,1630:3Average83%88723.6 hrs16767%3,5172:3Source: Zendesk Benchmark, June 2012 Internal support teams (IT, service desks, etc.) have higher customer satisfaction ratings than teams that support eitherconsumers or other businesses. Are people being nice to their co-workers, or does internal IT get a bad rap? Consumer companies reasonably get more tickets than other industries, indicating that efficiency could be a potential problem.www.zendesk.com support@zendesk.com 1.888.670.4887The Zendesk Benchmark: Your Rx for Optimizing Customer Service 7
RegionWe can also look at differences by region. Here you have a list of satisfaction ratings of companies based in the highest-GDP countries:Australia93%95%Canada90%Germany85%United States86%United 0%France77%Source: Zendesk Benchmark, June 2012We could go on. The important thing is to compare yourself to companies similar to you. We discuss that - as well as what to do if you arenot quite up to par - in the next section.Your prescriptionOnce you understand the above metrics, you can better gauge the quality of your support as it compares to others in your industry, usecase and customer type. Of course, the goal is not just to understand, but also to improve your customer support and increase customersatisfaction. As we said above, customer satisfaction is tied to the quality and efficiency of your support. Once you see how you stack up invarious metrics, you can focus on those areas in which you can improve.www.zendesk.com support@zendesk.com 1.888.670.4887The Zendesk Benchmark: Your Rx for Optimizing Customer Service 8
ProblemWhat it probably means“Treatment”Best in ClassSlow responsetimesOn a basic level, this means that theamount of tickets each agent mustdeal with is increasing, or the amountof tickets your agents are replying to i.e. the productivity of your agents - isdecreasing.A two-pronged attack is good here:practice ticket deflection by offeringmore customer self-service options; andincrease the productivity of your agentsby automating their work flow where youcan and organizing the support landscape.Companies whoseaverage firstresponse time isunder 10 hourshave customersatisfaction over90%.In either case, this is a scale problem:as your business grows, so does theamount of support interactions. The moreof something you have, the harder it is tokeep on top of it.In Zendesk, you can take advantage ofthe Forums to post answers to frequentquestions as well as encourage yourcustomers to talk to each other.Metric: averagefirst response timeabove 24 hoursTriggers, Automations, and Macrosgive you many options for automatingcustomer workflow, including making itmuch quicker to answer frequently askedquestions and sending reminders to youragents when tickets need a response.Tickets taking toomuch effort toresolveMetric: % of ticketsresolved in 1 touch 75%A low first touch resolution percentagemight not be an issue. If the questionsaddressed by your support team aregenerally difficult or involved, they willneed a good amount of back and forth to beresolved effectively. Remember, customersatisfaction is the ultimate metric, andanswering something completely is betterthan trying to hit a home run with one swing.To increase the number of first touchresolution tickets, you want to ensurethat each question is handled by theperson best qualified to answer it. Youcan rely on either a manual or automaticsorting method, but either way, youwill want to create a system wherebyincoming tickets are analyzed and thenassigned to the most appropriate agent.That being said, if you see a big change inthis number, this could be a sign that thequality of the responses is declining or thedifficulty of questions asked is increasing.Again, increased scale will trigger this - themore tickets an agent has to answer, theless considered their response will be. But itcould also be a sign of poor training as yourteam grows.In Zendesk, you could first organize youragents into Groups according to theirspeciality - billing vs. technical support,say - and then select a group focusedmainly on sorting. They see all thetickets which come in (organized into aView), decide which group is best able toaddress that question, and then assign itto that group. Using Triggers, you couldthen send an alert out to each member ofthat group that there is a ticket requiringtheir particular attention.A good old-fashioned ticket audit will helpyou understand the change in your firsttouch resolution percentage. In Zendesk, youcan create a View of recently solved tickets(along with other parameters if you wish).This makes it easier to get a sense of whatis going on in your support organization.www.zendesk.com support@zendesk.com 1.888.670.4887High-volumesupport teamsresolve More than90% of tickets onfirst touchThe Zendesk Benchmark: Your Rx for Optimizing Customer Service 9
ProblemWhat it probably means“Treatment”Best in ClassHigh ticket volumeThis is usually a good sign and indicatesgrowth and customer engagement.The trick here is to not let high ticketvolume get in the way of customersatisfaction or support efficiency. Followthe previous advice about ticket deflection,including good quality forum content, andautomation and organization.Best-in-classcompanies withover 10,000tickets per monthdrive significanttraffic to theirself-serviceforums, with aForum:Ticket ratioabove 5:1Metric: # of ticketsper month above1,500If you are not prepared for this growthin ticket volume, it could become anefficiency or customer satisfactionproblem.With a lot of support requests comingin you should also get serious aboutreporting (if you are reading this whitepaper, hopefully you already are). Witha high ticket volume, small changes inyour help desk performance can affect alot of people. Stay on top of your supportby monitoring it. With the ZendeskGoodData integration, you get access toexcellent performance reports.Low ticketthroughput peragentMetric: 100tickets closed peragent per monthLow agent productivity generallyindicates something wrong in the supportworkflow. While it might be the case thatcertain agents are less productive thanothers, a general low ticket through-puthighlights a problem with the processas a whole. Often this shows up in twoways: unclear work flow - agents are notsure which cases need their attention;or inefficient work flow - agents aredoing more work than necessary andreplicating a lot of tasks.There can also be managementproblems, of course - low team morale,poor management, uninspired training,etc.Increase productivity by defining clear teamwork processes and utilizing tools thatspeed up those processes. Make sure yourteam has a method and structure to handleany case which comes in. Answer questionssuch as: what happens when a new ticket issubmitted? How should you respond if youdo not know the answer to the customer’sissue? What are the time targets for solvingeach ticket; and what do we do if a ticketexceeds those targets? Each support issueis a series of decision points - make sureeach person on your team knows thosedecision points. Build your support teamaround that process - in Zendesk, you canorganize your team using Groups.Best-inclass supportorganizationscan close upto 500 ticketsper agent in amonth, and havethe processes toscale.Once you define a process, look for thepoints where you could automate oruse your support tool to generally makethings more efficient. In Zendesk, you cancreate stock answers to commonly askedquestions, for instance (these are calledMacros). You can set up reminders for yourteam when a certain ticket has exceededyour target time limit with Automations.Understanding your process will help youuse your tool more effectively and increasegeneral agent productivity.www.zendesk.com support@zendesk.com 1.888.670.4887The Zendesk Benchmark: Your Rx for Optimizing Customer Service 10
ProblemWhat it probably means“Treatment”Best in ClassLow forum activityOffering customer forums are likethrowing a party - you want people toshow up and be in a good mood. If that’snot happening, it could be for a numberof reasons. First, do you have a forum setup? Is it populated with good, up-to-datecontent? Is that content organized in away meaningful to your users? Can yourusers find it from your Web site? If theanswer to any of those questions is no,it will lead to lower than normal forumactivity.Luckily, the fix here is simple, if notwithout effort. Forums are a “if you buildit (and show people the way), they willcome” scenario.Best-in-classcompanies candrive 50,000 views each monthto their Forums,and can
On average, a Zendesk-powered help desk handles more than 600 tickets per month. Efficiency. We don’t have unlimited budget and people, so we need to make sure we are delighting as many of our customers as efficiently as possible. This is why First Response Time is a great efficiency measure. The average first response time across