Transcription
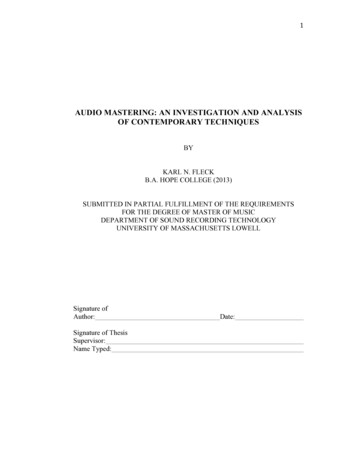
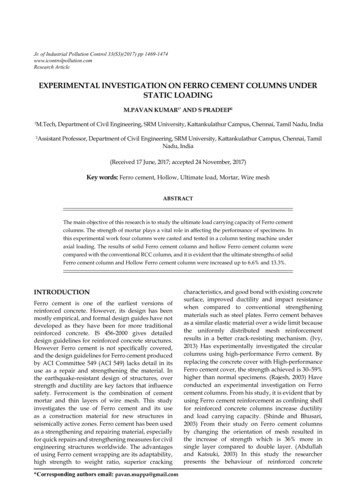
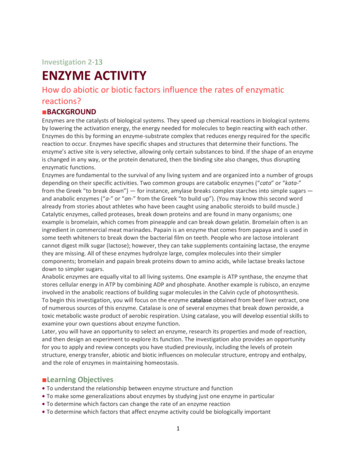
Engineering, 2010, 2, 141-148doi:10.4236/eng.2010.23020 Published Online March 2010 (http://www.SciRP.org/journal/eng/)Modeling and Investigation of the Wall Thickness Changesand Process Time in Thermo-Mechanical Tube SpinningProcess Using Design of ExperimentsAhmad reza Fazeli Nahrekhalaji1, Majid Ghoreishi1, Ebrahim Sharifi Tashnizi21Mechanical Engineering Department, KNToosi University of Technology, Tehran, Iran2Mechanical Engineering Department, Tafresh University, Tafresh, IranEmail: fazeli ar@ yahoo.com, ghoreishi@kntu.ac.ir, ebrahimsharifi@voila.frReceived August 9, 2009; revised September 14, 2009; accepted September 27, 2009AbstractTube spinning technology is one of the effective methods of manufacturing large diameter thin-walledshapes. In this research, effects of major parameters of thermo mechanical tube spinning process such aspreform's thickness, percentage of thickness reduction, mandrel rotational speed, feed rate, solution treatmenttime and aging treatment time on the wall thickness changes and process time in thermo-mechanical tubespinning process for fabrication of 2024 aluminum spun tubes using design of experiments (DOE), are studied. The statistical results are verified through some experiments. Results of experimental evaluation areanalyzed by variance analysis and mathematic models are obtained. Finally using these models, input parameters for optimum production are achieved.Keywords: Tube Spinning, Process Time, Wall Thickness Changes, Analysis of Variance (ANOVA),Regression, Interaction Effect1. IntroductionTube spinning is advanced metal forming process whichis used for reducing the wall thickness and increasing thelength of tubes without changing their inside diameters.For the tube spinning, there are two different methods,forward and backward tube spinning, depending uponthe relative directions of the material flow and the rollertravel. In both methods, the work piece is fixed in oneposition at one end and the remaining length is free toslide along the mandrel.In the forward tube spinning the roller move awayfrom the fixed end of the work piece and the work metalflows in the same direction as the roller, usually towardthe headstock, as shown in Figure 1.In the backward spinning of tubes, spinning metal isextruded beneath the roller in the opposite direction ofthe roller feed, usually toward the tailstock of the machine.Kobayashi and Thomson [1] performed an approximate analysis to solve spin-forging problems of tube,dividing the process into drawing and extrusion types.Hasimoto [2] experimentally studied the deformationmechanism of tube spinning with a model material (plasCopyright 2010 SciRes.ticine) and particularly inspected the strain distributionby using a flow function under the assumption of plandeformation in the circumferential direction. K. M. Rajanand K. Narasimhan [3] investigated the effects of heattreatment of preform material on the mechanical properties of the flow formed part and the validity of using empirical relations in predicting the properties of the flowFigure 1. Metal flow and roller travel in forward andbackward spinning of tube.ENG
A. R. F. Nahrekhalaji ET AL.142formed components. Y. Xu and S. H. Zhang [4] simulated distributions of stress and strain rate of the deformation by 3D rigid-plastic finite element method. Changand Wang [5] designed a new thermo mechanical treatment process in the tube spinning for fabricating 2024aluminum tubes. The designed process can be outlined insequential order as annealing, first spinning, solutiontreatment, second spinning and aging. They indicatedthat annealing and solution treatment can effectively recover the ductility of the spun tube.In this research, the influences of perform's thickness,percentage of thickness reduction, mandrel rotationalspeed, feed rate, solution and aging treatment time onprocess time and wall thickness changes for fabricating2024 aluminum tubes using DOE has been studied.It is desirable to know the effects of the major parameters and interactive influences among the processparameters on process time and wall thickness changesand relationship between process time, wall thicknesschanges and process parameters to obtain the best conditions of parameters for optimum production.For modeling and determining the influences of mainparameters and interaction effects among parameters ofthe process on time of process and wall thickness changes, DOE method has been employed. The DOE is a statistical method which is used to find the significance ofinteractive effects among variables and relations amongprocess parameters using variance analysis. Finally, using this model and suitable time of process, input parameters has been achieved for optimum production.2. Description of Material andThermo-Mechanical ProcessAll ductile metals are suitable for tube spinning. We havechosen 2024 aluminum as experimental sample, becauseit is suitable for tube spinning. The chemical compositionof this alloy (work metal) is presented in Table 1.During fabrication, the property of 2024 aluminumtubes must satisfy the spinning operation. Therefore, thepreform property requires appropriate heat treatment toincrease spin ability or to relieve residual stresses. In thisresearch the thermo mechanical treatment process designed by S. C. Chang and C. C. Wang [5] has been employed.Five processes of thermo-mechanical treatments whichare used in this study are as follows:1) The original preform is annealed completely in orderto unify the microstructure and accomplish the mechaniTable 1. The chemical compositions of aluminum alloy 2024.ElementsSiWeight(%) ght 2010 SciRes.cal process with appropriate spinnability. The aluminumtube annealing is conducted in temperature 410 for 2hours [6].2) The first tube spinning with 5% and 10% reductionrate in thickness was conducted.3) The solution heat treatment according to the references, the solution heat treatment is performed in thetemperature of 490 for 60 to 100 minutes. The solution condition was so the transformed structure is recovered and softened for the next operation [6].4) The second tube spinning with 5% and 10% reduction rate in thickness was conducted.5) The artificial aging is conducted in 190 for 2 or3 hours which creates the desirable mechanical dimensions and properties in the final tube.3. Experimental Modeling3.1. The Output ParametersOutput parameters process time and wall thickness changes measured in terms of minute and mm.3.2. The Input ParametersInput parameters were selected from the various parameters of spinning such as the properties of the work piecematerial, tools, mandrel rotational speed, rigidity of machine tools, type of coolant and feed rate of rollers. Theselected parameters are:- The initial thickness of perform part.- The percentage of thickness reduction.- The mandrel rotational speed.- The feed rate of rollers.- The time of solution treatment and aging.3.3. The Experiment ConditionsTwo rollers made of hardened steel were applied to implement the experiments. The radius of roller tip was 3.5mm, the roller diameter, 126 mm, the attack angle ofroller, 22.5 [8], the back angle of roller, 22.5 and theinternal diameter of preform was equal to the roller diameter.3.4. The Experimental DesignIt is difficult and expensive to perform all experiments.The DOE method can be employed as an efficient technique to accomplish the suitable and necessary experiments with high accuracy. To investigate main and multiple interactions between parameters [7], in this study, afractional-factorial design was employed with two levelsfor each parameter ( ,–), half fraction with resolutionENG
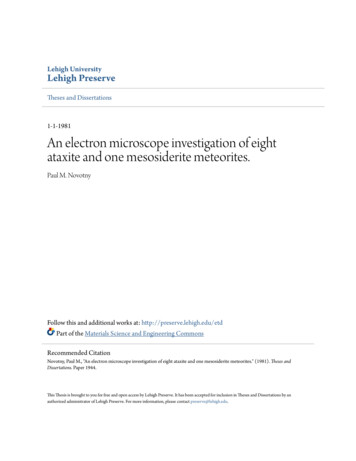
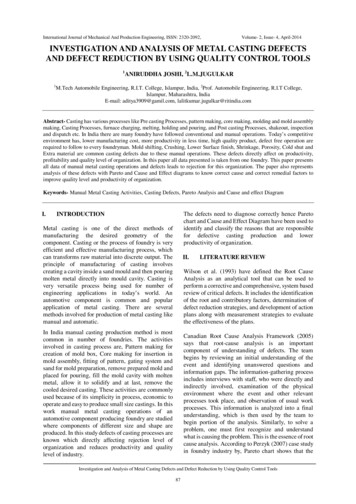
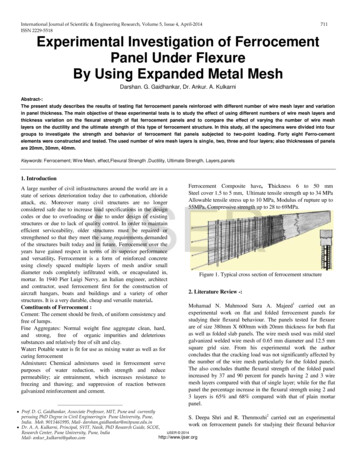
A. R. F. Nahrekhalaji ET AL.(VI). Table 2 shows the input parameters of the process.The procedure includes 32 experiments. The experimentswere divided into 2 blocks of 16 experiments in order toeliminate the effects of noise factors (uncontrollable factors), environmental factors (temperature, humidity) anderrors that arises from the human sources and measurement tools. Sixteen experiments were conducted in different days.Since the considered levels for each of the input parameters are two levels, the number of experiments isconducted to determine whether three levels is necessaryfor each parameter or not which is called the centerpoints. If these points were recognized as the effectivepoints by the analysis of variance, then the experimentsshould be performed in three levels. Table 3 indicatesthe center points. Figure 2 shows the spun parts. Figure3 shows the flow chart of the analysis.Derivation of interactiveinfluences and multiple linearequations with MINI TABsoftwareTable 2. The parameter levels.Parametersspeed of rotational speed (rev/min)vLow LevelHigh Level671140.170.3percent of thickness reduction %T510initial thickness (mm)T46solution treatment time (min)ts60100aging treatment time (hr)ta34feed rate of rollers (mm/rev)fTable 3. The applied center points in this study.TRun(mm)T%VftsTaΔt(rev/min) (mm/rev) (min) (hr) (mm)P-Values for 95%confidence level of 307383.333Copyright 2010 SciRes.Not(min)1Figure 2. The spun parts.143Figure 3. Flow chart of the analysis.4. Analysis of the Experimental ResultsThe analysis of variance (ANOVA) is a statistical method to investigate the importance and effect of the parameters. After statistical calculations and implementation of the F-test on the experimental data by ANOVA,probability values of each parameter are extracted fromthe table of variance analysis. The risk level as considered as 0.05 for the ANOVA.Once the experimental results are obtained, the coefficients and analysis of variance (ANOVA) are then calculated with MINI TAB software to determine the significance of the parameters, and the P-Values is used todetermine which parameter is most significant. The Fratio test is conducted to check the adequacy for theproposed model. Through experiments, internal diametergrowth and wall thickness changes are collected and thenfed into a DOE/STAT program to construct statisticalENG
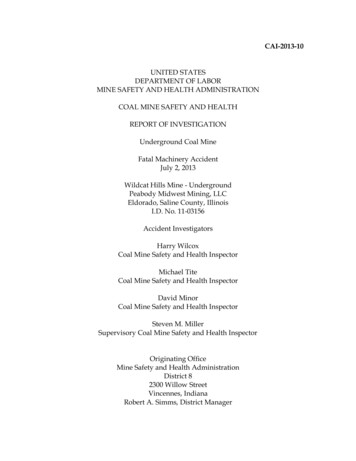
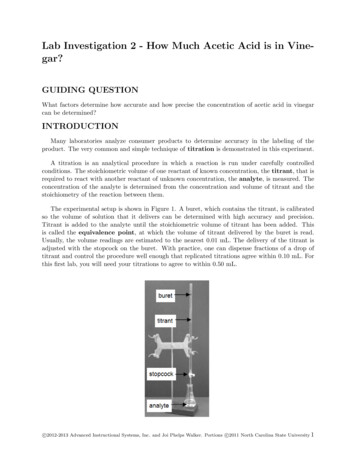
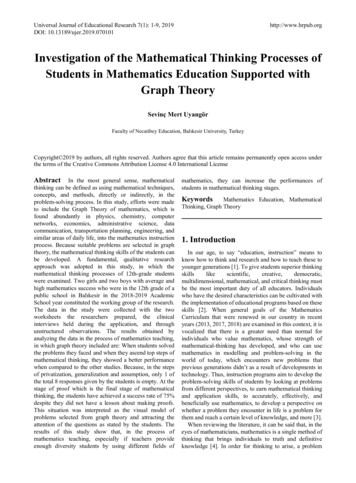
A. R. F. Nahrekhalaji ET AL.regression equations for achieving the initializing of input parameters for optimum production.4.1. Analysis of the Experimental Results on theWall Thickness Changes:After the initial variance analysis and elimination of theunimportant parameters (with low effect coefficient) anduse of projection (due to lack of repeat), and with regardsto the calculated values of F and P for each one of theeffective parameters which is extracted from the table ofvariance analysis, it can be concluded that the blockinghas no important effect on the wall thickness changes (P 0.830). Therefore we can eliminate this blocking fromthe variance analysis, and analyze the experiments again(Table 4). The risk level of less than 0.05 for parametersin Table 4 shows that the related parameter is significant.Also, in Table 4 it can be observed that the center pointshave no effect (P 0.94).Therefore, the two levels design is appropriate and wedo not need to consider the effective parameters in 3 ormore levels. The R squared and the adjusted R squaredare shown in bottom of the Table 4. Also, the lack offitness is insignificant which shows the adequacy of thedeveloped model. Figure 4 indicates the residuals analysis graph of the regression model. As it observed, theresiduals have a normal distribution.Table 4. The variance analysis (ANOVA) for the wall thickness changes.ParametersMain Effects2-Way Interactions3-Way InteractionsCurvatureResidual ErrorLack of FitPure ErrorTotalDOFAdj SSAdj 1.680.00.00.00.00.941.100.57R-Sq 99.29%Figure 5. The graphs of mean parameter effect on the wallthickness changes.R-Sq(adj) 98.49%Figure 4. Residuals analysis graph of the regression model.Copyright 2010 SciRes.Figure 5 shows the graphs of each input parametereffect on the wall thickness changes. Also, Figure 6 indicates interactions effects of the parameters on the wallthickness changes.Figure 6 shows that for the wall thickness changesthere are significant interactive influences among initialthickness and percentage of thickness reduction, feedrate of rollers and solution treatment time, mandrel rotational speed and aging treatment time.Also, thinner of initial thickness, small percentage ofthickness reduction, slower mandrel rotational speed,lower solution treatment time and higher of feed rate ofrollers lead to smaller wall thickness changes.Mean of wall thickness changes144Figure 6. The graphs of the parametric interactions effecton the wall thickness changes.ENG
A. R. F. Nahrekhalaji ET AL.Figure 7 summarizes the initial thickness on the wallthickness changes of tube spun at percentage of thicknessreduction. The result shows that decrease of initial thickness combined with the decrease of percentage of thickness reduction produces small wall thickness changes ofthe spun tube.Reasonably, the thicker the initial thickness and deeper the percentage of thickness reduction , the more energy is required for the material to deform and the deformation is contributed to the vicinity of the inner surface as the material flows in the radial direction and wallthickness changes tube spun increase.Figure 8 shows effect of mandrel rotational speed onthe wall thickness changes of tube spun at various initialthicknesses. Reasonably, at the slower mandrel rotationalspeed, the deformation is confined only to the vicinity ofthe outer surface as the wall thickness changes of tubespun decrease.4.2. Analysis of the Experimental Results on theProcess TimeAfter the initial analysis of variance, elimination of theunimportant parameters (with low effect coefficient) andusing projection (because of the few iterations), it can beconcluded that the blocking has no important effect on theprocess time (P 0.369), therefore we can eliminate thisblocking from the analysis of variance and analyze theexperiments again (Table 5). Also it means that the experimental condition is fixed and the out-of-control parameters such as temperature and humidity have no effecton the experiments.After elimination of blocking and applying the analysisof variance (Table 5), we observed that the center pointshave effect (P 0). Therefore, the design of experimentsis not correct and there is need to consider the mean inputparameters in 3 or more levels. Another parameter whichis very important in table ANOVA is the lack of fitnesswhich shows the correctness of regression analysis of theprocess time. The ineffectiveness of this parameter (P 0.312) guarantees the integrity of the Analysis.Figure 9 indicates the residuals analysis graph of theregression model. As it observed, the residuals have anormal distribution.Figure 10 shows the graphs of each input parameter’seffect on the process time. Also, Figure 11 indicatesinteraction effects of the parameters on the process time.As it was shown any parameter has not interaction effects on the others, then each parameter is consideredthrough the mean effect graph. Also, this graph indicatesthat all input parameters affect process time. According toFigure 9, the process time decreases as a result of increasing the initial thickness, mandrel rotational speed,feed rate of rollers and decreasing of the percentage ofTable 5. The variance analysis (ANOVA) for the processtime.ParametersFigure 7. Effect of the initial thickness on the wall thicknesschanges of tube spun at percentage of thickness reduction.Figure 8. Effects of mandrel rotational speed on the wallthickness changes of tube spun at various initial thicknesses.Copyright 2010 SciRes.145Main Effects2-Way Interactions3-Way InteractionsCurvatureResidual ErrorLack of FitPure ErrorTotalR-Sq %100.00DofAdj SSAdj .00.02.560.312R-Sq(adj) %100.00Figure 9. Residuals analysis graph of the regression model.ENG
146A. R. F. Nahrekhalaji ET AL.Figure 10. The graphs of mean parameter effect on the process time.Figure 11. Interaction effects of the parameters on the process time.thickness, solution treatment time and aging treatmenttime.5. The Predictor Model of Wall ThicknessChanges and Process TimeFinally, two hierarchical models were developed for wallthickness changes and process time by multiple linearregression technique. The insignificant terms were removed from the model and the final models were develCopyright 2010 SciRes.oped with significant terms which were determined byANOVA Equation (1) for wall thickness changes and (2)for process time. t 21.6194 0.1163(%T ) 0.6239(T ) 13.1253( f ) 0.0066(V ) 0.4012(ta) 0.249(ts) 0.0525(T %T ) 2.101(T f ) 0.846(%T f ) 0.7415( f ta) 0.0004(%T ts) 0.00003(V ts) 0.0032(T ts)(1) 0.0014(ts ta) 0.0006(T V ) 0.0286(T ta) 0.0523( f ts) 0.1692(T %T f ) 0.109(T f ts)ENG
A. R. F. Nahrekhalaji ET AL.t (min) 6602.36 59.73(ta ) 1.014(ts ) 1296.31(T ) 71.29(V ) 266.81( f ) 2(%T ) 14.20(T V ) 1.68(V f ) 33.75(T f ) 0.0066(%T V ) 0.14(T %T ) 1.45(%T f ) 0.0001(V ts )253(T V ) 0.157(V ts ) 54.78(T %T f ) 0.75(T ts ta )(2) 0.0147(T V ts )In order to check the reliability of the equations induced through regression analysis, independent experiments with process parameters different from the 35 assigned experiments, are selected. Table 6 demonstratesthe comparison of the prediction data derived from Equation (1) with the experimental results. The verification ofthe results shows that the developed models have acceptable error. From the results, it is sound that, the prediction error ranged within 13.63%.The verification of the results, Table 7, shows that thedeveloped models have acceptable error. From the results,it is sound that, the prediction error ranged within 1.11%.6. ConclusionsIn the present study, the thermo mechanical tube spinning process has been optimized by selection of significant input parameters including the initial thickness ofpreform, percentage of thickness reduction, mandrel rotational speed, feed rate of rollers, solution treatmenttime and aging treatment time. Finally, by means ofANOVA, the main effects of the input parameters andtheir interactions on the wall thickness changes andprocess time were determined. Based on the statistical147analysis of the experimental data the following conclusions can be obtained.1) With regards to the variance analysis and the effectof interactions between the input parameters, it can beconcluded that with the thinner initial thickness, smallreduction rate of thickness, lower solution treatment time,slower mandrel rotational speed and higher feed rate ofrollers, the wall thickness changes decrease, as a resultthe wall thickness changes reaches a suitable level.2) Also for process time, it was shown any parameterhas not interaction effects on the others, and each parameter is considered through the mean effect graph.Also, all input parameters affect process time and theprocess time decreases as a result of increasing the initialthickness, mandrel rotational speed, feed rate of rollersand decreasing of the percentage of thickness, solutiontreatment time and aging treatment time.3) In the thermo mechanical tube spinning process,blocking have insignificant effects on the wall thicknesschanges and process time. It means that noise factors(uncontrollable) have no effect on spinning process.4) In the thermo-mechanical tube spinning processcenter points have insignificant effects on the processtime and the wall thickness changes. It means that process can be modeled with two levels for each input parameters.5) Finally, with regards to the large number of effective parame
and Process Time in Thermo-Mechanical Tube Spinning Process Using Design of Experiments . Ahmad reza Fazeli Nahrekhalaji. 1, Majid Ghoreishi. 1, Ebrahim Sharifi Tashnizi. 2. 1. Mechanical Engineering Department, KNToosi University of Technology, Tehran, Iran . 2. Mechanical Engineeri