Transcription
Community DevelopmentIncreasing Financial Capabilityamong EconomicallyVulnerable Youth: MY Path Pilotand Year Two UpdatesVernon LokeEastern Washington UniversityMargaret LibbyMission SF Community Financial CenterLaura ChoiFederal Reserve Bank of San sNTER FORCEESTDecember 2013Working Paper 2013-03COEVDFederal Reserve Bank of San Francisco101 Market StreetSan Francisco, California 94105www.frbsf.org/cdinvestmentsWorking PaperNVFEDERAL RESERVE BANK OF SAN FRANCISCOINVESTMENT CENTERELOPMENTI
Community Development INVESTMENT CENTERWorking Paper SeriesThe Community Development Department of the Federal Reserve Bank of San Francisco created the Center for Community Development Investments to research and disseminate best practices in providing capital to low- and moderate-income communities. Partof this mission is accomplished by publishing a Working Papers Series. For submission guidelines and themes of upcoming papers, visit our website: www.frbsf.org/community-development. You may also contact David Erickson, Federal Reserve Bank of SanFrancisco, 101 Market Street, Mailstop 215, San Francisco, California, 94105-1530. (415) 974-3467, David.Erickson@sf.frb.org.Center for Community Development InvestmentsFederal Reserve Bank of San Franciscowww.frbsf.org/cdinvestmentsAdvisory CommitteeCenter StaffScott Turner, Vice PresidentFrank Altman, Community Reinvestment FundDavid Erickson, Center DirectorNancy Andrews, Low Income Investment FundGabriella Chiarenza, Research AssociateJim Carr, Center for American ProgressWilliam Dowling, Research AssociatePrabal Chakrabarti, Federal Reserve Bank of BostonLaura Choi, Senior Research AssociateCatherine Dolan, Opportunity Finance NetworkNaomi Cytron, Senior Research AssociateAndrew Kelman, KGS-Alpha Capital MarketsIan Galloway, Senior Research AssociateKirsten Moy, Aspen InstituteMark Pinsky, Opportunity Finance NetworkLisa Richter, GPS Capital Partners, LLCNTER FORCEDEVNVESTMMUNITYMENTSCOBenson Roberts, U.S. Department of the TreasuryELOPMENTIClifford N. Rosenthal, Consumer Financial Protection BureauRuth Salzman, Russell Berrie FoundationEllen Seidman, ConsultantBob Taylor, RDT Capital AdvisorsKerwin Tesdell, Community Development Venture Capital AllianceBetsy Zeidman, Consultant
Increasing Financial Capability amongEconomically Vulnerable Youth:MY Path Pilot and Year Two UpdatesByVernon Loke, Eastern Washington UniversityMargaret Libby, Mission SF Community Financial CenterLaura Choi, Federal Reserve Bank of San FranciscoDecember 2013The authors would like to thank the following individuals who generously volunteered their time to review draftsof this paper, providing valuable feedback and insight: Margaret Sherraden, Michael Sherraden, TrinaWilliams Shanks, Lew Mandell, Gail Bernstein-Gold, Vishnu Sridharan and Lauren Larin.The views expressed herein are those of the authors and do not necessarily represent those of the FederalReserve Bank of San Francisco or the Federal Reserve System.
AUTHORS’ NOTEDecember 2013The following report provides research findings from two different phases of “MY Path,” a financial capabilityinitiative that provides employed disadvantaged youth with peer‐led financial education trainings, a savingsaccount at a mainstream financial institution and incentives to set and meet savings goals. The initiative isoperated by Mission SF Community Financial Center (Mission SF), a nonprofit that strives to promote financialsecurity and catalyze economic mobility for lower‐income households.In 2011‐12, Mission SF began testing MY Path by delivering its suite of services to ten youth developmentagencies participating in San Francisco’s largest youth employment program, the Mayor’s Youth Employmentand Education Program (MYEEP). The findings from this pilot year (MY Path Year One) were originallypublished in a Federal Reserve Bank of San Francisco Community Development Working Paper (Working PaperNumber 2013‐03). Based on lessons learned from MY Path Year One, Mission SF implemented programadjustments for the second iteration of the program (MY Path Year Two) and conducted further research tounderstand the impact of these changes.The updated research findings from MY Path Year Two have been added to the original working paper. Thereport is organized as follows: Section 1: MY Path Year Two Update (2012‐2013) Section 2: MY Path Year One Report (2011‐2012)It should be noted that the MY Path Year Two Update assumes the reader is already familiar with the programspecifics and data analysis presented in the MY Path Year One Report. We hope this updated informationprovides greater insight into the evolution of the MY Path initiative and its impact on the savings behaviors ofeconomically vulnerable youth.
CONTENTSSECTION 1: MY PATH YEAR TWO UPDATE (2012‐2013) . 3MY Path Year Two Changes . 3Participant Profile . 4Key Savings Outcomes . 4Key Lessons from MY Path Year Two . 6SECTION 2: MY PATH YEAR ONE (2011‐2012) . 7Executive Summary . 7Introduction . 9The MY Path Model . 11The MY Path Pilot . 13Key Lessons from the MY Path Pilot . 14Next Steps . 20Conclusion . 21
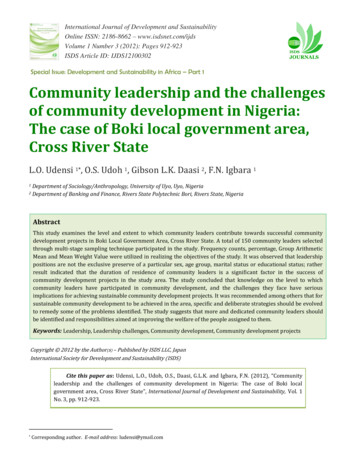
SECTION 1: MY PATH YEAR TWO UPDATE (2012‐2013)In its pilot year (2011‐2012), the MY Path program generated important lessons about how to ‘nudge’ savingsbehavior in low‐income working youth and young adults. Combining this information with participantfeedback, Mission SF made a number of changes to the MY Path program design for 2012‐2013. This briefhighlights the key outcomes related to savings behaviors seen in MY Path Year Two. The results show onceagain that low‐income youth participating in workforce programs are able to accumulate significant savingsthrough MY Path and develop regular saving habits. MY Path Year Two thus provides additional evidence thatshort‐term financial capability programs, with behavioral economics features, can have significant effects onthe financial capability of economically vulnerable participants in youth employment programs.MY PATH YEAR TWO CHANGESMission SF adapted the original MY Path program in several ways to enhance its impact on youth financialcapability. The key behavioral economics enhancements include the following:FULL DIRECT DEPOSITIn Year One of MY Path, participants designated part of their stipend to be direct deposited into their MY Pathaccount, and received the rest of their wages via paper check. In Year Two, all payments to participants weremade via direct deposit and split between two accounts—their MY Path savings account and an unrestrictedsavings account tied to an ATM card. Since participants had the ability to access their income in smallerportions, as opposed to having to cash a paper check in its entirety, this program enhancement made itsignificantly easier for them to leave more money in their accounts. As detailed below, participants were thusable to accrue significant ‘passive savings’ in their unrestricted savings account.REDEFINING SAVING GOALS AND USE OF ANCHORSIn Year Two, Mission SF made a change to the manner in which participants set their savings goals. In YearOne, participants selected a fixed amount of money to be deposited into their MY Path account every paycycle ( 20, for instance). In Year Two, participants selected a fixed percentage of their pay to be deposited intotheir MY Path account (for instance, 30 percent). This change introduced flexibility into the savings process, asthe amount saved varied along with the pay received. In addition, cognitive “anchors” were provided to guideparticipants’ savings decisions (see Figure A). These anchors provided savings rate recommendations at thetime that youth set their own goals, which contributed to overall increases in savings.Figure A ‐ Excerpt from MYEEP Participants’ Savings Goal WorksheetSUPER SAVERSaves 60 percentSAVVY SAVERSaves 40 percentSTANDARD SAVERSaves 25 percentPage 3
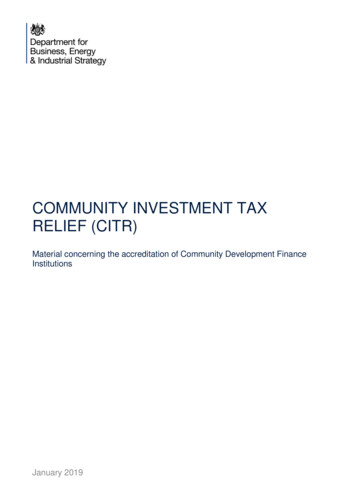
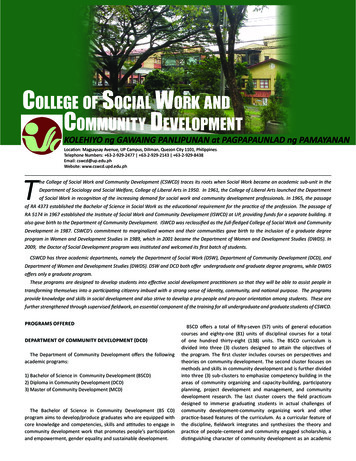
PARTICIPANT PROFILEData were drawn from 197 participants in the Mayor’s Youth Employment and Education Program (MYEEP)who consented to participate in the evaluation. Of these, 139 participants completed the pre‐training surveyand 109 participants completed the post‐training survey. Two‐thirds of the 197 participants were female, and11 percent reported that they had previous work experience. The ages of the youth ranged from 14 to 17 yearsat the time of participation, with the mean age being 15.5 years (SD 0.82). At that time, almost 36 percent ofthe participants were in the 9th grade and another 61 percent in the 10th grade.The participants came from economically disadvantaged backgrounds. Slightly over a quarter of participantscame from households with annual incomes of less than 5,000, and 24 percent from households withincomes of between 5,001 and 15,000. Another 14 percent came from households with annual incomes forbetween 15,001 and 20,000, while only 10 percent were reported household incomes from 45,000 andabove. Over two‐thirds of youth also came from households that received one or more types of publicassistance. Almost 41 percent of youths were from households that received food assistance, 51 percent werefrom households that received medical assistance (MediCal), and some 12 percent lived in public housing.KEY SAVINGS OUTCOMES1. INCREASED PROPORTION OF INCOME / ALLOWANCE SAVED EACH MONTHA significant difference in savings behavior was observed over the course of MY Path Year Two. Prior to MyPath, among those who reported that they received an allowance or some form of income (n 50), 20 percentsaid they did not save anything on a monthly basis, 46 percent saved a little, 22 percent saved about half, andonly 12 percent reported that they saved most of their money (see Figure B). In contrast, by the end of YearTwo (n 109), almost 39 percent reported that they saved most of their income each month, another 39percent reported that they saved about half of their income, and 21 percent reported that they saved a little oftheir income. After participating in MY Path Year Two, less than 2 percent of participants reported that theydid not save any of their income or allowance.Figure B – Self‐Reported Measure of Income/Allowance Saved Each MonthPage 4
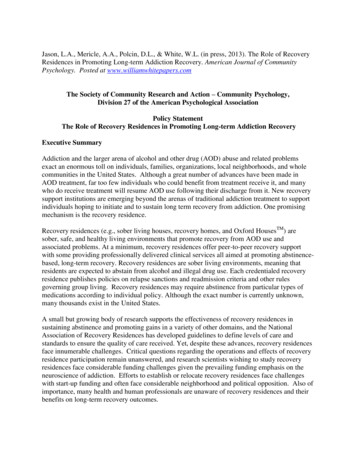
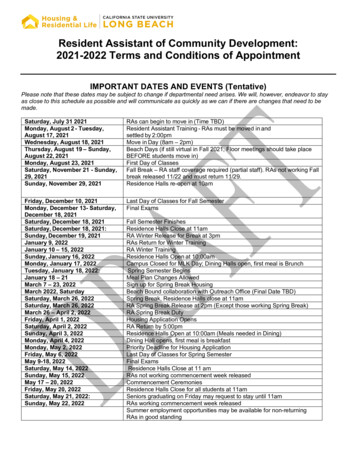
2. HIGHER SAVINGS GOALSAs part of MY Path Year Two, participants established a ‘savings contract’ at the beginning of the program,designating a percentage of their income to be automatically deposited into their restricted MY Path savingsaccount at each pay period. On average, participants designated about 47 percent of their paychecks to beautomatically saved each pay period (savings amounts ranged from 5 percent to 100 percent). In contrast, themean amount set as the savings goal in MY Path Year One was lower at 600, or about 41 percent of theprojected income that could be earned.The most common savings goal among participants was 50 percent of their paychecks (n 52). This is the mid‐point of the ‘savvy saver’ (40 percent) and ‘super saver’ (60 percent) anchors used in the savings contract. Thisis also substantially higher than the 25 percent anchor presented as a ‘standard’ saver. As seen in Figure Cbelow, other common savings goals were 30 percent (n 31), 40 percent (n 29) and 60 percent (n 26). Slightlyover 7 percent of participants set savings goals of less than 30 percent of their paychecks, while 11 percent ofparticipants had savings goals of more than 60 percent.Figure C – Distribution of Direct Deposit Allocations3. HIGHER ASSET ACCUMULATIONBy the end of MY Path Year Two, the 197 participants had saved a total of 134,323 in their restricted MY Pathsavings accounts. The individual amounts saved over the course of MY Path ranged from 5 to 1,590, with anaverage of 682 (SD 321). The median amount saved was 679. This is a significant increase over theaverage of 507 saved by participants in MY Path Year One (t(196) 7.64, p .001).Page 5
In addition, participants in MY Path Year Two accumulated ‘passive savings’ in their unrestricted savingsaccounts. Across the restricted and unrestricted savings accounts, participants accumulated a total of 238,452 by the end of the program. This averages to 1,210 (SD 501) per participant, with an individualrange of 140 to 2,251. The median amount accumulated was 1,163, which can be considered a significantamount of savings for youth and young adults of any economic background.KEY LESSONS FROM MY PATH YEAR TWOMY Path Year Two provides additional evidence that a timely and relevant financial capability intervention canhave a profound impact on economically vulnerable youth. In addition, it shows how the integration ofbehavioral economics principles can significantly enhance savings outcomes. In MY Path Year Two, participantsset higher savings goals, saved significantly more, and accumulated an impressive 1,210 on average in theiraccounts.An important change in MY Path Year Two was the automatic opening of an additional unrestricted savingsaccount tied to an ATM card, and the direct deposit of the entire paycheck. This change was guided by thebelief that in order to steer youth away from check cashers and other fringe financial services, there was aneed to eliminate paper checks altogether. In addition, by establishing the unrestricted account to receive thepaychecks via direct deposit, participants were placed in a default saving condition. Other financial capabilityprograms could similarly benefit by exploring opportunities to incorporate vehicles that facilitate passivesavings.MY Path Year Two participants also set higher average savings goals (47 percent of each paycheck) comparedto participants in the pilot program (41 percent). This increase in savings goals could be due, in part, to the useof cognitive anchors and the switch to specifying the savings goals as a percent of the paycheck, rather than afixed amount to be saved each pay period. The latter may have also contributed to the higher savings goals setby the participants because the amount they saved was flexible and sensitive to variations in their wages perpay cycle.Page 6
SECTION 2: MY PATH YEAR ONE (2011‐2012)EXECUTIVE SUMMARYAlthough the national economy is beginning to heal from the Great Recession, many low‐ and moderate‐income (LMI) households have been left out of the recovery and remain in financial peril. In order to achieveeconomic stability and enable economic mobility for the next generation, these families need the skills andopportunities to keep more of what they earn. However, LMI households tend to have less access tomainstream financial institutions and fewer opportunities to develop financial capability, compared to theirwealthier peers. This is particularly problematic for LMI youth as they are establishing long‐term financialbehaviors while facing an increasingly complex financial system.Although financial education efforts have led to mixed outcomes for youth, early research suggests thatfinancial capability initiatives may be a more promising approach. The primary difference between traditionalfinancial education and financial capability efforts is that the latter incorporates access to financial productsand services, in addition to the educational component. The Make Your Path (MY Path) initiative takes thisdistinction as its foundation to promote financial security and catalyze economic mobility by providingdisadvantaged youth with peer‐led financial capability trainings, a savings account at a mainstream financialinstitution and incentives to set and meet savings goals. The program focuses on youth earning their firstpaycheck—a critical “teachable moment” to promote savings and connect youth with mainstream financialproducts. MY Path uses a hands‐on, experiential approach, with an emphasis on peer learning and support,and helps youth develop healthy financial habits and behaviors. The key components of the MY Path initiativeinclude: Financial education sessions developed and delivered by peers;An emphasis on setting and achieving a savings goal;An opportunity for youth to engage with a mainstream financial institution and open savingsaccounts;The incorporation of behavioral economics principles, such as automatic deposits andsavings incentives such as matches and prizes.In 2011‐12, Mission SF Community Financial Center (Mission SF) tested MY Path by delivering its suite ofservices to ten agencies participating in San Francisco’s largest youth employment program, the Mayor’s YouthEmployment and Education Program (MYEEP). This research paper uses data collected from 280 youthparticipants across nine MYEEP sites. Over 86 percent of participants were from households that had annualincomes below half of San Francisco’s median household income of 71,304.Page 7
Early results of the MY Path initiative include: Participants saved an average of 507 over a six‐month period. Including incentives, each youth hadaccumulated an average of 735 though MY Path;Participants saved an average of 86 percent of their savings goal, and 46 percent fully met their savingsgoal.Consistent increases in youth financial knowledge after each training workshop;Increases in reported positive financial behaviors, such as budgeting, tracking spending, differentiatingbetween needs and wants, and saving;Increases in confidence about making financial decisions and comfort in doing business with amainstream financial institution; andIncrease in sense of control over money.There is significant potential to develop financial capability among working‐age low‐income youth, within thebroader context of youth development. While the MY Path pilot was relatively small and geographicallyfocused, the concept will be tested more widely in 2013. Specifically, next steps for the MY Path Programinclude: A more reflective financial education model that builds on individual youth’s experience and valuesaround money, and can be more easily delivered via MY Path’s new Train‐the‐Trainer model;The incorporation of “financial accountability partners” to build on MY Path’s peer focus and hold eachparticipant accountable and keep them motivated to reach their goals;Using incentives to establish an array of positive financial behaviors, in addition to saving; andLeveraging technology to expand access to
savings account tied to an ATM card. Since participants had the ability to access their income in smaller portions, as opposed to having to cash a paper check in its entirety, this program enhancement made it significantly easier for them to leave more money in their accounts. As detailed bel