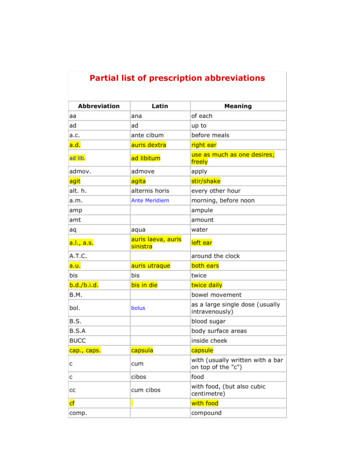
Transcription
Prepared for the General Services AdministrationBy the National Renewable Energy LaboratoryOctober 2020Continuous Monitoring andPartial Water Softening forCooling Tower Water TreatmentGregg TomberlinJesse DeanMichael DeruNREL/TP-7A40-76756
DisclaimerThis document was prepared as an account of work sponsored by the United States Government. While thisdocument is believed to contain correct information, neither the United States Government nor any agencythereof, nor the National Renewable Energy Laboratory, nor any of their employees, makes any warranty, expressor implied, or assumes any legal responsibility for the accuracy, completeness or usefulness of any information,apparatus, product, or process disclosed, or represents that its use would not infringe privately owned rights.Reference herein to any specific commercial product, process or service by its trade name, trademark,manufacturer, or otherwise does not constitute or imply its endorsement, recommendation or favoring by theUnited States Government or any agency thereof, or the U.S. Department of Energy’s National Renewable EnergyLaboratory. The views and opinions of authors expressed herein do not necessarily state or reflect those of theUnited States Government or any agency thereof or the National Renewable Energy Laboratory.The work described in this report was funded by the U.S. General Services Administration and the Federal EnergyManagement Program of the U.S. Department of Energy under Contract No. IAG-11-01815 and Task No. 10438 01.01.02.AcknowledgementsU.S. General Services Administration (GSA) Region 9: Jacob Lewis, Herb Orrell, Victor Gomez, Paul Davis and DarrellMcGirt.GSA GPG Program: Jay Fine and Kevin PowellAleut: Cody Adams, Paul Monroe and Ron ClarkNational Renewable Energy Laboratory (NREL): Gregg Tomberlin, Jesse Dean, Alicen Kandt, Mike Callahan, CarlannaCunninghamMountain Energy Solutions: Greg Barker and Paul NortonTenfold Information Design Services: Andrea SilvestriFor more information, contact:Jay FineGeneral Services AdministrationEmail: jay.fine@gsa.govMonitoring and Partial Water Softening for Cooling Tower Water TreatmentPage i
Executive SummaryBackgroundCooling towers are an integral component of many refrigeration systems, providing comfort or process coolingacross a broad range of applications. They are the point in the system where heat is dissipated to the atmospherethrough the evaporative cooling process. Cooling towers are commonly found in industrial applications and arealso often used in water-cooled chilled water plants in medium to large commercial buildings. Continuousmonitoring and partial water softening for cooling towers used in medium to large commercial buildings are thefocus of this paper.Cooling towers consume large amounts of water. Cooling tower-related water consumption is one of largestpotable water loads within buildings in the United States, with substantial building water use associated withheating and cooling. Regional water shortages have highlighted a need to reduce water consumption; the U.S.General Services Administration (GSA) and Executive Order 13834 place priority on reducing water consumption 1.This priority has fueled interest in the identification, investigation, and potential broad deployment of costeffective opportunities to reduce water use, such as alternative water treatment (AWT) technologies for coolingtowers.Traditional water treatment approaches use chemicals to extend the ability of the water to hold scaling mineralsin suspension, minimize corrosion, and prevent biological growth. This treatment protects the chillers and coolingtower equipment; however, even when chemicals are used regularly, a certain percentage of condenser watermust be drained and made up with fresh water to maintain system water quality parameters. In addition, theuse of chemicals sometimes creates a waste disposal issue and can cause building owners to incur additionalfees, such as disposal or wastewater charges. To manage cooling tower water treatment, GSA typically contractswith a company specializing in conventional chemical maintenance for a fixed fee.While there are many types and vendors of AWT systems, this project assesses the effectiveness of onetechnology provided by Aqualogix. This system is a chilled water plant monitoring and control system aimed atoptimizing system performance by reducing the blowdown occurrences used to remove mineral build-up. Thetechnology consists of two components – continuous programmable logic control (PLC) monitoring and sidestream filtration with partial water softening. PLC monitoring calculates cycles of concentration (CoC) anddetermines the optimum amount of blowdown water required to satisfy all water chemistry requirements. Sidestream filtration removes suspended matter and improves biocide efficacy while precisely dispensing softenedwater to achieve optimal makeup water hardness. Unlike other AWT systems evaluated by GSA to date, thissystem does not replace the legacy treatment system but is used in addition to chemical water treatment. Thevendor claims their technology will reduce water consumption, water discharge, and maintenance costs.The AWT system evaluated in this demonstration is a commercialized technology. Given itscommercialized state, the system evaluated in this report is at a Technology Readiness Level 9 2according to National Aeronautics and Space Administration (NASA) o13834/https://esto.nasa.gov/files/trl definitions.pdfTRL 6 Prototype System Verified (System/process prototype demonstration in an operational environment).TRL 7 Integrated Pilot System Demonstrated (System/process prototype demonstration in an operational environment).TRL 8 System Incorporated in Commercial Design (Actual system/process completed and qualified through test and demonstration).TRL 9 System Proven and Ready for Full Commercial Deployment (Actual system proven through successful operations in operatingenvironment and ready for full commercial deployment).TRL 10 Program Management and Market Development/Support ActivitiesMonitoring and Partial Water Softening for Cooling Tower Water TreatmentPage ii
This project assesses the effectiveness of this technology at lowering GSA’s operating costs and reducing coolingtower blowdown while maintaining proper water treatment. Considering that water-cooled chilled water plantsconsume approximately 23% of a building’s total water demand, any savings due to this technology could besignificant. The application of this AWT technology has the potential benefits of: Reducing water and water/wastewater costs by reducing the amount of blowdown required, thusallowing the system to operate at higher CoC. Providing decision-making information for GSA building and energy managers for application in aportfolio of Federal buildings.The GSA Proving Ground (GPG) program selected the Lloyd D. George Courthouse, located in Las Vegas, Nevada,as the test bed for evaluating the Continuous Monitoring and Side Stream Filtration technology provided byAqualogix. The building is approximately 450,000 square feet and is cooled using three chillers that receivecooling water from three rooftop cooling tower cells. There are two chillers rated at 450 tons and one chillerrated at 350 tons. The cooling season tails off in November and picks back up in April although some cooling isrequired year round. The cooling towers historically operated at about 2.8 CoC. Water treatment consists of ananti-corrosion agent, two separate biocides, and sulfuric acid to prevent scaling. The facility was selected for thisevaluation based on site selection criteria developed by the National Renewable Energy Laboratory (NREL),including a relatively long cooling season with consistent loads, minimizing the overall required evaluation period,and water chemistry and tower operation broadly representative of conditions found across GSA’s portfolio.The AWT system consists of a PLC controller and side stream filtration system mounted on a skid that isapproximately 91 inches tall, 40 inches long, and 40 inches wide. A separate brine tank is required, and has a 30by 30 inch footprint (black tank in Figure 1). The skid weight is 1,275 pounds (lbs) dry weight (1,625 lbs operatingweight) and is located in the chiller room as shown in Figure 1, below.Figure 1. – AWT System at Lloyd D. George CourthouseMonitoring and Partial Water Softening for Cooling Tower Water TreatmentPage iii
Measurements taken at the site included the flow of makeup water and blowdown flow to and from the coolingtowers and the AWT skid. Measurements of water in and out of the system define the CoC and the rate ofevaporation. These values were used to characterize the baseline water usage as it relates to evaporation or load.The same water balance measurements were used to calculate the water usage after the AWT was installed andcorrelate it back to a facility load. Additionally, the energy used by the AWT skid was measured. Measurementand verification (M&V) also evaluated the level of effort required for installation and commissioning and theimpact on operations and maintenance (O&M).The quantitative and qualitative performance objectives for this evaluation and associated M&V results aresummarized in Table 1, below.Table 1. Performance vingsMaintenanceSavingsWater QualityMetrics & DataSuccess CriteriaM&V ResultsMetered water consumption 8% makeup water savingsMet – Water consumption reducedby 15%. Blowdown reduced by52%.Metered blowdown 32% blowdown/wastewaterMaintenance records for currentcost of chemicals and labor duringdemonstration period and estimatedfuture maintenance for theAqualogix Lite system.No chemical cost increase for legacysystem (excluding salt).No increase in maintenance costs forcleaning and maintaining the system.Met – No increase in chemical ormaintenance costs (excluding salt).Water quality testingNo degradation in water qualityincluding pH, hardness, alkalinity, silicahigh range, chloride anions, salt anions,sulfate anions, phosphate, copper, iron,and biological growth.Met - No substantial changes inwater quality attributable to thevendor. 5-year payback 1.0 SIRSimple Payback - 7.5 years.although the site cooling load was1.6 million annual ton-hours, onlyabout half of the estimated 3million annual ton-hours. Highercooling loads could result in betterpayback results.SIR Met - 2.0Success CriteriaM&V Results 5 days to install and commission onecooling towerMet - Technology was installed in2 days.CorrosionMonitoringContinuous Electronic Corrosionmonitoring for copper and mild steelusing electrical resistance betweenprobe points.System is alarmed when the coolingtower water reaches a corrosivethreshold using pH and conductivitymonitors. Verified independently withplant meters for pH and conductivity.Met - There were no corrosionexcursions on the Aqualogix Litesystem and therefore no alarmswere seen.OperabilityInterview with operations andmaintenance staffFacility operators have no issues withtechnologyMet - No issues were reported bythe site staff.Cost EffectivenessQualitativeObjectivesEase of InstallationSimple PaybackSavings-to-Investment Ratio (SIR)Metrics & DataInterview with installer. Timerequired to install and configureMonitoring and Partial Water Softening for Cooling Tower Water TreatmentPage iv
QuantitativeObjectivesSite SafetyMetrics & DataSuccess CriteriaM&V ResultsChemicalsNo hazardous chemicals used by theAqualogix Lite system.Met - No additional chemicals usedexcept for salt. Loading sacks ofsalt into a hopper did notconstitute a health issue.Testing consisted of a 1 month baseline period (September, 2018) and a three month evaluation period (Julythrough September, 2019) enabling sufficient data to be acquired to account for differences in ambienttemperature and cooling system duty between the baseline and evaluation periods.Water and wastewater savings exceeded success criteria established at the project outset. The waterconsumption during the baseline period was 178 gallons per MMBtu of heat rejected. During the AWT testingperiod, water use dropped to 150 gallons per MMBtu for a savings of 15% or 27 gallons per MMBtu. Wastewaterdischarge reduction was calculated to be 52%. The annual load was measured at 19,356 MMBtu per year yieldinga projected annual water savings of 528,673 gallons. Using this specific site’s water rate of 12.59 per thousandgallons (kgals) and the estimated heat load for an entire year, the total annual water cost savings were estimatedto be 6,656. Wastewater cost savings were not relevant in this case as the wastewater costs are a fixed monthlycost and independent of flow rates at this flow range. However, if wastewater rates were applicable, theeconomics could only be improved.There were no chemical savings or additional costs as the legacy chemical treatment regime remained constantduring both testing periods.The cost of the AWT system equipment was 30,016 including shipping. The payback period calculation isoutlined below in Table 2.Table 2. Economic SummaryDescriptionTestbed 3EstimatedGSA PortfolioNotes4COSTSEquipment cost for 200-1000 tonload ( )Installation cost ( )Annual maintenance increase( /year)34 30,016 30,016 8,355 8,355 783 783Base unit only. No remote monitoring of pH,corrosion, ORP. Includes startup. Assumes 2,000shipping and 1,473 for training. Pricing is discountedfor GSA installations. 5,700 at testbed. 2,655 added to account for skidpiping costs (piping was already in place on site at testbed from previously installed (and removed) AWTtechnology) 250 for annual calibration and salt receiving andloading; 533 for saltCalculations using data measured at testbed during baseline testing.Calculations performed at target load and average GSA water costs of 16.76 per kgal.Monitoring and Partial Water Softening for Cooling Tower Water TreatmentPage v
DescriptionAnnual water savings (kgal/year)Testbed 3EstimatedGSA Portfolio528,673983,273Annual water cost savings ( /year) 6,656 16,480Annual technology electricity use(kWh/year)7,7357,735Annual increase in electricity cost( /year) 774 851Total annual savings ( ) 5,100Notes4Target load for technology is 3 million annual tonhours/250 ton average load. Although test bed wasprojected to meet target load 5, the measured loadwas 1.6 million annual ton-hours or 187-ton averageload. Portfolio estimate reflects target load.Testbed water cost 12.59/ kgal; portfolio estimatereflects GSA average water rate of 16.76/kgalTestbed electricity cost 0.10/ kWh; portfolioestimate reflects GSA average electric rate of 0.11/kWh 14,846Payback (years)7.52.6SIR2.05.8Column 2 (Testbed) in Table 2, above, represents the initial results. Column 3 (Estimated GSA Portfolio) shows theestimated economics had the system operated at 3 million ton-hours of cooling for a year and assuming a watercost of 16.76 per thousand gallons which represents the GSA portfolio average. The size range of 3 million tonhours per year was the initial system size goal for the testing program. Economics are sensitive to scale and thechosen site had less load than originally anticipated.Data to correctly identify annual load is essential to right sizing the system and optimizing payback. The site providedinaccurate data, therefore the system was oversized, and payback was extended.5Monitoring and Partial Water Softening for Cooling Tower Water TreatmentPage vi
Table of ContentsPageExecutive Summary . iiI.Introduction . 9A. What We Studied. 9B. Why We Studied It . 14II.Evaluation Plan . 15A. Evaluation Design . 15B. Instrumentation Plan . 17C. Test Bed Site . 21D. Methodology . 22III.Demonstration Results . 23A. Quantitative Results . 24B. Qualitative Results . 29C. Cost-Effectiveness. 31IV.Summary Findings and Conclusions . 33A. Overall Technology Assessment At Demonstration Facility . 33B. Lessons Learned and Best Practices . 34C. Deployment Recommendations . 34V.Appendices . 40A. Economic Analysis. 40B. Manufacturer Cut Sheet . 40C. IT Security and Continuity of Connectivity . 41D. Technology Market Readiness . 41E. Vendor estimate for deployment savings. 42List of TablesTABLE 1. PERFORMANCE OBJECTIVES . IVTABLE 2. ECONOMIC SUMMARY . VTABLE 3. QUANTITATIVE OBJECTIVES . 16TABLE 4. QUALITATIVE OBJECTIVES . 16TABLE 5. WATER QUALITY CRITERIA (AS DEFINED BY GSA) . 17TABLE 6. MONITORING POINTS AND INSTRUMENTA
technology provided by Aqualogix. This system is a chilled water plant monitoring and control system aimed at optimizing system performance by reducing the blowdown occurrences used to remove mineral build -up. The technology consists of two components – continuous programmable logic control (PLC) monitoring and side-