Transcription
Machine learning for water monitoring,hydrology and sustainabilityKevin SwerskyJoint work with Touraj Farahmand, Nando de Freitas, MichaelOsborne, Roman Garnett, Ryan Turner and others
OutlineWhy is water monitoring important?How is it done?How can machine learning help?What have we done so far?
The water industryFresh water is a limited resourceEstimates of Canadian economic impact rangefrom 7.3B- 23BIndustries directly tied to water include:AgricultureMiningForestryHydro powerWaste managementEssential to the health and well-being of bothpeople and the environment
Effects of climateChanging climates are creating watershortages and changing flood patternsExtreme weather is becoming the new normUrban supplies are under stressFrom 1994 to 1999 26% of Canadianmunicipalities reported water shortages dueto increased consumption, drought, orinfrastructure problems
Water MonitoringIt is rare to find one level of government with solejurisdiction over water monitoring. Typically shared bymany levels.Data is needed for:Allocation, engineering design, prediction and forecasting,environmental impact assessments, transportation,fisheries and ecosystems management, resourceextraction, industrial use, recreationMonitoring is needed because water is not distributedevenly in space and timeUnderstanding its distribution can lead to solutions whenwater is temporarily unavailable
The linkage between water and the economy is so compelling that decisionsabout water are rarely deferred. Decisions that are uninformed almostalways have unintended consequences, with impacts on the environment,health, and society.
Water monitoring in North AmericaWater Survey of Canada2400 stream gage stations28 regional offices200 end usersUS Geological Survey7500 stream gage stations500 staff using AQUARIUS RatingCurve (GRSAT)National Streamgaging NetworkLocations using AQUARIUS ( 11,000)www.aquaticinformatics.com 7
Aquatic InformaticsVancouver based software development company200 customers in North America, Australia, Asia andEuropeFederal/State/Municipal Government AgenciesEngineering Consultants / HydropowerAny organization responsible for managing water
AquariusAquatic InformaticsProvides Customer Support, Customer Service, Training and Product DevelopmentAQUARIUSIs software for hydrologists and water resource managersIs the de facto standard in North America for hydrometric Time Series datamanagement and Rating Curve development.
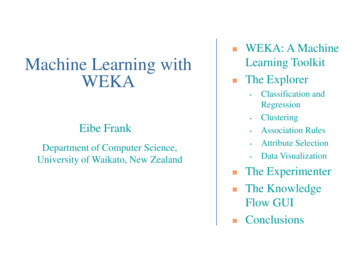
Data acquisition and managementObserved telemetry signal aftercomm. reception and decodingReal Parameter from Natural EnvironmentComm.outliersComm.GapReal abnormaleventData LoggerComm. LinkDataAcquisitionand DecodingTelemetryDataDataManagementSystemSite visit and logger data filesSensor Signal before comm.transmission (Logger signal)SensoroutliersSensorDriftField measurementsCalibration ErrorsFouling ErrorsLogger data file
Data processing pipeline
How can machine learning help?Machine learning can automate, simplify and improvemany aspects of water monitoring including:1)2)3)4)5)Improving modeling and analysisDetecting and correcting equipment malfunctionsDetecting environmental anomaliesPredicting the effects of policy decisionsAutomating and controlling allocation and distribution
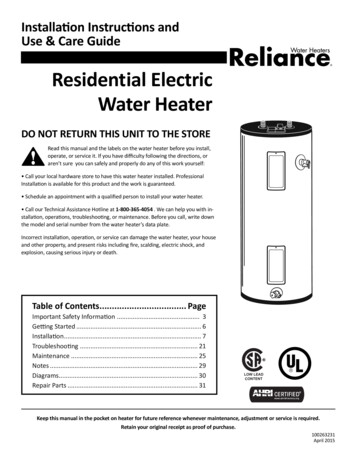
Common water quality indicatorsFor each signal: 1 point every 5-15 minutes 30,000-100,000 points per year per signal
ChallengesEnvironmental time series in generalare complex and hard to modelProblems:Highly non-stationaryHighly non-linearMany changes in dynamicsCan contain outliers, anomalies, gaps, etc.Our models need to be:GeneralFlexibleRobustInterpretableFast and efficient for real-time applicationsEasy to setup and use
Our first approach is develop good probabilistic modelsfor several basic problemsGap filling/forecastingFault detectionAnomaly/outlier detectionProbabilistic models provide many beneficial propertiesthat are important in an industrial settingConsistent, unified frameworkProvides uncertainty in resultsSuggests natural extensions to deal with many kinds of issues
Univariate modelsWe use Gaussian processesto model univariate seriesFlexible, easy to use, tunableparameters are intuitive(choosing kernels)Sparse Gaussian processescan help with speed(Snelson 2006,Titsias 2009)Issues: heteroscedasticity,nonstationarity, spike noise,changepointswww.aquaticinformatics.com 16
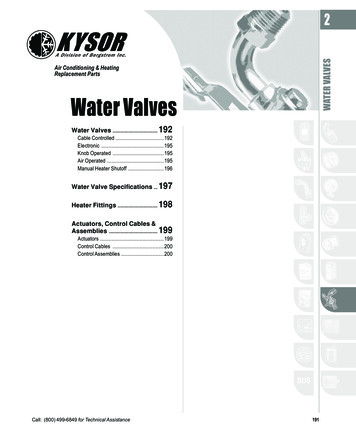
The power of redundancyWe can exploit correlated signals to build more robust models. Even simple linearmethods work well under this regime.Nonlinearly correlatedsignals from same sensorLinearly correlatedsignals from differentsensors
The power of redundancy
The power of redundancy
Handling sensor faultsThe Gaussian distribution is closed under affinetransformationsWe make the assumption that a fault can be represented asan affine transformation of the observationWe can model a variety of faults by modelling theobservations 𝑦 with time input 𝑡 as (Garnett 2009):𝑃 𝑦 𝑡 𝑁(𝑦 𝐴𝜇 𝑡 𝑏 𝑡 , Σ𝑚 Σ𝑛 )Where 𝜇(𝑡) is the model prediction, Σm is measurement noise.𝐴, 𝑏 specify the contribution of the fault, A is a diagonal matrixΣ𝑛 is the noise contribution from the fault
Sensor offsetFor example, a sensor that undergoes a constant offset 𝑐 in a faultyregion 𝐹:𝐴 𝑖𝑡 , 𝑖𝑡 1𝑐 if 𝑡 𝐹𝑏 𝑡 0 elseΣn 0
Stuck sensorA stuck sensor that outputs some constant reading 𝑐 plus noise:0 if 𝑡 𝐹1 else𝑐 if 𝑡 𝐹𝑏 𝑡 0 else2Σ𝑛 𝑖𝑡 , 𝑖𝑡 𝜎 𝑛𝐴 𝑖𝑡 , 𝑖𝑡
Sensor driftDealing with sensor drift ismuch harder!Drifts are often nonlinear dueto sensor designIn univariate signals, it is oftendifficult to even “eyeball”sensor driftsSensors are usuallyrecalibrated every few weeksbefore drift becomes toosevereEither we need to developreally good univariate driftmodels, or utilize sensornetworks
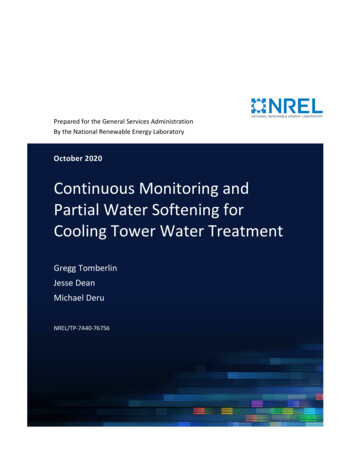
Case study: fishkillerThis is a time-series for a river in British Columbia measuring water level inmetersWater level is determined by a nearby dam upstreamWhen “jitters” occur, salmon get trapped and drownDetecting and preventing these events will save thousands of fish
Dealing with anomalies: the faultbucket (Osborne 2011)Model faults as being a Gaussian with large varianceEach point can be faulty or not faulty2𝑛 ways of classifying every pointWe make several approximations to get the posterior probability of faultiness for acurrent pointThe 2𝑛 1 posterior probability of past faults can be approximated by a single GaussianThe present faultiness is independent of past faultiness
The supervised approach (Turner2011)Supervised extension to Bayesian Online Changepoint Detection(Turner 2010) algorithm.BOCPD trains a predictive distribution using data since the lastchangepoint which is a latent variableThe supervised extension trains the conditional over run lengths directly
Future WorkNeed fast nonlinear regression models for nonstationary data withmultiple correlated outputs and side information that don’t requiremuch hand-tuningConsider supervised approaches for modelling sensor failures andanomaliesHow do we elegantly combine these models into a cohesivesystem?Long term work: lots of problems in e.g. time-seriesclassification/motif detection, optimal control, multitask learning,etc.Really long term work: models to predict spatiotemporal changesfor different decisions, models for automated control systemsWill likely need to combine machine learning models with physicalmodels
For more information:Touraj Farahmand: tourajf@aquaticinformatics.comKevin Swersky: kswersky@cs.toronto.eduNando de Freitas: nando@cs.ubc.cawww.aquaticinformatics.com 28
Thank you!www.aquaticinformatics.com 29
Machine learning can automate, simplify and improve many aspects of water monitoring including: 1) Improving modeling and analysis 2) Detecting and correcting equipment malfunctions 3) Detecting environmenta