Transcription
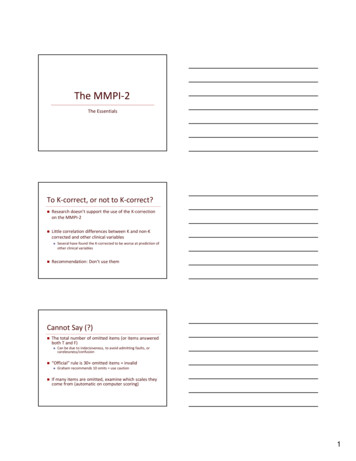
The MMPI-2The EssentialsTo K-correct, or not to K-correct? Research doesn’t support the use of the K-correctionon the MMPI-2 Little correlation differences between K and non-Kcorrected and other clinical variables Several have found the K-corrected to be worse at prediction ofother clinical variablesRecommendation: Don’t use themCannot Say (?) The total number of omitted items (or items answeredboth T and F) “Official” rule is 30 omitted items invalid Can be due to indecisiveness, to avoid admitting faults, orcarelessness/confusionGraham recommends 10 omits use cautionIf many items are omitted, examine which scales theycome from (automatic on computer scoring)1
Variable Response Inconsistency (VRIN) VRIN was developed for MMPI-2 and indicates tendency torespond inconsistently Does so by using 67 pairs of items that ask similar questions,then comparing the answers to those questions Use to help understand high F scale scores High F and high VRIN support random respondingHigh F and normal VRIN suggest either severely disturbed or “fakingbad”True Response Inconsistency (TRIN) Used to identify all true or all false responding patterns Higher scores indicate indiscriminate true responses, lowerindicate indiscriminate false responding Raw scores of 13 (80 T-scores in the direction of true) indicateall true responding Raw scores of 5 or less (80 T-scores in the direction of false)indicate all false respondingInfrequency (F) Developed to detect deviant / atypical waysof responding to test items Used in conjunction with VRIN, TRIN, and Fpto determine whether someone is trulydisturbed, just “faking bad”, or answeringindiscriminately2
Infrequency (F) T 100 (Inpatients); T 90 (Outpatients); T 80 (Non-clinical) Scores this high can show severe psychopathology ininpatientsFp scores can help detect malingering when high Fscores are presentVRIN T-scores 80 to detect random responsesTRIN T-scores 80 to detect all T or F responsesBack Infrquency (Fb) If the F scale is valid, an elevated Fb could indicateinvalid responding on the second half of the test items Can still interpret L, F, and K, but not clinical or content scales T-scores above 110 (clinical) and 90 (non-clinical)should invalidate back half of the test Same interaction between Fb and other validity scalesas with F scaleInfrequency Psychopathology (Fp) 27 items answered infrequently by both normals andinpatients Less indicative of extreme psychopathology than the Fscale Fp 100 and VRIN 80 indicate likely “faking bad”; Fpraw score 7 is optimal for classification3
Lie (L) Constructed to detect deliberate, unsophisticatedattempts at “faking good” ; 15 items dealing withminor flaws or weaknesses that most people wouldadmit to T 80 indicates a lack of honesty and should likelynot be scored When instructed to fake good, this level is seenHigh levels here indicative of artificially lowered clinical andcontent scoresRandom Response Profile A completely random response pattern shows F, Fb, and Fp scales very elevated (100 )K & S scales near 50L scale moderately elevated (60-70)Clinical scales generally elevated, with highs on 8 and64
All-True Responding Answering all True will result in a TRIN score of118 (men) and 120 (women) Extremely elevated F scalesL, K, and S below 50Extreme elevations on right sideScores 80 (in true direction) should beconsidered invalidAll-False Responding Answering all False will result in a TRIN score of114 (men) and 118 (women) Extremely elevated L, F, K, S, and Fp scalesFb and VRIN near 50Extreme elevations on left sideScores 80 (in false direction) should beconsidered invalid5
Negative Self-Presentation Faking bad Very elevated F, Fp, Fb scales (100 )TRIN and VRIN not elevatedClinical scales very elevated, particularly 6, 85, 0 are least elevated6
Negative Self-Presentation F scale has been found to be very effective atdetermining if someone is trying to Fake a specific disorderHas been coachedIs exaggerating symptomsUsually (regardless of d/o), show elevations onF and Fp, as well as clinical scales 6 and 8Positive Self-Presentation Faking good L, K, and S likely to be elevated, with F, Fb, and Fpaverage/below averageSomewhat lower than normal scores on clinical scalesNot as accurate as for overreporting, but stillpretty good7
Positive Self-Presentation Defensiveness Shows similar pattern to faking good, but lesselevated L, K, and S scalesCoaching to fake good If suspected, use less-familiar scales (Wiggins SocialDesirability, etc) to detectInterpretation of Scores In general, scores greater than 65 (1.5 SD above themean) will be considered “high” Scales 5 (Mf) and 0 (Si) should be interpreted in abipolar manner The more extreme the score, the more the clinicaldescription will likely fit the person Descriptors should be considered a starting point, notan end pointScale 1 (Hypochondriasis) Developed to identify patients with excessive somaticcomplaints very homogeneous and unidimensional scale People with actual physical problems and the elderlytend to score slightly higher than normal sample(around 60) High scores are T 80; moderate elevations arebetween 60-79; normal levels are 40-598
Scale 2 (Depression) Designed to assess symptomatic depression; great index of generallife dissatisfaction Extreme scores may indicate clinical depression, but moderatescores indicative of a general negative attitude The elderly, people in hospitals due to illness, and prisoners show5-10 point elevations High scores are 70; moderate are 60-69; normal are 40-59Scale 3 (Hysteria) Developed to ID people with hysterical (physical)reactions to stressful situations Extreme scores (80 ) suggest pathological condition,but chronic pain patients often score in 70-80 range High scores are T 80; moderate elevations arebetween 60-79; normal levels are 40-59Scale 4 (Psychopathic Deviant) Developed to ID psychopathic, asocial, or amoralpersonalities Younger people score higher than older; whites andAsians scored 5-10 points lower than Hispanics, blacks,and Native Americans High scores are T 75; moderate elevations arebetween 60-74; normal levels are 40-599
Scale 5 (Masculinity-Feminity) Developed to ID level of typical thoughts about genderroles High scores reject typical stereotyped gender roles;low scores accept typical gender roles High scores are T 85; moderate elevations arebetween 60-74; normal levels are 40-59; low scoresare 39Scale 6 (Paranoia) Developed to ID people with paranoid thoughts andbehaviors Very few false positives on this measure; most peoplewho score high do show paranoia High scores are T 70; moderate elevations arebetween 60-69; normal levels are 45-59Scale 7 (Psychoasthenia) Measures obsessive and compulsive types ofbehaviors, psychological discomfort and turmoil High scorers often tend to be neat, organized, orderly,and rigid and moralistic High scores are T 75; moderate elevations arebetween 60-74; normal levels are 40-5910
Scale 8 (Schizophrenia) Developed to ID people with schizophrenia College students, African-Americans, NativeAmericans, and Hispanics score about 5 points higherthan normal High scores are T 75; moderate elevations arebetween 60-74; normal levels are 40-59Scale 9 (Hypomania) Developed to ID those with hypomanic symptoms Ethnic minorities show slight elevations, as do youngerpeople High scores suggest other scale elevations will beacted out and expressed overtly High scores are T 80; moderately high are between70-79; moderate are 60-69; normal levels are 40-59Scale 0 (Social Introversion) Assess a person’s tendency to withdraw from socialcontacts and responsibilities High scores are insecure and lack self-confidence; lowscores tend to be sociable and extroverted High scores are T 75; moderate elevations arebetween 60-74; normal levels are 40-5911
Code Types Focus on clinical scales that are above T-score of 65,while all other clinical scales are below 65 Can have one (high point), two, or three point codetypes Exclude scales 5 and 0 when determining code types Same descriptors apply to high-scorers as high-pointcode typesCode Types Two-point tell which two are the highest ones in theprofile; three-point are the three highest scores Scores seen as interchangeable (2-7 vs. 7-2) Well-defined types have a difference of at least fivepoints between lowest code type scale and nexthighest clinical scale Interpret code types when the scales are above a 60 Tscore12
The MMPI-2 To K-correct, or not to K-correct? Research doesn’t support the use of the K-correction on the MMPI-2 Little correlation differences between K and non-K corrected and other clinical variables Several have found the K-corrected to be worse at prediction of other clinical variables Recommendation: Don’t use them Cannot Say (?) The total number of omitted items (or items answered .
