Transcription
Downloaded from http://rsos.royalsocietypublishing.org/ on July 12, 2017rsos.royalsocietypublishing.orgFire ants perpetually rebuildsinking towersSulisay Phonekeo1 , Nathan Mlot1 , Daria Monaenkova2 ,David L. Hu1,3 and Craig Tovey4ResearchCite this article: Phonekeo S, Mlot N,Monaenkova D, Hu DL, Tovey C. 2017 Fire antsperpetually rebuild sinking towers. R. Soc.open sci. 4: ed: 8 May 2017Accepted: 8 June 2017Subject Category:Biology (whole organism)Subject gent, swarm, bivouac, self-assembly1 School of Mechanical Engineering, 2 School of Physics, 3 School of Biology, and4 Industrial and Systems Engineering, Georgia Institute of Technology, Atlanta,GA 30332, USADLH, 0000-0002-0017-7303In the aftermath of a flood, fire ants, Solenopsis invicta,cluster into temporary encampments. The encampments cancontain hundreds of thousands of ants and reach over 30ants high. How do ants build such tall structures withoutbeing crushed? In this combined experimental and theoreticalstudy, we investigate the shape and rate of construction ofant towers around a central support. The towers are bellshaped, consistent with towers of constant strength such asthe Eiffel tower, where each element bears an equal load.However, unlike the Eiffel tower, the ant tower is built througha process of trial and error, whereby failed portions avalancheuntil the final shape emerges. High-speed and novel X-rayvideography reveal that the tower constantly sinks and isrebuilt, reminiscent of large multicellular systems such ashuman skin. We combine the behavioural rules that producerafts on water with measurements of adhesion and attachmentstrength to model the rate of growth of the tower. Themodel correctly predicts that the growth rate decreases asthe support diameter increases. This work may inspire thedesign of synthetic swarms capable of building in verticallayers.Author for correspondence:David Hue-mail: hu@me.gatech.edu1. IntroductionElectronic supplementary material is availableonline at ggregations of animals such as birds, fish and social insectshave attracted much interest because of their ability to accomplishcomplex tasks efficiently without a clearly designated leader,and despite the severely limited information and cognitiveprocessing ability possessed by each individual [1–5]. Termites,for example, build mounds that can reach 8 m in height, morethan 70 000 times their body length [6,7]. The taller the structure,the more torque it experiences from wind and gravity, and themore unstable it becomes. Since termites do not seem able asindividuals to perceive the mound size, it is poorly understood2017 The Authors. Published by the Royal Society under the terms of the Creative CommonsAttribution License http://creativecommons.org/licenses/by/4.0/, which permits unrestricteduse, provided the original author and source are credited.
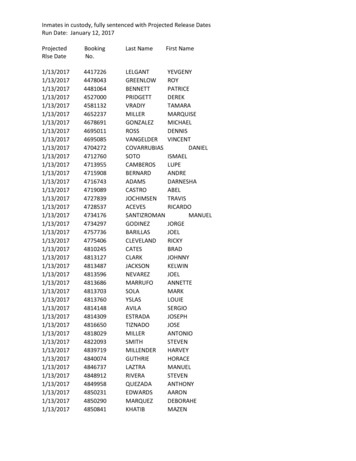
Downloaded from http://rsos.royalsocietypublishing.org/ on July 12, 2017(a)n 12w34h5Figure 1. The shape of an ant tower. (a) A trumpet-shaped ant tower built around emerging vegetation in the Atchafalaya Basin Swampin Louisiana. Photo courtesy of CC Lockwood. (b) Water droplet rolling down an ant tower. (c) Schematic of five layers of an ant towerwith carrying capacity α 2 ants.how they maintain its physical stability as it grows. In addition, the ability to build such tall structureshas no parallel in the world of robotics. While robots numbering in the hundreds have been used to buildhorizontal structures [8], and flying robots have been used to build scaffolding [9], roboticists still cannotbuild structures like skyscrapers using decentralized independent units. In this study, we focus on towerbuilding by fire ants.Fire ants Solenopsis invicta reside in the Patanal wetlands of Brazil. In response to the rainy seasons,they evolved the ability to link their bodies together to build rafts to keep their colonies together. Theyuse sticky pads at the ends of their feet to attach to surfaces [10–12]. These sticky pads also enablethem to link to each other to build a three-dimensional network [13,14], whose material properties aresensitive to applied forces. Tests using rheometers, sensitive devices to measure a material’s resistance todeformation, show that ants are shear-thinning like paint. At applied forces of around 2 ant weights, antsrelease their grip on each other and begin to flow like a fluid [15]. Ants only maintain their grip if theyexperience stresses lower than this threshold. Consistent with these measurements, we have observedthat ants build rafts that are only 2.5 ants tall. Rafts that are originally taller than this height flattenwithin minutes [13,16–18]. This inability to stably support high stresses makes fire ants unlikely towerbuilders.Floating fire ant rafts anchor themselves to vegetation, and in the process, build tower-like structuressuch as the one in figure 1a, photographed in Atchafalaya Swamp, Louisiana. An ant tower such as thisone serves as shelter from rain and water currents. It also serves as a base of operations before ants canbuild the underground tunnels where they will ultimately reside. Little is known about fire ant towerconstruction and shape. More is known about analogous structures, the overnight bivouacs of army ants[19]. Such structures are built in the crevices of tree trunks and other vegetation, and can be over 30 antsdeep.In this study, we investigate tower building by fire ants. We begin in §2 with reporting ourexperimental methods. In §3, we report our theoretical models for predicting tower shape and growthrate. We present our hypotheses and experimental results in §4 and compare our results to theoreticalpredictions. In §5, we discuss how well our predictions support our hypotheses. In §6, we discuss theimplications of our work and avenues for future research.(c)rsos.royalsocietypublishing.org R. Soc. open sci. 4: 170475(b)2
Downloaded from http://rsos.royalsocietypublishing.org/ on July 12, 20172. Experimental methodsWe procure fire ant (S. invicta) colonies from roadsides near Atlanta, GA. Colony selection aims foran average ant weight of 1 mg. We remove colonies from the soil and place them into bins accordingto methods by Chen [20]. Ants are fed baby food and pet food three to four times a week, andwe perform experiments using nine different colonies with regular replenishment of their watersupply.2.2. Tower buildingWe collect 10 g of ants in a beaker and then swirl them to produce a ball of ants. This ball is placedin the centre of a 150 150 15 mm clear acrylic box. To induce them to build a tower, we place acentral support within the box. A Teflon rod is dusted with talc powder and lowered into the centreof the sea of ants filling the box. If the rod is not coated with Teflon, the ants adhere to it so easilythat they climb without support and do not form a tower. We prevent ants from escaping over thesides of the box by coating the box with Fluon and talc powder on the sides. Within a few minutes,ants begin to form a tower centred around the Teflon rod (see the electronic supplementary material,movie S1). We film the process from the side using a high-definition Sony HDR-HC9 video camera.After the tower reaches equilibrium, we return the ants to their bins for at least 2 h before samplingagain from the colony, which generally contains between 20 and 40 g of ants. We use the same colonyat most twice per day. We also run experiments using 15 and 20 g of ants, confirming qualitativelythat greater numbers of ants indeed build similar towers. Room temperature stays between 23 Cand 25 C.To measure the time for an ant to fill a slot on the rod, we closely film the building of towers on rodsof two diameters, 4 and 9.5 mm. We limit our count to slots whose vacancy time can be viewed withoutobstruction by ants. For each diameter, we track 51 empty slots from when they became available until anant fills the slot and remains on top of the ant below it. This requires frame-by-frame observation acrossapproximately 250 min of video. Electronic supplementary material, video S2 shows a typical video fromwhich we collect the data. Ants tend to fill slots from the bottom of the tower upward. The diagram infigure 5a shows that once ants attach to the rod, the slots above them become available. Since videos arefilmed from the side, only 8–10 slots can be viewed at a time, with the rod obscuring the remaining slots.2.3. Ant strength measurementTo measure the amount of weight an ant can carry, we apply weights to it. We place a 0.05 g transparencysheet atop a single ant and gradually increase the number of sheets until the ant does not walk. Sincewe can observe the ants through the transparent sheets, we can easily tell when the ants stop walking inany direction. After we record the weight at which walking ceases, we increase the weight further untilthe ant does not move any of its limbs. After we record this second weight, we remove the sheets andobserve the ant for visual signs of injury, and we observe the ant’s movements for changes in behaviour.Ants have two types of connections in the tower, an ant–ant connection, and an ant–Teflon connection.We measure the strength of an ant’s leg-to-leg connection by tying two ants, of the same colony, each toan elastic string. We place the two ants in contact to stimulate a leg-to-leg connection. Once the antsgrip each other’s legs, we pull the elastic string, which causes it to stretch. We then use Hooke’s Law tomeasure the force.We measure the force with which an ant grips Teflon by placing Teflon rods of diameters 4.7 mm (N 9), 12.8 mm (N 10) and 14.5 mm (N 6) on a Metler Toledo analytical balance. We place one tetheredant on the Teflon rod and slowly pull the ant upwards until it releases its hold. We record the wholeprocess using a Sony HDR-HC9 video camera and use Tracker to find the maximum amount by whichthe measured weight decreases.2.1. Ant husbandryrsos.royalsocietypublishing.org R. Soc. open sci. 4: 170475In §2.1, we present our experimental methods for caring for ants, inducing them to build towers in thelaboratory and measuring their material properties. In §2.2, we present models for tower shape andbuilding rate.3
Downloaded from http://rsos.royalsocietypublishing.org/ on July 12, 20172.4. X-rays of towers4Here, we present models of the shape of the tower and its rate of growth. In our past work on raftconstruction, we found ants followed three rules, which yielded accurate predictions for raft growth rate[17,18]. These rules are as follows:1.2.3.4.Do not move if ants are on top of you.If atop other ants, repeatedly move a short distance in a random direction.Upon reaching available space adjacent to non-moving ants, stop and link with them.The top layer of the tower is not stable unless there is a complete innermost ring of ants grippingeach other around the rod.We include the fourth rule based on our observations, which we report in the Results section. Weassume these rules hold true for the following two models.3.1. Tower shapeTo model the shape of the ant tower, we idealize the tower as consisting of horizontal layers of ants, asshown in figure 1c. In reality, the layers are not perfectly defined. Ants that are horizontally adjacent arenot necessarily at exactly the same height. However, they maintain their relative positions once they areconnected and do not interpenetrate each other. Designate layer 1 as the top layer, and layer n 1 asbeing immediately below layer n. Suppose one ant has a carrying capacity of α ants. Ants are known tobe strong, so α will be larger than 1. Let Xn be the number of ants in layer n. The ants in layer n 1 mustbe able to support the ants in layers 1 through n. Therefore,αXn 1 n Xi .(3.1)i 1At maximum load, the above equation will hold with equality. Hence at maximum load, it is a goodapproximation to writeαXn 1 n i 1Xi Xn n 1 Xi Xn αXn Xn (α 1).(3.2)i 1According to the above equation, the number of ants in a layer grows as a geometric sequence with ratio1 1/α. However, if the ants in the second layer supported the top layer at maximum load, X2 X1 .That is, there would be fewer ants in layer 2 than in layer 1. Instead, we observe that layers 2 and 3 arethe same size as layer 1. We therefore refine our formula as follows by setting the top few layers to be thesame size.3. Mathematical modellingrsos.royalsocietypublishing.org R. Soc. open sci. 4: 170475To observe ant movement within the tower, we dope 5 g of fire ants with a radiographic contrast medium(GE Omnipaque Ioxehol solution) by mixing it with their drinking water and allowing the ants to drinkfor at least 2 days before building a tower. Immediately before tower building begins, we mix 5 g (5000ants) of doped ants thoroughly with 5 g (5000 ants) of undoped ants from the same colony. In total, we usethe same number of ants as our other experiments. We place the ants in a 100 mm diameter 55 mm tallcontainer with an 8 mm diameter Teflon rod located in the centre of the dish. We allow the ants to build atower with the process captured using an imaging system that includes the following: Spelman XRB502Monoblock X-Ray source and Amorphous Silicon Digital X-Ray Detector PaxScan 2020 (Varian MedicalSystems). We operate the X-ray at a current of 2.5 mA and a voltage of 100 keV. In the resulting images,ants that have ingested a lot of the contrast medium show as dark spots for which we use ‘Tracker’, afree product of Open Source Physics. This program allows us to trace individual paths (dark spots) ofants frame-by-frame throughout the sinking process. Approximately 2% of the doped ants ingest enoughradioactive iodine to be visible. Owing to the limited aperture of the X-ray machine, only a fraction ofthose ants show up in the images. The doped ants sometimes get in each other’s way or disappear fromview of the X-ray. Therefore, we only tracked ants that we could observe for at least 10 continuous frames.If an ant were stationary, it would show up as a stationary dark spot. We measure the sinking speed fromdata points taken at different heights and different distances from the rod.
Downloaded from http://rsos.royalsocietypublishing.org/ on July 12, 2017Let β X1 be the number of ants in the top layer.1 β 1 α n αif 1 n αif n α.(3.3)The hypothesis for this model, equation (3.1), requires that there be enough horizontal area beneathyet close to layer n for Xn 1 ants to fit. As the slope approaches the horizontal, this requirement becomesimpossible to satisfy. Instead, the tower would have to be buttressed by additional ants. We did notobserve such a phenomenon, nor did we expect to do so since a simple estimate indicates that a muchlarger number of ants would be needed to evoke it.3.2. Tower growth rateThe inset in figure 5a depicts the discretization of the top of the tower into a ring of spaces. Given Rule 2,the time to fill an empty space on a ring should be independent of the fill time of other spaces, and havea memoryless distribution. That is, if after t seconds a space has not been filled, its remaining expectedtime to fill is the same as it was at zero seconds. In terms of the random variable Y equal to the time tofill a space, E[Y Y t] E[Y] for all t 0. The exponential distribution [21] is the unique memorylesscontinuous distribution on the non-negative real numbers, with cumulative distribution function (CDF)P(Y t) 1 e t/λ ,where t 0,(3.4)and λ is the mean time to fill an empty slot. Defining w to be the width of an average ant, let S π D/wbe the total number of spaces around a rod with diameter D. When S spaces are empty, the time Z untilS 1 spaces are empty isZ min (Yj ),1 j S(3.5)where the Yj are jointly independent exponentially distributed variables, each with mean λ. Therefore,the time Z to fill the first space is distributed so that P(Z t) P Sj Y j t S P(Yj t) (e t/λ )S e t/(λ/S) .(3.6)j 1Hence, Z has exponential distribution with mean λ/S. Once one space is filled, by the memorylessproperty, the remaining time until all the spaces are filled is the same as if we start with S 1 emptyspaces, which is equal to λ/(S 1), plus the time as if we start with S 2 empty spaces. Inductively, theexpected time T to fill all S empty spaces isT S j 1 1 11λ λ 1 ··· λ log S.S j 12 3S(3.7)3.3. Mathematical estimate of the tower’s surface areaWe derive an estimate for the ratio of the number of ants on the tower surface to the number of ants thatwould have to be added to the tower to make it one ant-height higher. The estimate is needed to explainwhy ring formation limits the tower height growth rate, despite the exponentially large number of antsin the tower as a function of height.Since the ant orientations vary greatly, we treat individual ants as balls or cubes of unit radius. Allmeasurements are in terms of these units. Let N be the height of the tower, r radius of the rod, f (n) annular radius of level n of the tower, where N, r and f all have units in numbers of ants. For conveniencedefine ζ 1 1/α.No explanation is needed for the first several tower layers, where the size of the ring is comparable tothe number of ants needed for an additional layer. Therefore, we assume that the number of ants in thebottom tower layer greatly exceeds the ring circumference, that is, ζ N 2π r. The constant β factors outof the computations, so without loss of generality, we set β 1. 5rsos.royalsocietypublishing.org R. Soc. open sci. 4: 170475Xn β
Downloaded from http://rsos.royalsocietypublishing.org/ on July 12, 2017We first estimate f (n). According to the shape model, and by Taylor series expansion on r,6ζ n π ((f (n))2 r2 )Then,r2 1 nζ π 1 nr2ζ .π2 1/π ζ n df (n) log ζ n/2 r2 π log ζ ζ .dn2 π4ζ n/2Consider a horizontal slice of the tower with thickness dn. To first order, its exposed surface area is dS 2π (f (n) r) dn2 df 2 21 n/2r πdf 2π ζ r 1 n/21 dndnπ2ζ 2 df1 n/2 r1 dn 2π ζdnπ 1log ζ n/2 2π ζ n/2 rdn ζπ2 π r ζ n log ζ 1 n/2 π dnζ ζ n log ζ dn,where the second approximation is accurate except for small values of n, which contribute little to thetotal surface area of the tower, and the third and fourth approximations use ζ N 2π r 1. The totalsurface area of the tower is therefore estimated as Nζ n dn ζ N .S log ζ1ζ N αFor the estimated value α 3, there are ζ N /ζ 3 ants in the bottom layer. The estimated ratio ofants on the tower surface to the number of ants that would have to be added to make it one ant-heighthigher is thereforeζ 3 (1 13 )3 2.4.4. Results4.1. Tower shapeWhen we house ants in the laboratory, we observe towers naturally built in the ant’s containment bins,as shown in figure 2a–d. Ants apparently prefer to build along vertical supports such as walls, rodsor upturned tubes that provide water. Sometimes, the towers are bell shaped, but results are variablebecause of the differing wall friction on each of the vertical supports. To reduce the influence of wallfriction, we design experiments where fire ants build towers on slippery rods. To challenge the ants, weuse rods varying from 4.7 to 16.0 mm.We film ants building 26 towers with heights ranging from 7 to 30 mm and an average height of15.8 5.3 mm. Ants complete their tower building in 25 8 min. The towers are much wider at thebottom than at the top. Moreover, the tower slope is not constant as in a cone. Rather, the slope becomesmore horizontal towards the bottom. We observe another benefit of tower building: the tower repelswater droplets falling at velocities at least up to 3 m s 1 , the maximum we can attain in the laboratory,equal to one-third of a natural raindrop’s velocity [22]. Rather than penetrating the tower, the drop simplyrolls down its surface, as shown in figure 1b.Our preliminary observation is purely qualitative, that the towers greatly widen from top to bottom.Why are the towers not of constant width, as are most skyscrapers? An ant at the base of such a tower 30ants high would bear the weight of 29 other ants. It is plausible that an ant could not sustain such a load.We hypothesize that for some α, ants will not bear loads that exceed the weight of α ants. We observe thatants constantly clamber over one another. An ant with one ant atop it initially ends up with more ants. f (n) rsos.royalsocietypublishing.org R. Soc. open sci. 4: 170475and
Downloaded from http://rsos.royalsocietypublishing.org/ on July 12, 2017(c)(d)(e)(f)Figure 2. Spontaneous tower building in the laboratory. (a) Fire ants build towers around water sources. (b) Close-up of the ants withinthe tower. In both images, a vertical test tube dispenses water into a Petri dish. Fire ants also build towers for escaping a container. (c) Fireants building a tower on a rectangular block of wood coated with Fluon, liquid Teflon, to render it difficult to climb. (d) An ant tower builtfrom within a beaker permits ants to escape the beaker. (e) A pile of dead ants has a conical shape. The slope is constant at an angle ofrepose approximately 36 from horizontal. (f ) By contrast, the ant tower shows a bell shape.atop. On the basis of this observation, we further hypothesize that the preponderance of ants will eachbear that maximum weight. Ants at the top few layers of a tower obviously cannot bear the maximum.This hypothesis is analogous to the ‘Towers of constant strength’ proposed by Timoshenko in 1930 [23]and used decades earlier in the design of the Eiffel tower. We employed this hypothesis to predict thetower shape, which is bell shaped, as given in equation (3.3).The hypothesized shape model makes several testable predictions. First, for a fixed number of ants,the shape should be the same in repeated trials. Second, for any k, the top k mm of the tower shouldhave the same shape, regardless of the total number of ants. This is because an individual behaviour ofbearing a load of α ants should not be affected by the population size. That is, an ant k mm from thetop should not behave differently when above 4 or 14 additional mm of ants. Third, there should exist7.(b)rsos.royalsocietypublishing.org R. Soc. open sci. 4: 170475(a)
Downloaded from http://rsos.royalsocietypublishing.org/ on July 12, 2017(a)82224446layer n0layer nlayer n068688101001000.500no. ants ( 103)0.501.00no. ants ( 103)0.501.00no. ants ( 103)time10 min20 min30 min(c)002224446610101000.501.00no. ants ( 103)4.7 mm6888roddiameterlayer n0layer nlayer n(d)00.50no. ants ( 103)9.5 mm1.0000.5 1.0 1.5 2.0no. ants ( 103)16.0 mmFigure 3. Ant tower profile. (a) A time sequence of an ant tower built on an 8 mm diameter Teflon rod. (b) The fit of the shape modelto the profile of a 10 min, 20 min and equilibrium ant tower. (c) The equilibrium shape of ant towers built on 4.7, 9.5 and 16.0 mm roddiameters. (d) The fit of the shape model to the profile of the equilibrium ant towers on increasing rod diameters. The circles representthe profiles of the towers. We fit these profiles to the shape model, shown by the solid lines, using carrying capacity α 3.0.an α 1 such that, for multiple trials with different numbers of ants, the tower shape is consistent withthe shape formula given. The principal experiment consists of repeated trials with different numbers ofants and rod diameters. For each trial, we measure the tower width at each level from top to bottom. Wecheck for regularity in shape and determine the best single value of α that fits all of the data.In our analysis, we disregard towers less than three layers in height. We were left with 23 videos of anttowers built on rods with diameters ranging from 4 to 16 mm. Figure 3a shows the 10 min, 20 min andequilibrium shapes of the towers built around an 8 mm diameter rod. In figure 3b, the circles indicatethe profile of the ant towers and the line is the model, equation (3.3). The fit is good, as shown by theR2 -values of 0.74, 0.85 and 0.88, respectively (N 3). In the model, there are two parameters used. One is.0rsos.royalsocietypublishing.org R. Soc. open sci. 4: 170475(b)
Downloaded from http://rsos.royalsocietypublishing.org/ on July 12, 2017(a)9height: 25.4 mm(b)height: 8.6 mmheight: 15.7 mmheight: 20.8 mm(c)height: 14.9 mmheight: 21.5 mmheight: 23.6 mmFigure 4. Shape of the top of the tower. We observe qualitatively that the top of the fire ant tower has a fairly consistent shapethroughout; the top of the towers built around (a) 8, (b) 9.5 and (c) 11.2 mm diameter rods looks similar regardless of the height ofthe tower. Qualitatively, we show the close-up view of three trials at varying heights. This shows that the shape at the top of the tower isnot affected by the height of the tower.the number β for number of ants in the top layer. The second is the ant strength α. The location of the toplayer was visually ambiguous so we used the clearer β value of the first two layers for each ant tower.We applied this method to all the ant towers to find the best single fit of α 3.0 ants. The value α 3.0is strikingly consistent with the value of 2 ant body weights found in the rheometer tests [15] describedin the Introduction. The shape model with this α-value was accurate with R2 0.78 (N 23). Figure 3cshows the towers built on increasing central rod diameters and figure 3d compares the tower profileswith the theoretical predictions. We conclude that the model accurately predicts the overall shape of thetower for a range of rod diameters.The procedure for choosing β is needed because of the variability in the first few layers in terms ofnumber of ants per layer. Figure 4 shows the variability of the top of the towers for the same diameter atthree different times. Our model could not predict this number because these ants were not supportingtheir maximum load. As a consequence, the fits of the model to the ant towers were not as good at thetop of the towers when compared with the bottom.To determine the biological significance of the ant strength α, we performed the compression test onthree different ants with an average weight of 1.1 0.15 mg. A weight of 88 13 mg, or about 83 12times body weight, prevented the ant from walking. A weight greater than 0.8 g, or about 750 times bodyweight, prevented ants from moving any limbs at all but did not kill or appear to injure them after weremoved the transparency sheets from the ants. These values of 83 and 750, compared with the valueα 3.0 experienced by ants in towers, are strong evidence that ants stay still within their towers out oftheir own volition, and not because of their physical limitations.It is noteworthy that the bell shape is only indicative of live ants. Non-living granular materials suchas dead ants will form conical structures with a constant angle of repose, as shown in figure 2e. We firsteuthanize ants with liquid nitrogen and then pour them through a funnel into a Petri dish. The angle ofrepose, the slope of the pile relative to the horizontal, was 36 , very similar to the known conical shapewith constant 34 angle of repose for sand piles [24]. In comparison, the tower of live ants has a rapidlydecreasing slope relative to the horizontal, traversing downwards, seen in figure 2f. We conclude thatants are physically exerting themselves when in the tower rather than merely piling on top of each other.4.2. Tower growth rateFigure 5b shows the time course of the height of the tower. Tower construction is completed at 20 min,when the tower increases to a height of 15 mm, or 5 ant body heights. Roughly, this gives an average rateof growth of the tower of a new layer of ants every 4 min. What sets this rate of growth?.height: 19.5 mmrsos.royalsocietypublishing.org R. Soc. open sci. 4: 170475height: 13.0 mm
Downloaded from http://rsos.royalsocietypublishing.org/ on July 12, 2017(b)Dk S01020time (min)3040(c)P (Y t)1.00.80.60.40.20050100150T (s)(d)5004003002001000200250300Y (s)0510152025D (mm)Figure 5. Building rate of ant towers. (a) A side view of an ant tower. The inset shows a ring of spaces from k 1 to k S around a rod ofdiameter D that ants can fill. (b) Time sequence of tower height (N 3, rod diameter 9 mm). The red dashed line is the average growthrate. (c) The solid circles shows empirical cumulative distribution function (CDF) of the time Y to fill a slot, found from video tracking. Thesolid line is the CDF from the predicted exponential distribution. (d) Relationship between ring filling time and rod diameter. The circlesrepresent the experimental time to complete a ring (N 3 for each diameter for which an error bar is shown). The line is the predictedtime to fill a ring.We divide the circumference into vertical ‘slots’ because ants tend to attach around the rod vertically,as shown in inset in figure 5a. The number of slots S π D/w where D is the rod diameter and w isthe ant width of 1 mm. For an 8 mm diameter rod, there are approximately 25 slots available per level.Given that the individual ant movements are random, the time to fill an empty space on a ring shouldbe independent of the fill time of other spaces, and have a memoryless distribution. That is, if aftert seconds a space has not been filled, its remaining expected time to fill is the same as it was at zeroseconds. In terms of the random variable Y equal to the time to fill a space, the probability that Y is lessthan some ti
the Eiffel tower, where each element bears an equal load. However, unlike the Eiffel tower, the ant tower is built through a process of trial and error, whereby failed portions avalanche until the final shape emer