Transcription
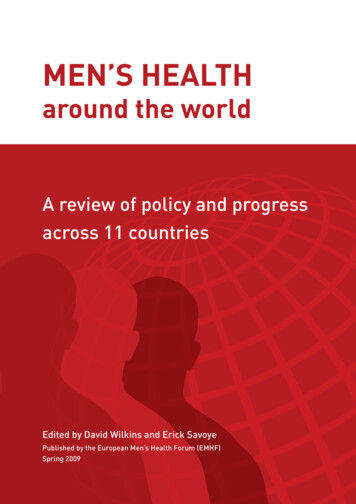
Men eat on Mars, Women on Venus?An Empirical Study of Food-ImagesClaudia WagnerLuca Maria AielloGESIS & Univ. of KoblenzYahoo STRACTFood is central to all human beings and in modern societyit is also used to sustain identity. In this work we presenta quantitative approach for exploring gender-differences inthe context of food using a large set of user-generated foodpictures from Flickr and discuss factors that may potentiallyexplain those differences. Our results indeed show that forcertain types of food clear gender-specific differences exist.However, we find that only certain parts of them can be explained by gender-specific differences in the food consumption behavior, while other parts can be better explained bythe media portrayal of food consumption.1.INTRODUCTIONCulinary preferences contribute significantly to the senseof ourself [13]. For example, the vegan and the gourmetmake statements about themselves through their culinarypractice. While gender, race, sexuality and ethnicity describe our “major identity”, preferences in music, style andfood define our “minor identity”. By sharing content onsocial media, users actively create online identity and promote their public self-images. While scholars have exploredhow identity and language are manifested in online interactions [2, 3, 6, 7, 19], it remains unclear to what extentmajor identity such as gender manifests on image sharingplatforms.In this work we investigate to what extent food picturesuploaded by users reflect one specific part of their majoridentities, namely their gender, and which factors may explain why they do or do not do so. We focus on food picturessince (1) the sharing of food pictures is a huge trend nowadays1 and (2) food is often used to mark membership of agroup and create identify [4].This work sets out to investigate gender which is partof our major identity and how it effects the way we define1http://www.bu.edu/bhr/files/2014/05/BHR v22-greenfield.pdfPermission to make digital or hard copies of all or part of this work forpersonal or classroom use is granted without fee provided that copies arenot made or distributed for profit or commercial advantage and that copiesbear this notice and the full citation on the first page. To copy otherwise, torepublish, to post on servers or to redistribute to lists, requires prior specificpermission and/or a fee.Copyright 20XX ACM X-XXXXX-XX-X/XX/XX . 15.00.Figure 1: Top web image search results for the queries a)“eating meat” and b) “eating sweets”. Gender stereotypesclearly emerge.our minor identity online by exploring a large set of usergenerated geo-tagged food pictures. Concretely, we tacklethe following research questions: Do gender-specific differences exist in the type of foodmen and women upload? How stable are those differences over time? What are the factors driving gender-specific differencesin the food picture uploading behavior?To address the second research question we explore twopotential explanations: food consumption and gender portrayals of food consumption in the media (e.g. for advertisements). Cultivation theory predicts that media’s portrayalof the world affects people’s beliefs about reality and consequently may impact their behavior [21, 18]. Therefore,food-specific gender roles that are propagated in the media(see e.g. Figure 1) may impact both, the self-image peoplewant to promote and what they actually consume. Further,what people consume might also explain to some extent thetype of public self-image they create and/or might impactthe development of targeted campaigns in the media whichare informed by consumer marketing. This indicates thatthe two explanations which we investigate are most likelynot independent. In this work we do not aim to disentanglethese explanations, but present preliminary results on thecomparison of them and discuss to what extent they explainwhat we observe in the photo upload behaviour.2.FOOD IMAGE UPLOAD BEHAVIORIn the following we explore gender-specific differences inthe type of food men and women upload.2.1Data Collection
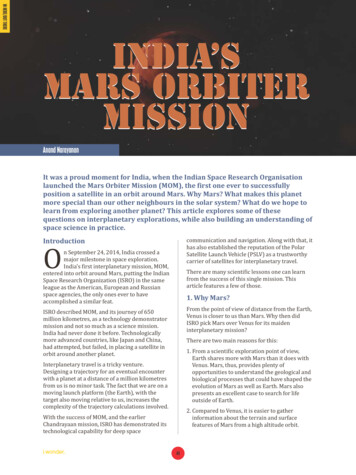
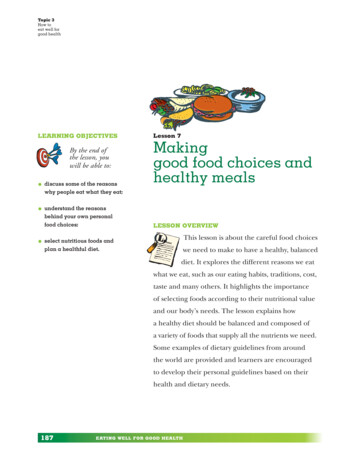
Figure 2: Distribution of interest over food categories.To be able to differentiate different types of food anddrinks, we used a list of basic food vocabulary that is usedfor teaching English2 as a starting point. This list contains important food words which can be grouped into ninemacro-categories: meat, fish, fruit&vegetables (“vegetables”for brevity), milk&diaries (“milk” for brevity), sweets, ethnicfood (e.g., “indian food”), fast food (e.g., “cheeseburger”), alcoholic drinks, coffee&tea. In the following we will refer tothese categories and, from time to time to some of theirsubcategories (e.g., decomposition of alcoholic drinks intobeer, wine, and booze). We make the full list of words foreach category publicly available3 . We then collected a random sample of nearly 15M Flickr images taken by around1M users between 2005 and 2014 labeled with at least onetag in our list and whose uploaders specified their genderin their public profile. All data have been anonymized andprocessed in aggregate. 41% of the users in our sample arefemale. The users in our sample are quite active in terms ofnumber of uploads; the mean number of pictures per user is200, the average over 1000.2.2Food PopularitySince we aim to identify gender-specific differences in thepopularity among different food categories, we first comparehow the interest of women (or men) in food is distributedacross our food categories. We use the number of women (ormen) who uploaded at least one picture that corresponds tothe food category as a proxy for the male (or female) interestin that food category. Using the number of pictures wouldcertainly be an alternative; however, this method would bevery prone to super-users (e.g. professional photographers),who upload much more pictures than most users. Figure 2shows that the distribution of interest over food categorieslooks pretty similar for men and women at the first glance.However, interesting differences become visible when comparing the ratio between the proportion of men and womenthat uploaded pictures of the same food category (cf. Figure 3). For example, 24% of all men uploaded at least onepicture of beer at some point, while 17% of women did thesame. This leads to a men-women ratio of 1.41 which meansthat beer is 41% more popular among male users than female users. Figure 3 shows that the most “male food ordrink” is beer, followed by booze, fast food and meat, whilethe most “female food or drink” are sweets, milk, coffee, vegetables/salad and tionary.xlsx?dl 03Figure 3: Ratio between the proportion of men and womenwho uploaded at least one picture that corresponds to thattype of food (normalization with total number of users).(a) Men(b) WomenFigure 4: The most frequently used tags of men and womenin our dataset.Figure 4 shows the tags which are most frequently usedby men and women. Again one can see that e.g. sweets aremore popular among female users. To further explore whichtags are most indicative for men and women we train a NaiveBayes classifier. We use the classifier to determine whichterms are most effective for distinguishing the gender of theuser who uploaded and tagged the picture. Using likelihoodratios for comparing different feature-outcome relationships,we find that the most discriminative food-related tags arethe following: “cupcakes take the cake” (female:male ratio 7.9 : 1.0), “buttercream” (female:male ratio 7.7 : 1.0),“cupcackes” (female:male ratio 4.8 : 1.0), “baked goods”(female:male ratio 4.8 : 1.0) and “muffins” (female:maleratio 4.2 : 1.0). This confirms our intuition that especiallysweets are more likely to be uploaded by women and aretherefore indicative for women.2.3Temporal Trends in Gender DifferencesSelf selection bias prevents us from making statistical inference for single points in time. In addition, potentialchanges in the composition of the population of the onlinecommunity over time prevent us from using time series tomake statistical inference about changes over time. However, if changes in the composition of the online communitymembers are consistent across genders, then the comparisonof relative changes for men and women can be used to provide information about trends (e.g., does the popularity ofmeat increase more for men than for women?)Figure 5 shows two examples of how gender-specific foodtrends change over time4 . One can see that the popularity of4Note for all other food categories the proportions remain
(a) Fuits&Vegetables Users(b) Alcohol Users(c) Fuits&Vegetables Photos(d) Alcohol PhotosFigure 5: Relative volume of users (top) and photos (bottom) for vegetables and alcohol.vegetables is increasing for men and women (i.e., more maleand female users upload more pictures about vegetables),but for women the increase is slightly stronger, indicatingthat vegetables will stay a rather female food category. Despite that, the difference between men and women in therelative volume of photos depicting vegetables has diminished during the years.Further, we can see that the number of users who uploadpictures of alcohol, which is more popular among men according to our aggregated analysis, is decreasing for bothgenders. However, the number of pictures about alcohol inthe female population is increasing, while it is decreasingin the male population. This indicates that the male population of alcohol drinkers seems to lose interest in postingalcohol pictures over time, while the female population gainsinterest in it. A more fine-grained analysis of different typesof alcohol (beer, wine and booze) showed that beer is going down for both genders (which was also reported in a recent Gallup survey [9]), while wine and booze becomes morepopular among the female population that uploads alcoholpictures.3.EXPLAINING GENDER-DIFFERENCESNext, we discuss two plausible explanations for the genderdifferences in the food image uploading behavior of men andwomen: differences in the food consumption and media portrayals of food and gender.3.1Food ConsumptionThe Economic Research Service (ERS) of the US Department of Agriculture has combined 1999-2000 and 2001-2002data from the National Health and Nutrition ExaminationSurvey (NHANES) to report commodity consumption byhousehold income, age and gender, body weight status, raceand ethnicity, and education attainment as well as by therelatively stable over timelocation where foods were eaten [15]. They collect this datafrom a representative sample of the US population and report the relative consumption patterns of men and womenfor major food categories (grain, fruits, vegetables, fats andoils, eggs, milk and dairies, meat). Not surprisingly menhave a higher retail weight for most types of food, but forsome types of food like meat the difference is much higherthan for all other types of food. One can see, for example,that the difference between men and women is most pronounced in the amount of meat they consume. For meat(pork and beef) the retail weight per person and per yearis 75% higher for men than for women. Previous researchalso found that the male-meat and women-vegetable link isvery well established amongst groups as diverse as AmazonIndians [11] and Western urbanism [14]. While in modernNorth American society, many men do not consider a mealto be “real” unless it contains meat [17], females expressmore disgust and negative attitudes toward eating meat thanmales [12]. Also the food image upload behavior indicatesthat meat is indeed more popular among men.For fruits women have a higher retail weight per year (forcitrus fruits 7%, for stone fruits 8% and for tropical fruit9%). However, several exceptions exist such as Banana (menconsume 16% more) or apples (men consume 11% more).For vegetable we observe a similar picture: overall the retailweight of vegetables for man per year is 22% higher thanfor woman. However, some vegetables such as Cauliflower,Broccoli, Carrots and string beans are more consumed bywomen. Also for salad the retail weight of woman per yearis higher than it is for man (15% higher for cucumbers, 12%higher for Leafy Vegetables, 6% higher for lettuce).The most female food in our image sample are sweets.While our consumption data do not contain sweets, previousstudies about sweets consumptions suggest that in the USsweets are indeed more popular among women. Zellner etal. [22] report that 50% of American women craved chocolate, while only 20% of men reported doing so. However,the same study found that in Spain, men and women cravedchocolate equally (about 25%), while in Egypt, neither sexcraved chocolate, with both sexes showing a high preferencefor salty foods. This suggests that cultural factors may playa role as well.Though the image uploading behavior of users suggestthat diary products are more popular among women, theconsumption data shows men consume 25% more diary products than women, exceptions are skim milk (4% increase forwomen) and yogurt (18% increase for women) which aremore heavily consumed by women. Further, while the foodconsumption data suggest that the fish consumption is 29%higher among men, photo uploads suggests that fish is morepopular among women.These examples show that food consumption data mayexplain to a certain extent what type of food image are predominantly uploaded by men (or women). However, consumption data can certainly not explain everything. Oneneeds to note that gender-specific food popularity is only onefactor that determines what men and women consume (e.g.,availability, costs, culture or health are examples of otherfactors). Further, popularity and preferences are clearly alsoimpacted by the media who create desire and promote gender roles.3.2Media Portrayals
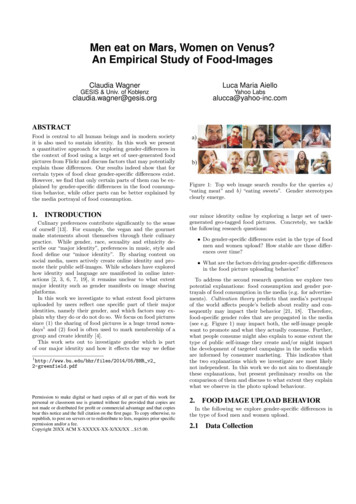
Figure 6: Example of one picture that was shown to thecrowd worker and the questions that they had to answer.In the following we set out to investigate the media portrayal of gender-roles in the consumption of food. To determine which food is mainly shown to be consumed by men orwomen in the media, we search for images on a web searchengine using phrases like “eating X” or “drinking X”. For example, figure 1 shows the top results for “eating meat” or“eating sweets”. One can clearly see that according to themedia sweets are more likely to be consumed by women,while meat is more likely to be consumed by men.3.2.1Data CollectionUsing a web search engine, we downloaded the top 100 images for the consumption of different food items (e.g. “eatingmeat”, “eating sweets”). For each image, crowd workers wereasked to describe who is consuming X on the picture? Thebrief task description was “Look at an image and choose thebest categories for an image that describe who is eating (oris likely to eat) the meat.” Figure 6 shows an example of howthe task looked like. We paid workers 5 cent for labeling 5pictures. Workers were pretty satisfied with the task. Wegot an average rating of 4.3 (on a scale from 1 to 5, where 5indicates the highest satisfaction).3.2.2ResultsFigure 7 shows the proportion of men and women that areshown to consume certain types of food in the top 100 imageresults returned from web search for the queries “eating X”or “drinking X”. We excluded kids (i.e., people which seemto be younger than 13) in this figure. However, our resultsdid not change much when including kids. One can see fromfigure 7 that according to the media meat and beer are malefood (beer is even more male than meat). This is in linewith our results from the image uploading behavior of menand women.Fastfood and milk are pretty gender-neutral, while tea,fruits, salad, sweets, coffee, vegetables, seafood, sushi andcake are more associated with women according to the media.5 The most female foods in the photo sample we considerare sweets, milk, coffee, fruits&vegetables and fish. All ofthem are also according to the media more female.The major difference between the gender-specific foodimage uploading behavior and the media portrayal of foodand drinks is that alcohol seems to be more popular amongmen according to our aggregated analysis however, is alsofrequently promoted with women. Partially this is becauseimages of women drinking alcohol in the mass media (tv,advertisements) are sometimes sexualized and specifically5The results for “eating fish” were almost identical to “eatingseafood” and are therefore omitted to save space.Figure 7: Proportion of men and women that are shown toconsume certain type of food in the top 100 image resultsreturned from web image search (out of those pictures whichactually depict a person eating something). We excludedkids (i.e., people which seem to be younger than 13).targeted to male consumers. However, our temporal analysis on the photo upload trends also shows that the interestin alcohol is increasing among the female users while it isdecreasing among the male population. Maybe the mediaindustry is already aware of this trend.4.RELATED WORKPrevious research in computational social science startedexploring the potential of user generated content (e.g., tweets [1]or foursquare checkins [16]) and other digital traces (e.g.,sever logs [20]) for learning about the users’ food preferences [20], cultural differences in eating and drinking habits [16]and their food consumption and related health consequenceslike obesity [1]. Our work differs from previous research sincewe are interested in exploring the role of user-generated foodimages for creating identity and different factors that mayimpact this process.Online Identity. Traditionally, identity has been approachedin terms of the relationships between the internal experience, such as personality and self-definition, and the externalworld, such as social relationships and shared values [5, 10].The Internet has provided a new context for identity exploration and scholars have especially focused on how identityand language are manifested in online interactions [2, 3, 6,7]. For example, Huffaker and Calvert [8] explore onlineidentity and language use among male and female teenagerswho maintained weblogs and conclude that teenagers staycloser to reality in their online expressions of self than haspreviously been suggested. To our best knowledge, this isone of the first work that explores how online identity manifests in online image sharing platforms. We focus on onespecific type of images, namely food images, since food iscentral to all human beings and in modern society it is alsoused to sustain identity and differentiate social groups [4].Gender-Specific Food Preferences. Previous researchon food preferences mainly relied on surveys (people wereasked what they like), observational studies (researchers observed what people choose) and lab experiments (researchersgave people similar things to eat, only changed one variablesuch as the amount of sugar added and asked them whichmeal they liked best). These methods are powerful but expensive and time consuming. These limitations, togetherwith the fact that many factors (e.g., culture, socio-economicfactors, geographic factors) might play a role in food preferences, explains why the findings in this area are partly
controversial. We believe that our approach can help to formulate new hypothesis about the impact of different factorson the people’s food preferences and allows to quickly testif certain types of food or drinks are rather male, neutral orfemale within a given context.[3][4]5.DISCUSSION & CONCLUSIONThe idea behind this research is that users create andpromote their identity online by sharing content (e.g., pictures, videos or text) that exposes user’s preferences in style,food or music. We presented a simple quantitative study ofgender-differences in the creation of online identities in thecontext of food.Since (i) the Flickr user population is constantly changingand (ii) we only analyze Flickr users who upload pictureslabeled with a certain set of food-related tags, our sample isnot representative of the whole population of Flickr users,neither of its sub-communities that are passionate aboutfood pictures (and, of course, also not for the populationof any country). Nevertheless, we believe that our samplemight give a good indication on the gender differences in uploading food pictures online. The self-selection bias preventsus from making statistical inference for the whole group ofusers. However, there is no reason to believe that this biasis not consistent across genders and therefore the relativecomparison of these two gender groups may still reveal interesting information.Our results highlight interesting differences in which typeof food men and women upload and show that only certain parts of them can be explained by differences in thefood consumption. This is not surprising since popularity or preferences are only one factor that determines whatwe consume (e.g., availability, costs or health are examplesof other factors). Further, popularity and preferences areclearly also impacted by the media who actively manipulate us. Our empirical analysis shows that certain parts ofgender-specific food preferences which we observe in photouploads (e.g., fish is a female food according to the mediawhile men consume it much more) can be better explainedby gender stereotypes that are promoted by the media thanby actual consumption.Although we do not think that our approach can substitute surveys about dietary preferences and food consumption, it highlights the potential of revealing which type offood is more popular among which gender and how doesthat changes over time and space.Last, we remark that this work is preliminary as it is limited to the study of a single online platform. To discoverwhether the expression of online identity through food pictures in relation to the gender changes significantly with thetype of community we plan to extend this study to additional online photo sharing services.6.[1] S.REFERENCESAbbar, Y. Mejova, and I. Weber. You tweet whatyou eat: Studying food consumption through twitter.In Proceedings of the SIGCHI Conference on HumanFactors in Computing Systems, CHI ’15, 2015.[2] S. L. Calvert. Identity construction on the Internet. InS. L. Calvert, A. B. Jordan, and R. R. ][17][18][19][20][21][22]editors, Children in the digital age: Influences ofelectronic media on development, pages 57–70. PraegerPublishers/Greenwood Publishing Group, Westport,CT, US, 2002.D. Crystal. Language and the Internet. CambridgeUniversity Press, 2001.C. Fischler. Food, self and identity. Social ScienceInformation, 27(2):275–292, 1988.S. Freud. Civilization and Its Discontents. W. W.Norton and Company, 1989.P. M. Greenfield and K. Subrahmanyam. Onlinediscourse in a teen chatroom: New codes and newmodes of coherence in a visual medium. Journal ofApplied Developmental Psychology, 24(6):713 – 738,2003.S. C. Herring. Gender Differences in CMC: Findingsand Implications. CPSR Newsletter, 18(1), 2000.D. A. Huffaker and S. L. Calvert. Gender, identity,and language use in teenage blogs. Journal ofComputer-Mediated Communication, 10(2), 2005.J. M. Jones. U.s. drinkers divide between beer andwine as favorite, Aug 2013. Food Surveys ResearchGroup.C. G. Jung, R. Hull, and J. Campbell. The PortableJung. Penguin Books, 1976.D. K.Pollock. Food and sexual identity among theculina. In C. M.Counihan and S. L.Kaplan, editors,Food and Gender: Identity and Power. Harwoodacademic publishers, 1998.E. Kubberød, Øydis Ueland, M. Rødbotten,F. Westad, and E. Risvik. Gender specific preferencesand attitudes towards meat. Food Quality andPreference, 13(5):285 – 294, 2002.R. Lakoff. Identity a la carte; or, you are what youeat. In Discourse and identity (Studies in interactionalsociolinguistics), pages 147–165, 2006.H. Rothgerber. Real men don’t eat (vegetable) quiche:Masculinity and the justification of meat consumption.Psychology of Men & Masculinity, 14:363–375, 2013.E. R. Service. Commodity consumption by populationcharacteristics. United States Department ofAgriculture.T. Silva, P. V. D. Melo, J. Almeida, M. Musolesi, andA. Louriero. You are what you eat (and drink):Identifying cultural boundaries by analyzing food &drink habits in foursquare. In Proceedings of 8th AAAIInternational Conference on Weblogs and Social Media(ICWSM’14), 2011.J. Sobal. Men, meat, and marriage: Models ofmasculinity. Food and Foodways, 13(1-2):135–158,2005.S. Spencer, C. Steele, and Q. DM. Stereotype threatand women’s math performance. Journal ofExperimental Social Psychology, 35(1):4–28, Mar.1999.S. Turkle. Life on the Screen. Simon and Schuster,2011.C. Wagner, P. Singer, and M. Strohmaier. The natureand evolution of online food preferences. Spinger EPJData Science Journal, 2015.C. Word, M. Zanna, and J. Cooper. The nonverbalmediation of self-fulfilling prophecies in interracialinteraction*1. Journal of Experimental SocialPsychology, 10(2):109–120, Mar. 1974.D. A. Zellner, A. Garriga-Trillo, S. Centeno, andE. Wadsworth. Chocolate craving and the menstrualcycle. Appetite, 42(1):119 – 121, 2004.
paring the ratio between the proportion of men and women that uploaded pictures of the same food category (cf. Fig-ure 3). For example, 24% of all men uploaded at least one picture of beer at some point, while 17% of women did the same. This leads to a men-women ratio of 1.41 which means that beer is 41% more popular among male users than fe .