Transcription
Rosetta Stone Analysis Report:Establishing a Concordancebetween PASEC andTIMSS/PIRLS
UNESCOThe constitution of the United Nations Educational, Scientific and Cultural Organization (UNESCO) was adopted by 20countries at the London Conference in November 1945 and entered into effect on 4 November 1946.The main objective of UNESCO is to contribute to peace and security in the world by promoting collaboration among nationsthrough education, science, culture and communication in order to foster universal respect for justice, the rule of law, and thehuman rights and fundamental freedoms that are affirmed for the peoples of the world, without distinction of race, sex, languageor religion, by the Charter of the United Nations.To fulfill its mandate, UNESCO performs five principal functions: 1) prospective studies on education, science, culture andcommunication for tomorrow’s world; 2) the advancement, transfer and sharing of knowledge through research, training andteaching activities; 3) standard-setting actions for the preparation and adoption of internal instruments and statutoryrecommendations; 4) expertise through technical cooperation to Member States for their development policies and projects; and5) the exchange of specialized information.UNESCO Institute for StatisticsThe UNESCO Institute for Statistics (UIS) is the statistical office of UNESCO and is the UN depository for global statistics in thefields of education, science, technology and innovation, culture and communication. The UIS was established in 1999. It wascreated to improve UNESCO’s statistical programme and to develop and deliver the timely, accurate and policy-relevant statisticsneeded in today’s increasingly complex and rapidly changing social, political and economic environments.Published in 2022 by:UNESCO Institute for StatisticsC.P 250 Succursale HMontréal, Québec H3G 2K8CanadaEmail: rgRef: UIS/2022/LO/RR/14 UNESCO-UIS 2022This publication is available in Open Access under the Attribution-ShareAlike 3.0 IGO (CC-BY-SA 3.0 IGO) 3.0/igo/). By using the content of this publication, the users accept to be bound bythe terms of use of the UNESCO Open Access Repository a-en). Thedesignations employed and the presentation of material throughout this publication do not imply the expression of any opinionwhatsoever on the part of UNESCO concerning the legal status of any country, territory, city or area or of its authorities orconcerning the delimitation of its frontiers or boundaries. The ideas and opinions expressed in this publication are those of theauthors; they are not necessarily those of UNESCO and do not commit the Organization.Cover design by: büro SvenjaAcknowledgementsThe Rosetta Stone Analysis Report was a UNESCO Institute for Statistics (UIS) collaborative project. The InternationalAssociation for the Evaluation of Educational Achievement (IEA) was the technical partner for this project and the TIMSS &PIRLS International Study Center, Lynch School of Education and Human Development, Boston College is the author of thisreport. Technical and implementation support was provided by CONFEMEN and LLECE.The UIS would like to thank the report writers, Lale Khorramdel, Liqun Yin, Pierre Foy, Ji Yoon Jung, Ummugul Bezirhan andMatthias von Davier. Silvia Montoya (UIS), Dirk Hastedt (IEA), and Oliver Neuschmidt (IEA) served as reviewers for this report.For more information about TIMSS contact TIMSS & PIRLS International Study Center https://timssandpirls.bc.edu/
1. Summary . . . . . . . . . . . . . . . . . . . . . . . . . . . . . . . . . . . . 12. Introduction. . . . . . . . . . . . . . . . . . . . . . . . . . . . . . . . . . . 23. Rosetta Stone Instruments and Test Design . . . . . . . . . . . . . . . . . 34. Analysis Overview and Sample. . . . . . . . . . . . . . . . . . . . . . . . 55. Data Quality Evaluation. . . . . . . . . . . . . . . . . . . . . . . . . . . . . 66. IRT Models. . . . . . . . . . . . . . . . . . . . . . . . . . . . . . . . . . . 116.1IRT Scaling in Large-Scale Assessments . . . . . . . . . . . . . . . . . . . . . . . . . 116.2IRT Models for Dichotomous Items: Rasch Model, 2PL Model and 3PL Model . . . . . 126.3IRT Model for Polytomous Items: GPCM . . . . . . . . . . . . . . . . . . . . . . . . . .136.4Unidimensionality . . . . . . . . . . . . . . . . . . . . . . . . . . . . . . . . . . . . . .136.5Conditional Independence . . . . . . . . . . . . . . . . . . . . . . . . . . . . . . . . . 146.6Monotonicity of Item-Proficiency Regressions . . . . . . . . . . . . . . . . . . . . . . .146.7Multidimensional IRT Models . . . . . . . . . . . . . . . . . . . . . . . . . . . . . . . .167. IRT Model Application to PASEC and Rosetta Stone Data. . . . . . . . . 167.1Establishing Comparability through IRT Scaling . . . . . . . . . . . . . . . . . . . . . .167.2Results for Unidimensional IRT Models . . . . . . . . . . . . . . . . . . . . . . . . . . 197.3Results for Multidimensional IRT Models . . . . . . . . . . . . . . . . . . . . . . . . . .238. Population Models. . . . . . . . . . . . . . . . . . . . . . . . . . . . . . . 238.1Integrating Achievement Data and Context Information . . . . . . . . . . . . . . . . . .238.2Group-Level Proficiency Distributions and Plausible Values . . . . . . . . . . . . . . . 249. Population Model Application to PASEC and Rosetta Stone Data. . . . . . 269.1Applied Population Models . . . . . . . . . . . . . . . . . . . . . . . . . . . . . . . . .269.2Generating Plausible Values and PASEC Score Validation . . . . . . . . . . . . . . . .279.3Transforming the Plausible Values to TIMSS and PIRLS Scales . . . . . . . . . . . . . 29ANALYSIS REPORTROSET TA STONE3
10. Establishing an Enhanced Concordance between Scales . . . . . . . . . 2910.1 Predictive Mean Matching (PMM) . . . . . . . . . . . . . . . . . . . . . . . . . . . . . 3010.2 Technical Procedure for Establishing Concordance Tables . . . . . . . . . . . . . . . .3110.3 Advantages of the Enhanced Concordance Method . . . . . . . . . . . . . . . . . . . 3311. Establishing an Enhanced Concordance between PASEC andTIMSS/PIRLS. . . . . . . . . . . . . . . . . . . . . . . . . . . . . . . . . 3311.1 Relationship between PASEC data and Rosetta Stone Linking data . . . . . . . . . . .3411.2 Creating Preliminary Concordance Tables . . . . . . . . . . . . . . . . . . . . . . . . .3611.3 Smoothing and Extrapolating the Concordance Tables . . . . . . . . . . . . . . . . . .3712. How to Use and Interpret the Concordance Tables. . . . . . . . . . . . . 43References . . . . . . . . . . . . . . . . . . . . . . . . . . . . . . . . . . . . 45Appendix A: Example of Generated PVs based on the Concordance Tablefor PASEC Mathematics . . . . . . . . . . . . . . . . . . . . . . . . . . . . . 49Appendix B: Example of Generated PVs based on the Concordance Tablefor PASEC Reading. . . . . . . . . . . . . . . . . . . . . . . . . . . . . . . . 55Appendix C: Using the Rosetta Stone Concordance Tables –Analysis Steps . . . . . . . . . . . . . . . . . . . . . . . . . . . . . . . . . . . 61Analysis Steps . . . . . . . . . . . . . . . . . . . . . . . . . . . . . . . . . . . . . . . . . . .62ANALYSIS REPORTROSET TA STONE4
ROSETTA STONE ANALYSIS REPORT:Establishing a Concordance between PASEC and TIMSS/PIRLSLale Khorramdel, Liqun Yin, Pierre Foy, Ji Yoon Jung,Ummugul Bezirhan and Matthias von Daviertimssandpirls@bc.edu1. SummaryThis report is concerned with establishing a concordance between the regional PASEC and theinternational TIMSS and PIRLS achievement scales in francophone Sub-Saharan countries.The Rosetta Stone study consists of two assessment parts. The first part is the PASEC assessmentincluding the PASEC context questionnaire. The second part is the Rosetta Stone assessment comprisingtest booklets with easier item blocks and passages from TIMSS and PIRLS. Both assessment parts wereadministered in three PASEC countries to the same students on two consecutive days.Analyses were conducted using classical item statistics, item response theory (IRT) and populationmodeling. They comprise the evaluation of the data quality, evaluation of the psychometric quality of theinstruments, establishing common scales across countries and assessments, and constructing concordancetables which account for the uncertainty of the measurement (measurement error).The key findings can be summarized as follows: The difficulty of the selected TIMSS and PIRLS item blocks and passages are appropriate forthe Rosetta Stone analysis and the goals of the study. Comparable PASEC and Rosetta Stone IRT scales could be established across countries. Population models were able to be estimated providing proficiency distributions for PASECand Rosetta Stone scales.Comparable IRT scales could be established across Rosetta Stone and TIMSS/PIRLS.Latent correlations in multidimensional IRT models between PASEC mathematics and TIMSS(r .81-.86) and PASEC reading and PIRLS (r .78-.83) suggest that constructs are notidentical but similar enough to enable a concordance.ANALYSIS REPORTROSET TA STONE1
Plausible values (PVs) for PASEC scales were imputed independently by the TIMSS & PIRLSInternational Study Center based on the Rosetta Stone study data for validation purposes.They were found to be highly correlated to the PVs provided by the PASEC team (PASECmathematics: r .96-.97; PASEC reading: r .96-.98) indicating very good agreement ofanalytic processes. Moreover, country means based on PVs for PASEC scales provided by the PASEC team werecompared to country means based on the published PASEC 2019 PVs and were found to bevery similar. This is indicating that the Rosetta Stone student sample is comparable to thePASEC 2019 student sample. Population models were applied to the Rosetta Stone data to obtain posterior means and PVsfor TIMSS numeracy and PIRLS literacy. Estimates from both assessments, PASEC and Rosetta Stone, were used to establishconcordance tables that provide a conditional distribution on the TIMSS and PIRLS scales fora range of PASEC score levels. The concordance should be used with care, being aware of the limitations of countryparticipation and sample sizes, and differences between assessments. The concordance provides a projection and not a direct linking of scales. However, when usedand interpreted properly, concordance tables can provide useful and valuable information bycomparing regional assessment results with international benchmarks. New countries seeking a concordance between PASEC and TIMSS and PIRLS are encouragedto participate in a Rosetta Stone study first.The following sections in this report describe the instruments and design of the Rosetta Stonelinking study, the psychometric analyses, and the construction of the concordance tables as well as theirlimitations and appropriate use and interpretation.2. IntroductionIEA’s Rosetta Stone study is designed to measure global progress toward the United Nations (UN)Sustainable Development Goal 4 for quality in education (SDG 4, Target 4.1) by relating different regionalassessment programs to TIMSS (Trends in International Mathematics and Science Study) and PIRLS(Progress in International Reading Literacy Study) international long-standing metrics and benchmarks ofachievement . The goal is to provide participating countries, who participated in regional assessments butnot in TIMSS and PIRLS, with information about the proportions of primary school students that haveachieved established international proficiency levels in literacy and numeracy for allowing internationalcomparisons.ANALYSIS REPORTROSET TA STONE2
This analysis report describes the study, methods, and analysis conducted to establish a concordancebetween the Programme for the Analysis of Education Systems (PASEC; Programme d’Analyse desSystèmes Éducatifs) in francophone Sub-Saharan countries and TIMSS and PIRLS. PASEC assessesstudent achievement in mathematics, reading, and listening comprehension at grades two and six (i.e.,at the beginning and end of primary) and is conducted by the Conference of Ministers of Education ofFrench-Speaking Countries (CONFEMEN).To construct the concordance, the 2019 PASEC assessment was administered to students at the sixthgrade together with the Rosetta Stone linking booklets that contained items from TIMSS and PIRLS.The content of PASEC’s mathematics assessment was expected to align well with the TIMSS fourth gradeassessments in numeracy and mathematics. Similarly, the content of PASEC’s reading assessments wasexpected to align with the PIRLS fourth grade assessment in literacy and reading comprehension. TheTIMSS & PIRLS International Study Center at Boston College was responsible for the development of theRosetta Stone assessment, the psychometric analysis, and the establishment of the concordance tables.The overarching goal is to construct a concordance table that projects the score distributionsestimated from the PASEC mathematics and reading assessments to distributions on TIMSS and PIRLS,respectively. The concordance table would therefore represent the “Rosetta Stone”, analogous to theoriginal Rosetta Stone which provided a link between Greek and Egyptian hieroglyphics, that enables atranslation between the countries’ regional assessment results and the TIMSS and PIRLS achievementscales. Countries participating in the regional assessments can then use the translations to estimatepercentages of their students that could be expected to reach the TIMSS and PIRLS internationalbenchmarks.The Rosetta Stone study for PASEC is a collaborative project between the UNESCO Institute forStatistics (UIS), the PASEC study center (CONFEMEN), IEA, and the TIMSS & PIRLS InternationalStudy Center at Boston College, as well as the national teams of the participating countries Burundi,Guinea, and Senegal. Questions about linking design, the data analyses, and the report for the RosettaStone study for PASEC should be directed to the TIMSS & PIRLS International Study Center at BostonCollege (timssandpirls@bc.edu).3. Rosetta Stone Instruments and Test DesignOne of the major goals and design principles of large-scale surveys of student achievement is to providevalid comparisons across student populations based on broad coverage of the achievement domain. Thisusually translates into a large number of achievement items, only a fraction of which can be administeredto any one student given the available testing time. Therefore, Rosetta Stone is based on a matrix-samplingbooklet design where each student was administered only a subset of the selected item pools. Moreover,a subset of less difficult TIMSS and PIRLS item blocks and passages was used to best target the difficultyANALYSIS REPORTROSET TA STONE3
of the assessment for participating countries. The Rosetta Stone study comprises two assessment parts.The first part is the PASEC assessment including the PASEC achievement items and PASEC contextquestionnaire. The second part is the centerpiece of the study, the Rosetta Stone assessment part consistingof test booklets with easier TIMSS item blocks and passages and easier PIRLS passages. More precisely,items come from TIMSS Numeracy 2015, TIMSS 2019 less difficult (LD) and PIRLS Literacy 2016. Intotal, eight less difficult mathematics item blocks and four literacy passages were selected. Exhibit 3.1provides the number of items and source for each item block and passage. Both assessment parts wereadministered as paper-based assessments to the same students. Each student was administered one PASECbooklet on the first day and one Rosetta Stone booklet on the second day. A description of the PASEC2019 booklet design can be found in the related PASEC 2019 report (PASEC, 2020).Exhibit 3.1: Rosetta Stone Linking Item Blocks and PassagesSourceNumber of ItemsTIMSS BlocksN01TIMSS Numeracy 2015 – N0113N02TIMSS 2019 LD – MN0414N03TIMSS 2019 LD – MN0713N04TIMSS 2019 LD – MN0513N05TIMSS 2019 LD – MN0113N06TIMSS 2019 LD – MN1414N07TIMSS 2019 LD – MN0313N08TIMSS 2019 LD – MN0912Total TIMSS Items105PIRLS PassagesL01PIRLS Literacy 2016 – Baghita’s Perfect Orange (Literary)16L02PIRLS Literacy 2016 – African Rhinos (Informational)17L03PIRLS Literacy 2016 – The Pearl (Literary)15L04PIRLS Literacy 2016 – Ants (Informational)14Total PIRLS Items62Exhibit 3.2 illustrates the design for the Rosetta Stone assessment part, which was arranged intoeight linking booklets. Each block or passage appeared twice in a balanced incomplete block design.The numeracy blocks appeared in different positions (at the beginning or the end of a booklet) tocounterbalance possible position effects. Students had 40 minutes to complete each part of the linkingbooklet, with a short break in between.ANALYSIS REPORTROSET TA STONE4
Exhibit 3.2: Rosetta Stone Linking Booklet DesignBooklet1Part 1N012Part 01L02N06N07N08L01L04N08N014. Analysis Overview and SampleTo establish concordance tables, the analysis of the data proceeded in four steps. These steps are brieflydescribed here and then in more detail in sections 5 to 11. First, data quality was evaluated based onclassical item statistics and an analysis of nonresponse (section 5). Second, IRT models were used tofurther examine the psychometric quality of the assessment booklets and for constructing comparablePASEC and Rosetta Stone scales across student populations (sections 6 and 7). Third, population modelswere used to impute plausible values (PVs) separately for PASEC and Rosetta Stone (sections 8 and 9).Fourth, concordance tables were established based on posterior means and PVs from the populationmodels (sections 10 and 11). The analysis was performed on data from three PASEC countries usingsample weights provided to the TIMSS & PIRLS International Study Center.Exhibit 4.1 provides the sample sizes for each country available for the scaling and populationmodeling. Cases with sample weights and responses to achievement items (PASEC items, Rosetta Stoneitems, or both) were included in the analysis while cases with responses only to the PASEC contextquestionnaire items were excluded. The sample size and number of schools per country in the RosettaStone study are smaller in comparison to the full TIMSS and PIRLS assessments where the approximateminimum sample includes 150 schools and 4,500 students for most countries.Exhibit 4.1: Rosetta Stone Sample Sizes per CountryNumber ofStudentsNumber ofSchoolsNumber l2,07299996,628299299CountryTotalANALYSIS REPORTROSET TA STONE5
The main goal of the IRT scaling was to establish comparable scales across countries and across theRosetta Stone and the TIMSS/PIRLS assessments as the basis for a concordance. While PASEC itemswere already calibrated by the PASEC team, which also provided the PVs for PASEC, the TIMSS & PIRLSInternational Study Center performed IRT scaling and population modeling for the Rosetta Stone linkingitems. For validation and replication purposes, the PASEC items were re-calibrated as well. The followingIRT models were estimated:1. Comparability of PASEC items across countries: For evaluating the psychometric propertiesand cross-country comparability of the PASEC items, common item parameters wereestimated across countries and item fit statistics were examined for all item-by-countrycombinations. Resulting item parameters were used to replicate and validate the PASEC PVsthat were received from the PASEC team.2. Comparability of linking items across countries and assessments: To achieve comparable scalesacross Rosetta Stone and TIMSS/PIRLS, item parameters for linking items were borrowedfrom TIMSS and PIRLS and fixed in the analysis for all countries. Item fit was examined forall item-by-country combinations.3. Comparability of PASEC and Rosetta Stone constructs: Through multidimensional IRT models,latent correlations between PASEC and Rosetta Stone scales were estimated to evaluatewhether the PASEC mathematics and reading scales are sufficiently similar to the TIMSS andPIRLS scales for establishing a meaningful concordance between them.The estimated item parameters from the IRT scaling were used in the population models togetherwith context variables from the PASEC background questionnaire for imputing PVs. The populationmodeling was performed at the country-level and separately for PASEC and Rosetta Stone linking data.After the comparability and accuracy of the population modeling approaches used in PASEC and in theRosetta Stone study was confirmed (by re-estimating the PASEC PVs), the posterior means and PVsfrom the population models were used for constructing concordance tables, one for reading and one formathematics. Sections 6 to 9 provide a more detailed description of all IRT and population models, andtheir application to the Rosetta Stone and PASEC data.5. Data Quality EvaluationData quality was evaluated using classical item statistics (percent correct and item-total correlations) andexamining item-level nonresponse variability. Exhibits 5.1 and 5.2 provide the average percent of correctresponses and the average item-total correlation for each Rosetta Stone and PASEC item block and passageby country. The percent of correct responses show that the TIMSS and PIRLS item blocks and passagesare more difficult for the PASEC population than the PASEC mathematics and reading item blocks. TheANALYSIS REPORTROSET TA STONE6
item-total correlations indicate that TIMSS and PIRLS item blocks and passages exhibit similar mediumdiscriminations as PASEC item blocks.Exhibit 5.1: Average Item Difficulty (percent correct) and Discrimination (point-biserial correlation)by Item Block/Passage and Country for 4151.30.3353.50.4671.50.42Item Block/PassageRosetta Stone PIRLSLiteracyPASEC ReadingAverageANALYSIS REPORTROSET TA STONE7
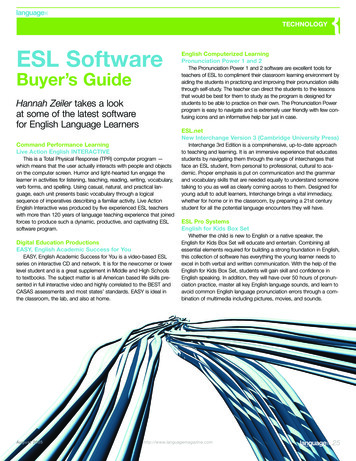
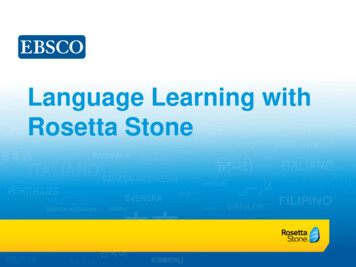
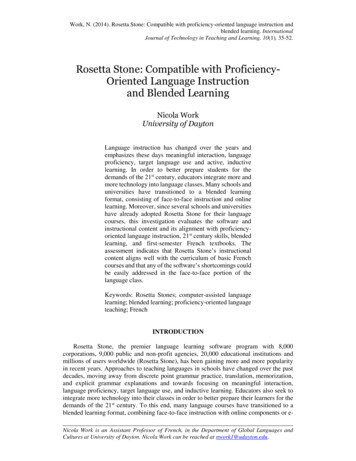
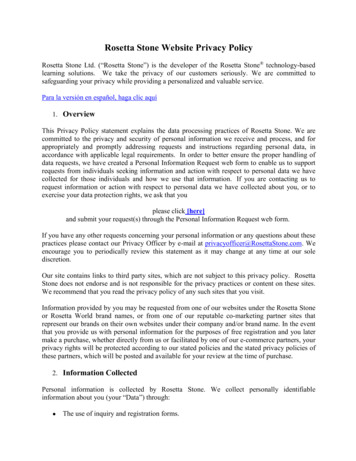
Exhibit 5.2: Average Item Difficulty (percent correct) and Discrimination (point-biserial correlation)by Item Block and Country for .50.3354.80.3756.50.3339.80.3158.40.37Item BlockRosetta Stone TIMSSNumeracy and LDPASEC MathematicsAverageExhibits 5.3 and 5.4 illustrate the average item difficulty (P ) by item block and passage averagedacross countries for PIRLS literacy and PASEC reading and for TIMSS numeracy and PASEC mathematics,respectively. In both figures the blue dots indicate the average P for the specific item blocks andpassages while the red line marks the 50% level as means of comparison. Both figures, as well as thetable in Exhibit 5.1, show that TIMSS and PIRLS item blocks and passages tend to be somewhat moredifficult than PASEC item blocks and passages within and across countries, but that the difficulty is atan appropriate level for the Rosetta Stone analyses.ANALYSIS REPORTROSET TA STONE8
Exhibit 5.3: Average Item Difficulty (percent correct) by Item Block/Passage for PIRLS Literacy andPASEC ReadingExhibit 5.4: Average Item difficulty (percent correct) by Item Block for TIMSS Numeracy andPASEC MathematicsExhibits 5.5 and 5.6 illustrate the average percent of omitted (OM) and not reached (NR) items foreach PASEC and Rosetta Stone item block and passage. The NR rates are small enough and consistentenough across countries and item blocks/passages to not be of any concern. OM rates are higher forRosetta Stone item blocks across all countries, with the exception of literacy passages in Senegal. Senegalhas the lowest OM rates across Rosetta Stone item blocks/passages, while Burundi has the lowest OMrates across PASEC item blocks. Guinea has the highest OM rates across all item blocks/passages.ANALYSIS REPORTROSET TA STONE9
Exhibit 5.5: Average Percentage of Omitted and Not Reached Items by Item Block/Passage andCountry for OmittedAveragePercent NotReachedAveragePercentOmittedAveragePercent NotReachedAveragePercentOmittedAveragePercent 32.00.78.01.23.30.2Item Block/PassageRosetta Stone (PIRLS)LiteracyAveragePASEC ReadingAverageANALYSIS REPORTROSET TA STONE10
Exhibit 5.6: Average Percentage of Omitted and Not Reached Items by Item Block and Country PercentOmittedAveragePercent NotReachedAveragePercentOmittedAveragePercent NotReachedAveragePercentOmittedAveragePercent 11.01.90.1Item BlockRosetta Stone(TIMSS) NumeracyPASEC MathematicsAverage6. IRT ModelsSection 6 describes item response theory (IRT) models and the estimation of item parameters and studentproficiencies, in general. This is followed by section 7 which describes the application of IRT scaling inRosetta Stone specifically and the PASEC item re-calibration.6.1 IRT Scaling in Large-Scale AssessmentsGiven the complexities of the data collection and the need to describe student achievement on a scalethat represents the entirety of the assessment frameworks, large-scale assessments such as TIMSS, PIRLS,or Rosetta Stone rely on IRT scaling to provide accurate measures of student proficiency distributions.Item Response Theory (IRT; Lord & Novick, 1968) has become one of the most important tools ofeducational measurement as it provides a flexible framework for estimating proficiency scores fromstudents’ responses to test items. IRT is particularly well suited to handle data collection designs in whichANALYSIS REPORTROSET TA STONE11
not all students are tested with all items. The assumptions made for enabling IRT methods to handle thesetypes of designs, commonly known as balanced incomplete block designs (e.g., von Davier, Sinharay,Oranje & Beaton, 2006; von Davier & Sinharay, 2013), can be described and tested formally (e.g., Fischer,1981; Zermelo, 1929).In terms of the mathematical notation used in this report, the item response variables on anassessment are denoted by for items i 1, ., I. The set of responses to these items is xv (xv1, ., xvi) forstudent v. For simplicity, we assume xvi 1 denotes a correct response and xvi 0 denotes an incorrectresponse. The expected achievement is assumed to be a function of an underlying latent proficiencyvariable, often in IRT denoted by θv, a real-valued variable. Then, we can write:IP (xvi θv ; ζi )P (xv θv ) (6.1)i 1where P(xvi θv ; ζi) represents the probability of an either correct or incorrect response of a respondentwith ability θv and an item with a certain characteristic ζi. In IRT, these item-specific effects are referred toas item parameters. Equation (6.1) is a statistical model describing the probability of a set of the observedresponse given ability θv. This collective probability is the product of the individual item probabilities.Many IRT models used in educational measurement can be understood as relatively straightforwardgeneralizations of the approach shown in equation (6.1). While PASEC uses the Rasch model, TIMSSand PIRLS use the 3PL model for multiple-choice items, the 2PL model for constructed-response itemsworth 1 score point, and the GPCM for constructed-response items worth more than 1 score point. Thefollowing section describes these models in more detail.6.2 IRT Models for Dichotomous Items: Rasch Model, 2PL Model and 3PL ModelThe Rasch model and the two- and three-parameter logistic (2PL and 3PL) models are suitable foritems with only two response categories (i.e., dichotomously scored items). The 2PL model (Birnbaum,1968, in Lord & Novick, 1968) is a generalization of the Rasch model (Rasch, 1960), which assumesthat the probability of a correct response to item i depends only on
8.2roup-Level Proficiency Distributions and Plausible Values G . . . . . . . . . . . . . . . 24 9.opulation Model Application to PASEC and Rosetta Stone Data P . . 2.Introduction IEA's Rosetta Stone study is designed to measure global progress toward the United Nations (UN) Sustainable Development Goal 4 for quality in education (SDG 4 .