Transcription
Mini-ReviewTheScientificWorldJOURNAL (2010) 10, 135–144ISSN 1537-744X; DOI 10.1100/tsw.2010.21Delineating Neural Structures ofDevelopmental Human Brains withDiffusion Tensor ImagingHao HuangAdvanced Imaging Research Center, University of Texas Southwestern MedicalCenter, DallasE-mail: hao.huang@utsouthwestern.eduReceived December 15, 2009; Revised January 8, 2010; Accepted January 11, 2010; Published January 21, 2010The human brain anatomy is characterized by dramatic structural changes during fetaldevelopment. It is extraordinarily complex and yet its origin is a simple tubular structure.Revealing detailed anatomy at different stages of brain development not only aids inunderstanding this highly ordered process, but also provides clues to detectabnormalities caused by genetic or environmental factors. However, anatomical studiesof human brain development during the fetal period are surprisingly scarce andhistology-based atlases have become available only recently. Diffusion tensor imaging(DTI) measures water diffusion to delineate the underlying neural structures. The highcontrasts derived from DTI can be used to establish the brain atlas. With DTItractography, coherent neural structures, such as white matter tracts, can be threedimensionally reconstructed. The primary eigenvector of the diffusion tensor can befurther explored to characterize microstructures in the cerebral wall of the developmentalbrains. In this mini-review, the application of DTI in order to reveal the structures ofdevelopmental fetal brains has been reviewed in the above-mentioned aspects. The fetalbrain DTI provides a unique insight for delineating the neural structures in bothmacroscopic and microscopic levels. The resultant DTI database will provide structuralguidance for the developmental study of human fetal brains in basic neuroscience, andreference standards for diagnostic radiology of premature newborns.KEYWORDS: DTI, fetal brain, atlas, tractography, 3D, microstructureINTRODUCTIONBrief Principles of DTIDiffusion tensor imaging (DTI)[1] is an imaging technique of magnetic resonance imaging (MRI). Itcomes from the measurements of water diffusion. Modern MR scanners are usually equipped with threeorthogonal gradient systems. These gradients have different applications. Besides being used mostly as“imaging gradients”, one application of these gradients is to be used as “diffusion gradients”. A typicaldiffusion sequence[2] is featured with a pair of diffusion gradients placed on either side of the refocusing 2010 with author.Published by TheScientificWorld; www.thescientificworld.com135
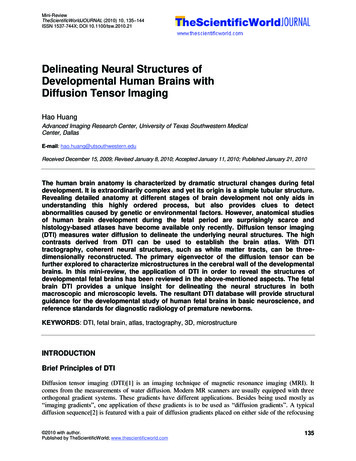
Huang: Delineating Neural Structures of Developmental Brains with DTITheScientificWorldJOURNAL (2010) 10, 135–144pulse. By sampling the diffusion orientations in the three-dimensional space, the diffusion profile can bemeasured with signals from a diffusion weighted image (DWI) correspondent to a certain diffusionorientation. Since a diffusion tensor has six degrees of freedom, at least six diffusion-sensitized images orDWIs need to be acquired to fit the tensor besides a nondiffusion image. The properties of the threedimensional ellipsoid are usually defined by the following parameters: the length of the longest, middle,and shortest axes (called eigenvalues λ1, λ2, and λ3) and their orientations (called eigenvectors ν1, ν2, andν3). As the three axes are orthogonal to each other, only six parameters, i.e., λ1, λ2, λ3 and x, y, zcomponent of ν1, are independent.DTI-derived images can be obtained from the eigenvalues and eigenvectors of the diffusion tensor.Three DTI-derived images are widely used, namely anisotropy map[3,4,5,6,7], directionally encodedcolor map[8,9], and apparent diffusion coefficient (ADC) map. With these DTI-derived contrasts, detailedneural structures have been revealed in human (e.g., [4,8,10,11,12,13,14,15]) and mouse brains(e.g.,[16,17,18,19]). How these DTI-derived metrics are generated is described below.Fractional anisotropy (FA)[20] is probably used mostly to characterize the anisotropy of the tensor.The equation of FA is as follows:FA ( 1 2 )2 ( 1 3 )2 ( 2 3 )22 21 22 23(1)The values of FA range from 0 to 1. The higher the value of FA, the more elongated the shape of thediffusion ellipsoid looks. ADC is a physical value and usually has the unit of 10 –3 mm2/sec. It can beobtained with the simple average of the three eigenvalues:ADC (λ1 λ2 λ3)/3(2)In addition, the eigenvector associated with the largest eigenvalue (ν1), or primary eigenvector, can beused as an indicator of fiber orientation. A DTI directionally encoded color map is usually generated tocombine the information of FA and ν1. For the color presentation, 24-bit color is used, in which eachRGB color has 8-bit (0-255) intensity levels. The unit vector ν1 ( [ν1x, ν1y, ν1z]) always fulfills thecondition: ν1x2 ν1y2 ν1z2 1. Intensity values of ν1x2 *255, ν1y2*255, and ν1z2 *255 will be assigned to theR(ed), G(reen), and B(lue) channel, respectively. In order to suppress orientation information in isotropicbrain regions, the 24-bit color value will be multiplied by FA. In the directionally encoded color map[9],red (R), green (G), and blue (B) colors are assigned to left-right, anterior-posterior, and superior-inferiororientations, respectively.DTI-Derived Images Provide High Contrasts to Delineate Neural Structures inDevelopmental BrainsDifferent neural structures in the fetal brains can be delineated with the DTI-derived images. Fig. 1 showsthe DTI-derived images of a 21-week fetal brain. They are coronal images at the anterior commissure (ac)level. In Fig. 1a, the FA map characterizes the shapes of the diffusion tensor. Diffusion tensors at the darkregions are more like spheres and those at bright regions display more elongated shapes. Examples ofdiffusion tensors with both shapes are also illustrated in Fig. 1a. Some transient subcortical neuralstructures can be further differentiated based on FA in the developmental stage of the human fetus. Forexample, the ganglionic eminence (GE), a transient neural structure in the fetal brain, has high FA valuesand surrounds the low-FA caudate neucleus (Caud) around the ventricles (Fig. 1a). With the directionallyencoded color map in Fig. 1b, most major white matter tracts, such as anterior commissure (ac), fornix(fx), cingulum (cg), and internal capsule (ic), can be clearly identified. The map of ADC, depicting thesize of the diffusion ellipsoid, is shown in Fig. 1c. The ADC map displays very different contrasts from other136
Huang: Delineating Neural Structures of Developmental Brains with DTITheScientificWorldJOURNAL (2010) 10, 135–144FIGURE 1. (a) FA map, (b) directionally encoded color map, (c) ADC map, and (d) aDWI, all derived from DTI and shown in a coronal slice ofa 21-week fetal brain. High contrasts from DTI-derived images reveal many neural structures, including both white matter tracts and subcorticalnuclei. The FA map in (a) describes the shape of the diffusion tensor, namely, how elongated a diffusion ellipsoid is. A voxel with high FA valueindicates that it is characterized with a more elongated diffusion ellipsoid (left in the upper row), while a voxel with low FA value ischaracterized with the diffusion ellipsoid more like a sphere (right in the upper row). The blue small dots represent the wat er molecules and bluecurves simulate the paths of the movement of water molecules. R(ed)/G(reen)/B(lue) in (b) indicate the left-right, anterior-posterior, and superiorinferior structural orientation, respectively. aDWI in (d) reveals the subcortical neural structures.DTI-derived images. Fig. 1d is the averaged diffusion weighted image (aDWI) generated by summing upall DWIs. aDWI[21] has higher signal-to-noise-ratio (SNR) due to data averaging. Its contrast is similarto that of the DWI, which is acquired with the same diffusion gradient strength in all three directions.Other neural structures, such as claustrum (Clau), putamen (Put), and amagdala (Amy), can be delineatedwith this contrast. Detailed review of DTI and its derived metrics can be found in the literature[22,23,24].Primary Eigenvector of DTI can be used to Trace the Coherent Tracts and Revealthe MicrostructuresThe direction of the primary eigenvector (ν1) of the tensor is believed to align with the orientation of theunderlying organized structures. This property makes the primary eigenvector useful to characterize thestructures in two aspects, tracing the coherent tracts with tractography and revealing the microstructures.Three-dimensional axonal bundles can be reconstructed from DTI data by tractography. DTI-basedtractography refers to the techniques of connecting these primary eigenvectors to reconstruct thepathways of the coherent tracts. Streamline propagation methods[25,26,27,28,29,30,31] are mostly used.137
Huang: Delineating Neural Structures of Developmental Brains with DTITheScientificWorldJOURNAL (2010) 10, 135–144DTI-based tractography requires a fractional anisotropy value higher than threshold and orientationcontinuity of primary eigenvector. Due to the fact that the diffusion tensor model oversimplifies thecomplex neural structures inside the brains, many other tractography algorithms that adapt moresophisticated diffusion models (e.g., [32,33,34,35,36,37,38]) rather than tensor have been postulated.However, for major white matter tracts, comparison of these DTI-based tractography and postmortemhistological slides has shown that tractography based on DTI can reconstruct them accurately[12,39].The second application of the measured primary eigenvector of the diffusion tensor is to reveal themicrostructures in the cerebral wall. This is especially useful in developing brains. Unlike the adult brain,the cerebral wall in developing brains usually includes layers that have highly organized microstructures.These microstructures have been delineated in the developing brains of cat[40], mouse[16], rat[41], andhuman[42,43,44,45] with the primary eigenvector of the diffusion tensor. Because of the noninvasivenature of DTI, with 3D-DTI imaging technology, the orientations of these microstructures can bevisualized and quantified in the three-dimensional space. For example, to represent the relativeorientations of the microstructures in the cortical plate, the angles between the primary eigenvector(representing the orientations of the microstructures in the cortical plate) and normal vector of the corticalsurface could be measured and visualized for the human fetal brains[45]. This measurement was used toindicate the distribution pattern of the orientations of the microstructures in the developmental brains.FETAL BRAIN DTI ATLASWith the high contrasts of directionally encoded color maps, many white matter and subcortical neuralstructures can be identified. These structures can be further labeled with the guidance of the histologicalfetal brain atlas[46] and DTI white matter atlas of adult human[15] to generate the DTI atlas of the fetalbrain. Details of the DTI-based atlas for the fetal brains in the second trimester can be found in theliterature[45]. Here, sagittal-slice DTI fetal brain atlas is shown as an example.In Fig. 2, sagittal slices of directionally encoded color maps are displayed to illustrate thedevelopment of commissural, limbic, and projection white matter tracts during development in the secondtrimester. Sagittal slices of aDWIs demonstrate the development of other major neural structures. Fromthe midsagttial plane of the directionally encoded color map in Fig. 2, it is clear that a major commissuraltract connecting two hemispheres, the corpus callosum, does not become apparent until 15 weeks. In a 13week fetal brain, although the corpus callosum cannot be identified, many other commissural tracts, suchas the middle cerebellar peduncle, optic chiasm, and anterior commissure, are observed. It should also benoted that the midsagittal corpus callosum of the fetal brain is extremely fragile and often severed (e.g.,19- and 21-week brains). In the parasagittal plane of the directionally encoded color map, the GE, whichhas a higher anisotropy than most subcortical nuclei[21], is well distinguished from others. The GE is avery large transient structure existing throughout the entire second trimester. The fornix (fx) and internalcapsule (ic) are both well identified from the beginning to the end of the second trimester. They are alsolabeled in the parasagittal plane of the directionally encoded color map. Other major neural structures arelabeled in the aDWI images in Fig. 2. Subcortical nuclei, such as putamen, caudate nucleus, and thalamus,are well observed in all second-trimester brains. The thickening of the cerebral wall and volume decreaseof the ventricle during development in this period is well observed in the parasagittal aDWIs.THREE-DIMENSIONAL RECONSTRUCTION OF THE WHITE MATTER OFDEVELOPMENTAL BRAINSReconstruction of the white matter tracts directly delineates the three-dimensional morphology of thesetracts. When applied to the same tracts of the developing brains, it can be used to characterize thedevelopmental pattern of certain tracts. Fig. 3 shows the three-dimensional reconstruction of the corpuscallosum and limbic tracts in a 19-week fetal brain, 0-year-old newborn brain, and 5-year-old child’s brain.138
Huang: Delineating Neural Structures of Developmental Brains with DTITheScientificWorldJOURNAL (2010) 10, 135–144FIGURE 2. Fetal brain DTI atlas in sagittal planes. The location of each plane is demonstrated as yellow lines cross-sectioning the brain at theupper-left corner of each panel. Scale bars are shown at the top of the figure. Annotations of major white matter tracts and GE are shown in thedirectionally encoded color maps (the first and third rows) of fetal brains with 13, 15, 17, 19, and 21 weeks of gestational age. Annotations ofother major neural structures are shown in the correspondent aDWI images in the second and fourth rows. Abbreviations not shown in text are asfollows: cc, corpus callosum; cst, cortical spinal tract; dscp, decussation of superior cerebellar peduncle; mcp, middle cerebellar peduncle; oc,optical chiasm; on, optical nerve; Aqu, aquarium; Cblm, cerebellum; Chor Plex, choroid plexus; Hypotha, hypothalamus; Tha, thalamus.It is clear from Fig. 3 that callosal tracts display the anterior-to-posterior developmental pattern, while themorphologies of limbic tracts are quite similar across the three developmental stages.In the upper row of Fig. 3, it can be appreciated that formation of the corpus callosum is moreadvanced in the frontal lobe rather than the occipital lobe for the fetal brain at 19 gestational weeks. Theforceps major (Fmajor) is much smaller than the forceps minor (Fminor) in the fetus. Callosal fibers in theoccipital lobe are not well developed. This is also apparent in the midsagittal plane of the directionallyencoded color maps in Fig. 2, in which the corpus callosum does not extend to the posterior region andthe splenium is not yet well developed. For the 0-year-old newborn brain, the splenium and the forcepsmajor are quite identifiable in Fig. 3, but the tracking results do not extend to some regions in the frontaland parietal lobe. These are the regions where anisotropy is relatively low even in adult brains (typicallyFA 0.3 – 0.4), which is attributed to the mixture of three prominent tracts with different orientations(the corpus callosum, projection fibers, and the superior longitudinal fasciculus)[33]. The lower row ofFig. 3 shows three-dimensional reconstruction results of two important limbic fibers: cingulum (greenfibers) and fornix (red fibers) connecting to the purple hippocampus. These are two of the most dominanttracts in the fetal brain and their entire trajectories are already developed at 19 gestational weeks. Inaddition, some association tract, such as superior longitudinal fasciculus (SLF), is completely missing inthe brain of 19 gestational weeks.139
Huang: Delineating Neural Structures of Developmental Brains with DTITheScientificWorldJOURNAL (2010) 10, 135–144FIGURE 3. Upper row shows the three-dimensional tractography of corpus callosum for 19-gestational-week fetal brain, neonatal brain, andpediatric brain, respectively. The corpus callosum is not well developed in the posterior portion in the 19-week fetal brain. Lower row shows thethree-dimensional reconstruction of the white matter tracts of the limbic system of the brain at the correspondent ages. In the lower row, thefornix (fx, red) and cingulum (cg, green) are reconstructed. The purple structure is the hippocampus.WELL-ORGANIZED MICROSTRUCTURES OF THE CEREBRAL WALLDTI offers a unique insight into these microstructures and helps us to understand that development takesplace in the cerebral wall in a well-ordered manner. The cerebral wall, which is the major component ofthe fetal brain, contains multiple layers[47] and undergoes active structural changes during fetaldevelopment. In the cerebral wall of the developing brain, both laminated and radial structures can bedelineated with DTI. Histology and DTI are considered to be complementary to each other. Hence, Fig. 4shows the axial image of the FA map and correspondent histological slide at the upper cerebrum of a 17week fetal brain to illustrate the detailed structures in the developmental cerebral wall. From Fig. 4, bothlayered and radial structures can be clearly demonstrated with the FA map and the correspondenthistological slide. Three layers can be identified in the FA image with one layer of lower FA nested intwo layers of higher FA. The three layers identified by DTI in the cerebral wall are cortical plate,subplate, and inner layer from outer to inner direction[43,45]. The literature[45] has shown that the threelayers are well identifiable for fetal brains from 15 to 22 gestational weeks of age, but not at 13 to 14weeks. Primary eigenvectors from the diffusion tensor could be used to reveal the orientations of themicrostructures in the cerebral wall. Among the three layers shown in Fig. 4, the outmost cortical platehas been found to have radial microstructures[42], which has been confirmed by several studies usingin vivo DTI imaging of preterm newborn babies[43,44]. It has also been reported that the inner layer has140
Huang: Delineating Neural Structures of Developmental Brains with DTITheScientificWorldJOURNAL (2010) 10, 135–144FIGURE 4. The axial slices of the FA map (a) and correspondent histological slide (b) of a 17 week fetal brain demonstrate laminated layers in the cerebral wall. Three layers with one layerof lower FA value nested in the two layers of higher FA are displayed in the FA map (a). Thesethree layers are labeled with the red numbers. Enlargement of the cerebral wall in the black boxof the histological slide (b) is shown in (c). The correspondent three layers can be identifiedand annotated in (c). Especially, the radial structures in the layer close to the ventricle areprominent. Green arrows in (c) indicate the orientations of these radial structures.relatively higher FA than the middle subplate[43], which can be clearly observed in Fig. 4a. By enlargingpart of the cerebral wall in the histological slide, it can be clearly observed that very organized radialstructures are also dominant in the inner layer surrounding the ventricle (Fig. 4c).Fig. 5a shows the aDWI and directionally encoded color map in an axial slice of the 21-week fetalbrain. Fig. 5b,c shows the layers of the cerebral wall delineated by the aDWI and visualization of theprimary eigenvector, respectively. The histological slide in Fig. 4 matches the visualization of primaryeigenvectors in Fig. 5c, where the radial structures in the cerebral wall of a 21-week fetal brain areevident in layers 1 and 3 and absent in layer 2. Combining the results of Figs. 4 and 5 on structuralcharacterization of the inner layer, it suggests that radial structure, rather than the tangential structure offetal white matter (or intermediate zone) parallel to the ventricular surface and also residing in this layer,is dominant in the inner layer during the second trimester. FA of the inner layer during the secondtrimester is less than FA of the cortical plate, but higher than FA of the subplate. The inner layer containsseveral zones, namely ventricular, periventricular, subventricular, and intermediate zone, from inner toouter direction[47]. The interference of these radial and parallel structures may cause lower FA than thatof the cortical plate where uniform radial structures were found.141
Huang: Delineating Neural Structures of Developmental Brains with DTITheScientificWorldJOURNAL (2010) 10, 135–144FIGURE 5. The axial averaged diffusion weighted image on the left and directionally encoded color map on the right of a 21-week brain areshown in (a). (b) is the enlarged yellow box in (a), showing the laminated layers in the cerebral wall and (c) is the visuali zation of the primaryeigenvectors in the yellow box of (a). Three layers are labeled in (c) where primary eigenvectors of the diffusion tensor are oriented radially inlayers 1 and 3. The black band between layers 1 and 3 in (c) is layer 2, where the primary eigenvectors are oriented in other direction, mostlyperpendicular to the image slice. The color in (c) indicates the magnitude of the eigenvector projected to this axial plane, as illustrated by thecolor bar.The radial structures existing in both cortical plate and inner layer, and revealed by both histology(Fig. 4c) and the primary eigenvector of DTI (Fig. 5c), might be formed by radially arranged scaffoldingof the glial cells and are paths for neuron migration during development. They are highly regularized andperpendicular to the cerebral wall. The neurons are generated from close to the ventricle and migrate inthe inner layer to the low-FA subplate zone where growing major afferent systems temporarily reside,establish synapses, and take part in cellular interactions that are crucial in subsequent corticaldevelopment. After neurons take a break from the migration at the subplate, they follow the radialdirection in the cortical plate to the cortical surface. The whole migration process is from inside to outsideacross the cerebral wall. A previous study[45] indicates that these well-ordered radial structures in theinner layer exist from 15 to at least 22 weeks. Another study in the literature[42] found that the radialorganization in the cortical plate disappears at 36 gestational weeks of age. These two findings[42,45]suggest that the radial organization of the cortical plate exists from 15 to 36 weeks.CONCLUSIONApplication of DTI to the study of the structures of developmental brains has been described in severalaspects. Neural structures of the developmental brains can be identified with high contrasts from DTI. Itenables us to establish a DTI-based atlas. In addition, the primary eigenvectors of the diffusion tensor canbe used to reconstruct the coherent tracts and reveal the microstructures in the cerebral wall. There aremany transient structures that are unique in this developmental stage and disappear at term or duringchildhood development. These unique structures can be found in both white matter and the cerebral wall,and are usually associated with a specific neurodevelopment process. There are also neural structuresexisting in the adult human brain that are completely absent in the fetal brain. The DTI images, with theirrich structural information, can bring us insight into the developmental pattern of neural structures. Theatlas formed from the high-resolution DTI images of the fetal brain is also an invaluable reference fordiagnostic radiology of preterm infants.142
Huang: Delineating Neural Structures of Developmental Brains with DTITheScientificWorldJOURNAL (2010) 10, 135–144ACKNOWLEDGMENTThe author would like to thank Dr. Susumu Mori for generous support of this study with his researchresource. Studies presented in this review are supported by the National Institute of Health EB009545,AG20012, and .15.16.17.18.19.20.21.22.23.24.Basser, P.J., Mattiello, J., and Le Bihan, D. (1994) MR diffusion tensor spectroscopy and imaging. Biophys. J. 66,259–267.Stejskal, E.O. and Tanner, J.E. (1965) Spin diffusion measurement: spin echoes in the presence of a time-dependentfield gradient. J. Chem. Phys. 42, 288.Chenevert, T.L., Brunberg, J.A., and Pipe, J.G. (1990) Anisotropic diffusion in human white matter: demonstrationwith MR technique in vivo. Radiology 177, 401–405.Moseley, M.E., Cohen, Y., Kucharczyk, J., Mintorovitch, J., Asgari, H.S., Wendland, M.F., Tsuruda, J., and Norman,D. (1990) Diffusion-weighted MR imaging of anisotropic water diffusion in cat central nervous system. Radiology176, 439–445.Turner, R., Le Bihan, D., Maier, J., Vavrek, R., Hedges, L.K., and Pekar, J. (1990) Echo-planar imaging of intravoxelincoherent motion. Radiology 177, 407–414.Beaulieu, C. and Allen, P.S. (1994) Determinants of anisotropic water diffusion in nerves. Magn. Reson. Med. 31,394–400.Hsu, E.W. and Mori, S. (1995) Analytical interpretations of NMR diffusion measurement in an anisotropic mediumand a simplified method for determining fiber orientation. Magn. Reson. Med. 34, 194–200.Makris, N., Worth, A.J., Sorensen, A.G., Papadimitriou, G.M., Reese, T.G., Wedeen, V.J., Davis, T.L., Stakes, J.W.,Caviness, V.S., Kaplan, E., Rosen, B.R., Pandya, D.N., and Kennedy, D.N. (1997) Morphometry of in vivo humanwhite matter association pathways with diffusion weighted magnetic resonance imaging. Ann. Neurol. 42, 951–962.Pajevic, S. and Pierpaoli, C. (1999) Color schemes to represent the orientation of anisotropic tissues from diffusiontensor data: application to white matter fiber tract mapping in the human brain. Magn. Reson. Med. 42, 526–540.Le Bihan, D., Breton, E., Lallemand, D., Grenier, P., Cabanis, E., and Laval-Jeantet, M. (1986) MR imaging ofintravoxel incoherent motions: application to diffusion and perfusion in neurologic disorders. Radiology 161, 401–407.Pierpaoli, C., Jezzard, P., Basser, P.J., Barnett, A., and Di Chiro, G. (1996) Diffusion tensor MR imaging of humanbrain. Radiology 201, 637–648.Catani, M., Howard, R.J., Pajevic, S., and Jones, D.K. (2002) Virtual in vivo interactive dissection of white matterfasciculi in the human brain. Neuroimage 17, 77–94.Horsfield, M.A. and Jones, D.K. (2002) Application of diffusion weighted and diffusion tensor MRI to white matterdiseases. NMR Biomed. 15, 570–577.Wakana, S., Jiang, H., Nagae-Poetscher, L.M., Van Zijl, P.C., and Mori, S. (2004) Fiber tract-based atlas of humanwhite matter anatomy. Radiology 230, 77–87.Mori, S., Wakana, S., Nagae-Poetscher, L.M., and van Zijl, P.C. (2005) MRI Atlas of Human White Matter. Elsevier,Amsterdam.Mori, S., Itoh, R., Zhang, J., Kaufmann, W.E., van Zijl, P.C.M., Solaiyappan, M., and Yarowsky, P. (2001) Diffusiontensor imaging of the developing mouse brain. Magn. Reson. Med. 46, 18–23.Sun, S.W., Neil, J.J., Liang, H.F., He, Y.Y., Schmidt, R.E., Hsu, C.Y., and Song, S.K. (2005) Formalin fixation alterswater diffusion coefficient magnitude but not anisotropy in infracted brain. Magn. Reson. Med. 53, 1447–1451.Sun, S.W., Liang, H.F., Trinkaus, K., Cross, A.H., Armstrong, R.C., and Song, S.K. (2006) Noninvasive detection ofcuprizone induced axonal damage and demyelination in the mouse corpus callosum. Magn. Reson. Med. 55, 302–308.Zhang, J., Richards, L.J., Yarowsky, P., Huang, H., van Zijl, P.C., and Mori, S. (2003) Three-dimensional anatomicalcharacterization of the developing mouse brain by diffusion tensor microimaging. Neuroimage 20, 1639–1648.Pierpaoli, C. and Basser, P.J. (1996) Toward a quantitative assessment of diffusion anisotropy. Magn. Reson. Med.36, 893–906.Huang, H., Zhang, J., Wakana, S., Zhang, W., Ren, T., Richards, L.J., Yarowsky, P., Donohue, P., Graham, E., vanZijl, P.C., and Mori, S. (2006) White and gray matter development in human fetal, newborn and pediatric brains.Neuroimage 33, 27–38.Basser, P.J. and Jones, D.K. (2002) Diffusion-tensor MRI: theory, experimental design and data analysis - a technicalreview. NMR Biomed 15, 456–467.Beaulieu, C. (2002) The basis of anisotropic water diffusion in the nervous system – a technical review. NMRBiomed. 15, 435–455.Mori, S. and Zhang, J. (2006) Principles of diffusion tensor imaging and its applications to basic neuroscienceresearch. Neuron 51, 527–539.143
Huang: Delineating Neural Structures of Developmental Brains with .41.42.43.44.45.46.47.TheScientificWorldJOURNAL (2010) 10, 135–144Conturo, T.E., Lori, N.F., Cull, T.S., Akbudak, E., Snyder, A.Z., Shimony, J.S., McKinstry, R.C., Burton, H., andRaichle, M.E. (1999) Tracking neuronal fiber pathways n the living human brain. Proc. Natl. Acad. Sci. U. S. A. 96,10422–10427.Jones, D.K., Simmons, A., Williams, S.C., and Horsfield, M.A. (1999) Non-invasive assessment of axonal fiberconnectivity in the human brain via diffusion tensor MRI. Magn. Reson. Med. 42, 37–41.Mori, S., Crain, B.J., Chacko, V.P., and van Zijl, P.C.M. (1999) Three dimensional tracking of axonal projections inthe brain by magnetic resonance imaging. Ann. Neurol. 45, 265–269.Basser, P.J., Pajevic, S., Pierpaoli, C., Duda, J., and Aldroubi, A. (2000) In vitro fiber tractography using DT-MRIdata. Magn. Reson. Med. 44, 625–632.Poupon, C., Clark, C.A., Frouin, V., Regis, J., Bloch, L., Le Bihan, D., and Mangin, J.F. (2000) Regularization ofdiffusion-based direction maps for the tracking of brain white matter fascicules. Neuroimage 12, 184–195.Parker, G.J., Wheeler-Kingshott, C.A.M., and Barker, G.J. (2002) Estimating distributed anatomical connectivityusing fast marching methods and diffusion tensor imaging. IEEE Trans. Med. Imaging 21, 505–512.Lazar, M., Weinstein, D.M., Tsu
of human brain development during the fetal period are surprisingly scarce and histology-based atlases have become available only recently. Diffusion tensor imaging (DTI) measures water diffusion to delineate the underlying neural structures. The high contrasts derived from DTI can be used to establish the brain atlas. With DTI