Transcription
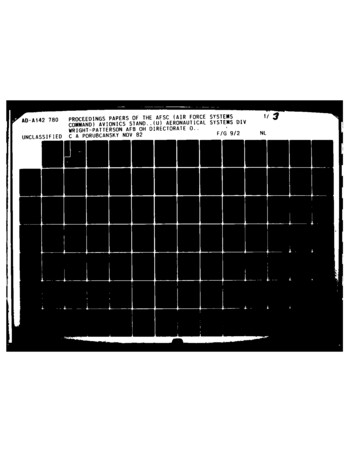
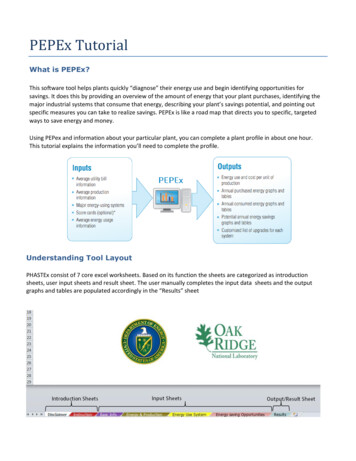
PEPEx TutorialWhat is PEPEx?This software tool helps plants quickly “diagnose” their energy use and begin identifying opportunities forsavings. It does this by providing an overview of the amount of energy that your plant purchases, identifying themajor industrial systems that consume that energy, describing your plant’s savings potential, and pointing outspecific measures you can take to realize savings. PEPEx is like a road map that directs you to specific, targetedways to save energy and money.Using PEPex and information about your particular plant, you can complete a plant profile in about one hour.This tutorial explains the information you’ll need to complete the profile.Understanding Tool LayoutPHASTEx consist of 7 core excel worksheets. Based on its function the sheets are categorized as introductionsheets, user input sheets and result sheet. The user manually completes the input data sheets and the outputgraphs and tables are populated accordingly in the “Results” sheet
Input Sheets – Color SchemeAll the fields in the input tabs follow the color scheme listed below.GrayOrangeYellowUser Input requiredChoose from drop down listNo inputs required – Formulas InsertedMandatory and Non- Mandatory FieldsWhile the sheets have many input fields, only a couple are mandatory for the results to populate. Thesemandatory fields, in each sheet, have their headings marked in “Red” which turn “Black” when these fields arecompleted. The rest of the fields are provided for book keeping purposes.Step 1: Basic InformationThe Basic Information sheet is the first step in PEPex. On this screen you will enter some basic information aboutyour facility.Mandatory Fields are marked in “Red” and turn “Black” when CompleteThe only madated field in this sheet is the “Indusrty Type”. PEPEx uses the industry type data to calculatedefault breakdown of the energy uses per system in Step 3.The remaining questions which include basic information regarding the plant location, operating schedule andenergy management are primarily for book keeping purposes and do not affect the results.
Step 2: Energy and Production DataThe second input sheet in the PEPEx application is “Energy and Production”. You are asked to enter datafrom utility bills and/or sub meter recordings. Some of the important fields on this sheet are discussedbelow.Choose the unit ofmeasurement foryour energy sourcesLeave the units blank if the fuel is not used inyour facility.*Steam is to be defined as an energy sourceonly if user buys steam from a utility or a thirdparty enterprise.Choose the energy metric for youroutput.Choose the interval for energy data input based on the granularity of data available.Input Energy, Cost andProduction data for eachenergy sourceUnits of MeasurementPEPEx allows you to input your energy data for each fuel in the unit which is most familiar to you. Onlywhen presenting results for the various energy sources together does PEPEx convert all units to acommon output unit. The user further has the option to choose this output unit from a list of optonsfrom the dropdown box in cell I11.Facility’s Energy and ProductionOn cell B16, the user can choose to use either annual or monthly data for energy and production inputs.The appropriate tables popup based on the selection. Most of the PEPEx results can be generated withjust the annual data some of the graphs/tables need monthly data. These graphs/tables will be hiddenfrom the results if annual data is used.Site to Source conversion (optional)The user also has the option to input a source energy factor for each fuel used. The default factor of 1 isused for all cases. This results in the outputs being populated with site numbers.The user may wish to make appropriate changes to this factor to account for losses associated withtransmission, delivery, and production of each energy stream.
Step 3: Energy Use SystemsUser defined percent energy used thatoverrides the default valuesDefault percent energy used by each system basedon MECS databaseIn Step 3, select the energy end use systems that consume energy at your plant from the dropdown inColumn C, rows 24 to 35. For each system that is used in the plant it is necessary to choose a primaryenergy source.Based on this information PEPEx populates the default energy breakdown based on the industry type,defined in Step 1, in cells F39 – G50. The default percentages are based on data collected by theManufacturing Energy Consumption Survey (MECS) administered by the U.S. Energy InformationAdministration in 2010.The user may override these default values by providing an estimate of the facilities actual percentages incells F24 – G35. For more accurate results, it is recommended that the user overrides the default values,even if it is with partial information. If you are not sure how much energy is used for each of the breakoutcategories, you can leave these cells blank and the default percentages will be used.
Step 4: Energy Savings OpportunitiesThe fourth and final input sheet in the PEPEx application allows users to define the potential energysavings opportunities for each system. The is done by choosing between High/Medium and Low fromthe drop down list in rows 17 – 28. A high level guideline to determine the existing potential can befound in the instructions above the table.User also have the option to use a more rigorous approach to determine energy savings potentialassociated with a system by making use of the scorecards.A high level guideline todetermine the existingpotentialScorecard sheet “unhidden” based onselectionAll systems in use at the facility defined in Step3, require a “Energy Savings opportunity level”Energy use System Scorecard (Optional)When you first arrive at the “Energy savings Opportunities” sheet, each of the scorecards will behidden by default. To “Unhide” a scorecard, click on the arrow in the right corner of thecorresponding cell and choose ”Use scorecard”. This will make the scorecard to open so thequestions can be viewed.Scorecards are not available for electrochemical processes, industrial facilities, fans and blowers, materialshandling, or materials processing.You are not required to answer all of the questions in Scorecard, although it is recommended to answer asmany questions as possible to help PEPEx more accurately profile your facility.After completing the scorecard questions, simple go back to the “Energy Savings Opportunities” tab tocontinue your data input.
ResultsThe final step in PEPEx is the results screen. The PEPEx results report has tables and graphs that show howmuch energy you are purchasing (and how much it costs), how you are consuming that energy, andpotentially how much energy and money you could save. The graphs and tables in the results page can bebroadly categorized into 5 groups listed below.I.Energy Usage Summary - Tables/ Figures 1 to 3.II.Total Energy Savings Potential – Tables/ Figures 4.III.Energy Savings Potential by Energy Source - Tables / Figures 5 to 9.
IV.Potential Emission ReductionsV.Energy Efficiency Opportunities
This tutorial explains the information you'll need to complete the profile. Understanding Tool Layout PHASTEx consist of 7 core excel worksheets. Based on its function the sheets are categorized as introduction sheets, user input sheets and result sheet. The user manually completes the input data sheets and the output . 8/5/2016 11:12:49 AM .