Transcription
Default Risk on Derivatives Exchanges:Evidence from Clearing-House DataRobert A. JonesChristophe PérignonMarch 2008AbstractIn this paper, we analyze empirically the clearing house exposure to the riskof default by a clearing house member. Using actual daily data on margins andvariation margins for all clearing members of the Chicago Mercantile Exchange’sclearing house, we identify many occurrences when the member’s daily loss exceedshis posted margin. Furthermore, we nd that the major source of default risk for aclearing member is proprietary trading and not trading by customers. In order toquantify the default risk exposure, we provide a characterization of the tail risk ofthe clearing house using Extreme Value Theory. We then design and price a realisticinsurance contract covering the loss to the clearing house from default by one orseveral clearing members. We investigate the impact on the insurance premium ofincluding data from the Black Monday of 1987 in our sample. Our empirical analysisalso allows us to put a dollar amount on the service provided by the central bank,which is the implicit insurer of the clearing house.JEL classi cation: G13, G18Keywords: Derivatives Exchanges, Clearing House, Default Risk, SystemicRiskSimon Fraser University, Vancouver, Canada.HEC Paris, France. We thank the Research Department of the Chicago Mercantile Exchange for providing us with the data. We are grateful to seminarparticipants at HEC Paris for their comments. Emails: rjones@sfu.ca (Jones), perignon@hec.fr (Pérignon).Contact Author: Christophe Pérignon, Finance and Economics Department, HEC School of Management- Paris, 1 Rue de la Libération, 78351 Jouy-en-Josas, France. Tel: (0033) 139 67 94 11, Fax: (0033) 139 6770 85.
1IntroductionDerivatives contracts, as they call for future delivery or payments, are clearly exposed to therisk of counterparty default. On organized derivatives exchanges, the central counterpartyclearing house (hereafter CCP) greatly reduces this concern by becoming counterparty toevery transaction undertaken by a clearing member (hereafter CM).1 As an intermediary,the CCP does not incur market risk but it does bear default risk (also called counterpartyrisk, or nonperformance risk) vis-a-vis their CMs. Indeed, a payment default occurs if thedaily loss of a CM’s total position exceeds his margin and he does not pay the de ciencyon time.2In this paper, we analyze empirically the default risk of CM using actual data of dailygains and losses of all the CMs of the Chicago Mercantile Exchange’s CCP. Characterizingthe probability of a default by a CM, as well as the magnitude of the resulting loss, isof great interest to many nancial market participants. First in line is the CCP since,in the event of a CM default, it will need to utilize its own resources to compensate thewinning CMs, and once resources are exhausted, it may also default. Other concernedmarket participants include the non-defaulting CMs because of the mutualization of lossesthrough loss-sharing rules. Individual investors trading through the defaulting CM can alsobe at risk since, as made clear by Jordan and Morgan (1990), they are not contractuallyprotected by the CCP – especially if the default of the CM is due to the loss of anothercustomer trading through the defaulting CM. The parent companies of the CM are alsodirectly concerned since they provide the nancial guaranty necessary to the CM to operate.Furthermore, as implicit and explicit insurers of the CCP against default, central banks(Bernanke, 1990) and insurance companies may nd the present analysis informative.Although actual defaults by a CM have remained infrequent (Examples of CCP havingexperienced a CM default are US Options Clearing Corporation in 1973, New York Mercantile Exchange, Inc. in 1976, Commodities Exchange Inc. in 1985, and US Board of1The clearing activity consists in con rming, matching, and settling all trades on an exchange. On mostderivatives exchanges, only a subset of market participants (i.e., the CMs) can directly trade with the CCPwhereas all non-CM participants have to route their trades through a designated CM. Some end-customersdeal directly with a CM (e.g. non-CM institutional investors, hedge funds) while others trade through abroker who still needs to route the trades through a CM.2Our de nition of default does not include all occurrences when a CM does not meet a margin call. Aslong as the balance of the margin account is non-negative, the position of the CM can be unwinded at nocost to the CCP and other CMs. It is only when the balance is negative - the money has already beenlost and needs to be transferred immediately to the winning party - that failing to meet a margin call isperceived as a default.1
Trade Clearing Corporation in 1992), concerns about default risk in the clearing processhave recently increased for a number of reasons. Indeed, recent years have witnessed anextraordinary expansion of the derivatives markets, which was fueled in part by the riseof the hedge fund industry. In parallel to this increase, the emergence of mega-exchangesresulting from mergers (e.g. Chicago Mercantile Exchange & Chicago Board of Trade,EURONEXT & LIFFE) leads to fewer and bigger clearing facilities. As a result, CCPsconcentrate an increasing amount of risk which raises substantial systemic risk concerns.As recently noticed by Federal Reserve Governor Kroszner (2006), CCPs are now clearingnew products, some of which being illiquid or very complex, and are frequently involvedin cross-border clearing activities. In response to this growing concern, a number of CCPshave purchased default protections from insurance companies to further strengthen their nancial safeguard package. Recent examples include the CCP of the New York MercantileExchange, Inc., the CCP of the Sydney Futures Exchange, and the Norwegian Futures andOptions Clearinghouse.3Over the years, CCPs have assembled a battery of safeguards to control their defaultrisk exposure. First, CMs are subject to nancial and capital adequacy requirements toguaranty their creditworthiness. Second, CCPs impose a system of margining which ensurethat obligations of both CM and their customers are collateralized. Both house marginaccounts and customer margin accounts are adjusted daily to re‡ect changes in the mark-tomarket value of positions. These daily aggregate gains or losses are called variation margins.If the margin account balance falls below the maintenance margin then additional marginmust be posted to bring the balance up to the required level.4 In most cases, CMs arepermitted to post a margin on the aggregate net position for their own house positions butthey are required to deposit margins with the CCP su cient to cover the gross positions oftheir customers. Furthermore, positive balances in the house account are typically pledgedto o set negative balances in the customer account, but not the reverse.The academic literature on default risk on derivatives exchanges has developed concurrently with derivatives markets. A rst strand of the literature focuses on the probability offacing a daily loss greater than the actual margin and, in turn, that additional funds mustbe raised (Figlewski, 1984; Gay, Hunter and Kolb, 1986; Knott and Polenghi, 2006) and on3In their 10K form led in September 2002 to the Security Exchange Commission, the Chicago Mercantile Exchange stated that they were in the process of obtaining default insurance. However, to ourknowledge, this has not materialized yet.4Intraday margin calls are possible in particularly volatile market conditions. Extraordinary intradaymargin calls occurred three times on October 19th, 1987, and ten more times in the remainder of October(Fenn and Kupiec, 1993).2
the expected value of additional funds that need to be raised conditional or not on additional funds being needed (Bates and Craine, 1999). Other authors have proposed modelsof optimal margin that lead to a given target probability of a loss in excess of the margin(Booth et al., 1997 and Cotter, 2001), that minimize the total cost of margin, settlement,and default costs (Fenn and Kupiec, 1993), that re‡ect the option to default on a futuresposition (Day and Lewis, 2004), or that take account of the CCP risk aversion (Cotterand Dowd, 2006). Recently, Shanker and Balakrishnan (2005) have used the frameworkof Brennan (1986) to set the optimal margin, capital, and price limits that will minimizethe cost of clearing rms and simultaneously provide protection against default risk to theCCP. Di erently, Bailey and Ng (1991) estimate the default premium in the futures pricesof precious metals and show that nonperformance risk has signi cantly a ected futuresprices during the 1979-1980 "Hunt Brothers" episode.A common feature of the aforementioned studies is that they all focus on an individualfutures position. As a result, their conclusions do not directly apply to CMs since, at anypoint in time, they maintain a portfolio of positions with complex diversi cation e ects.Indeed, a CM’s aggregate portfolio includes di erent derivatives types (e.g., futures andoptions), o setting positions (i.e. long and short), di erent underlying assets, and variousmaturities.5 Moreover, some of the positions are proprietary positions of the CM whileothers come from all the end-customers that access the derivatives exchange through thisCM.Portfolio-based margin requirements are computed in most CCPs (including the ChicagoMercantile Exchange) using the Standard Portfolio Analysis of Risk (hereafter SPAN) margining system.6 SPAN evaluates the risk of an entire account’futures/options portfolio andcomputes at the end of each trading day its aggregate margin requirement called performance bond.7 To arrive at a margin level, SPAN considers a series of scenarios representingpotential changes over a one-day horizon in the underlying security’s price and volatility.5In an early attempt to analyze the default risk of a CCP, Gemmill (1994) highlights the dramaticdiversi cation bene t from combining contracts on uncorrelated or weakly correlated assets.6The SPAN system was originally developed by the Chicago Mercantile Exchange. A smaller number ofCCPs use the Theoretical Intermarket Margining System (TIMS) developed by the US Options ClearingCorporation.7On the Chicago Mercantile Exchange, performance bond can be in cash (ten acceptable currencies),U.S. Treasuries, letters of credit, selected stocks from the S&P 500 index, selected sovereign debt, mortgagebacked securities, and several types of notes and bonds from selected nancial institutions. As of June 30,1998, the Chicago Mercantile Exchange’s CCP held a total of 3.771 billion in house margin funds and 7.949 billion in customer margin funds. U.S. Treasuries account for 89.76% of house margin funds, lettersof credit for 4.97%, and cash for 0.17%. Corresponding percentages for customer margin funds are 83.46%,12.96%, and 0.61%, respectively (source: CFTC, 1998).3
For each scenario, the value changes are aggregated across all positions and the CM’s margin requirement for the day is set to the maximum aggregate loss across all scenarios.8 Theempirical performance of SPAN has been tested by Kupiec (1994) for selected portfolios ofS&P 500 futures and futures-options contracts. He nds that, over the period 1988-1992,the historical margin coverages exceed 99% for most considered portfolios. Furthermore,Kupiec and White (1996) nd that SPAN provides similar risk protection than the alternative margining system, "Reg T", but with substantially smaller collateral requirements.9The present study is the rst one to analyze the default risk of CMs using actual dailyperformance bonds and variation margins. Our dataset includes the performance bondsand variation margins for all CMs of the Chicago Mercantile Exchange’s CCP over theperiod January 4th, 1999 - December 31st, 2001. Chicago Mercantile Exchange is thelargest and most diverse nancial exchange in the world for trading futures and options.We conduct an in-depth statistical analysis of the performance bonds (B 0), variationmargins (V 0 corresponds to a gain for the CM and V 0 corresponds to a loss), and oftheir ratio V B, i.e., the relative pro t-and-loss. We are particularly interested in the lefttail of the distribution of the V B ratio since a ratio smaller than -1 indicates a situation inwhich the CM has an incentive to default. Over our three-year sample period, we identify68 occurrences when the daily loss in the house account exceeds the posted margin. Almostone third of our sample CMs have experienced a margin-exceeding loss and in one case theloss was as high as 173% of the posted margin. We also nd that the value of the V Bratio seems to be independent of the size of the performance bond. Furthermore, marginexceeding losses are much less frequent on the customer side, with only four occurrences intotal. As a result, the major source of default risk for a CM is proprietary trading.In this paper, not only we quantify the default risk but we also show how this risk canbe hedged through the purchase of a default insurance. We design and price a realisticinsurance contract covering the loss to the CCP from default by one or several CMs. Theinsurance policy is based on the accumulated default losses over a T -year insured period,subject to both a policy deductible and an overall payout limit. Valuation proceeds intwo steps. First, we empirically model the left tail of the V B ratio using a generalizedPareto distribution. Second, the actuarial insurance premium is determined by Monte8The SPAN lets each CCP determine the minimum margin for each contract, the volatility range ofeach underlying asset, the de nition of an extreme move in the value of the underlying asset, as well asthe diversi cation e ect between futures with di erent maturities or between futures written on di erentunderlying assets (see CFTC, 2001 for more details).9Kupiec (1994) and Kupiec and White (1994) do not use actual historical SPAN margins but hypothetical margins generated using a model that mimics the SPAN system.4
Carlo simulations of the joint default process and payout under the policy. Furthermore,we investigate the e ect on the fair value of the premium of including data from October19th, 1987 in our sample. We nd that including the Black Monday dramatically impactsthe fair value of the default insurance premium.Our approach drastically di ers from previous attempts to compute the fair value ofan insurance against losses from futures trading. Bates and Craine (1999) compute thedaily premium on an insurance policy that would cover the loss induced by a futuresprice change exceeding the margin. Using an option pricing approach, they estimate theinsurance premium around the October 1987 crash. A key di erence between the Batesand Craine’s analysis and ours is that they consider a hypothetical insurance on a singlefutures contract on the S&P 500 index. Gemmill (1994) assesses the cost of default of astylized CCP assumed to clear three generic futures contracts –soft commodity, metal, and nancial – and to collect 50 million of margin from each market. He considers di erentlevels of default cost and, as acknowledged by the author (on page 991), assigns "highlysubjective" default probabilities. Under the assumed default scheduled, Gemmill estimatesa rough estimate for the premium of an insurance covering against a default by the CCP.Contrary to previous research, we use actual data on CM’s portfolios to price a realisticinsurance policy covering the loss due to the default of one or several CMs.We claim that there is a clear analogy between the premium of the default insuranceand the fair cost of the guarantee provided by the central bank. Indeed, just like a standardinsurance company, the Federal Reserve (or U.S. Federal Treasury) may have to compensatethe CCP in the event of a default by one or several CMs in order to prevent a breakdownof the nancial system. As Bernanke (1990) puts it "the Fed became the insurer of lastresort" during past episodes of extreme volatility, such as October 1987. For the FederalReserve, the deductible corresponds to any guarantee fund held by the CCP. As a result,our study permits to put a dollar amount on the service provided by the central bank,which is the implicit insurer of the clearing house. This is ultimately the cost to the taxpayer of the implicit protection of the clearing house.Although the focus of the current paper is on organized derivatives exchanges, our analytic tools can be applied to clearing companies on the over-the-counter (hereafter OTC)market. Indeed, a growing fraction of OTC products are cleared through one of the threemain clearing processes. First, some OTC products are converted into equivalent exchangetraded contracts and cleared on derivatives exchanges CCPs.10 Second, SwapClear, a CCP10For instance, Clearing 360, an exchange service o ered by the Chicago Mercantile Exchange since5
for OTC interest rate swaps, clears approximately 40% of the global inter-dealer marketfor interest rate swaps (as of December 2006, Bank for International Settlements, 2007).SwapClear exhibits most of the features of a derivatives exchange CCP, e.g., CMs, regulatory capital and minimum credit rating for CMs, and parent rms. Third, OTC derivativesprime brokers operate very much like CCPs since they clear and settle the trades of a smallnumber (around 30) of large buy-side investors, typically hedge funds. For each transaction, the prime broker interposes itself between the hedge fund and the other party. As aresult, a prime broker is a de facto CCP which is exposed to the risk of default by a largeend-user.The outline of the paper is as follows. In the next section, we present our data andanalyze the risk properties of the performance bonds and margin variations for house andcustomer accounts. We pay special attention to the (left) tail behavior of the variationmargin - performance bond ratio. In Section 3, we describe the default insurance contractand implement our valuation strategy. We summarize and conclude our study in Section4.22.1Risk AnalysisData and Preliminary ResultsOur empirical analysis is based on daily performance bond requirements (B) and dailyvariation margins (V ) for all the CMs of the Chicago Mercantile Exchange’s CCP. Theperformance bonds are computed at the end of each trading day by the SPAN marginingsystem and the variation margins simply re‡ect daily mark-to-market gains or losses. Thesample period covers the period January 4th, 1999 - December 31st, 2001, which includesseveral prominent episodes such as the burst of the internet bubble and the terrorist attackof September 11th, 2001. For each of our 71 sample CMs, amounts are separated betweenhouse accounts, BH and VH , and customer accounts, BC and VC . This partition of thedataset between proprietary and customer trading re‡ects the principle of strict segregationof customer funds in place in most CCPs. In our dataset, 60 CMs have both a house anda customer accounts, nine only have a house account, and two manage a customer accountApril 2006, takes a bilaterally negotiated OTC swap trade and converts it into a strip of futures contracts,which are then submitted to Chicago Mercantile Exchange for clearing. Similar OTC clearing services areprovided by Bclear (Euronext.Li e), OTC Trade Entry Facility (Eurex), Converge (Canadian DerivativesClearing Corporation), and Clearport (New York Mercantile Exchange).6
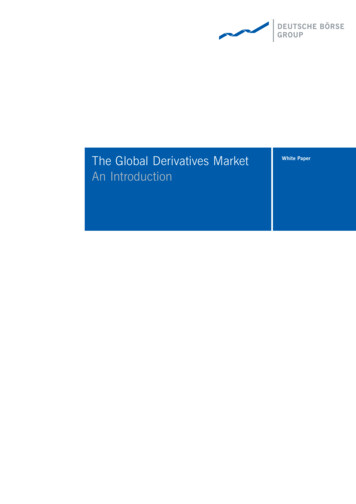
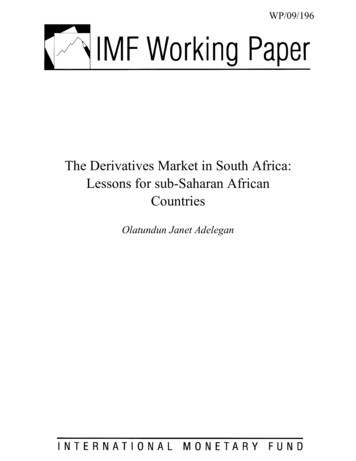
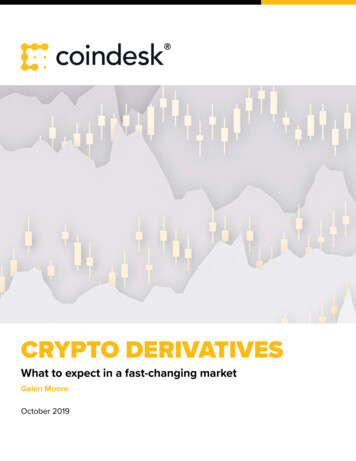
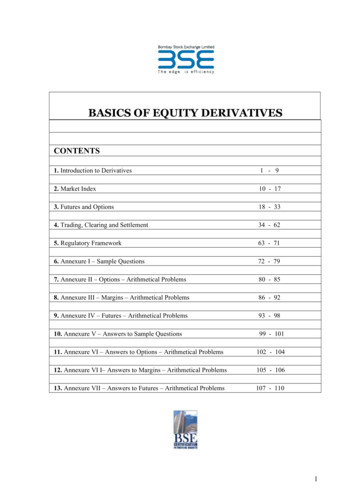
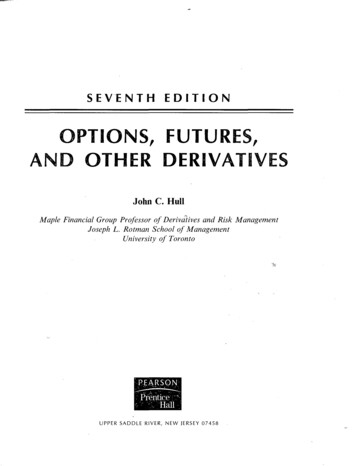
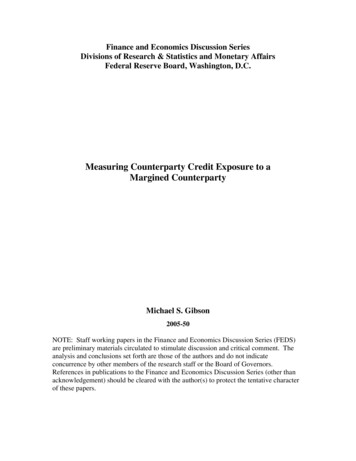
only. The total sample size is 43,236 member/day observations for house accounts and41,013 member/day observations for customer accounts.We plot in Figure 1 the cumulative performance bond across all CMs averaged over eachmonth. We see that both house account and customer account margins have experienceda positive trend until the third quarter of 2001. Another interesting feature of the datais the higher magnitude of the customer margins (i.e., cumulative BC around 15 billiondollars per day) compared to house margins (i.e., cumulative BH around 6 billion dollarsper day). This di erence between the magnitude of house and customer accounts is due inpart to the gross margining regime under which customer accounts are administered. Wedisplay in Figure 2 the daily variation margins for house and customer accounts. We noticea clear change in the volatility of the variation margins between the rst and second partof our sample period. Our preliminary analysis seems to indicate that the distribution ofthe performance bonds and variation margins are not stationary through time.Since we are interested in potential default by a CM, we need to compare, on each day,the performance bond with the variation margin of each CM.11 In particular, a situationwhere BH VH 0 is problematic since the CM may decide to default instead of payingthe de ciency. In our analysis, we favor an alternative, however equivalent, expression thatis the ratio of the variation margin and performance bond. In this case, default may occurif VH BH 1 or VC BC 1.12 We plot in Figure 3 the time-series of the ratio of thevariation margin and performance bond for each type of accounts. This variable indicatesthe fraction of the margin that is won or lost by a CM on a given day. Contrasting the V Bratio for house and customer accounts turns to be very informative as this ratio is muchmore volatile for house accounts than it is for customer accounts. In our sample, thereare 68 occurrences when the daily loss on the house account exceeds the posted marginwhereas the corresponding number for customer accounts is four. The most severe eventcorresponds to a loss on proprietary trading that amounts to 173% of the posted margin.In dollar terms, the most severe daily loss (among these 68 occurrences) amounts around44 million dollars. Interestingly, underwater accounts do not only a ect a handful of CMsexhibiting extreme risk appetite as almost one third of our sample CMs have experienced11More precisely, we contrast the performance bond set at the end of a given trading day, Btend , withthe variation margin computed over the following trading day, Vt 1 . In the following, we will drop thetime index for simplicity. Note that Vt 1 often di ers from Bt 1end Btend since both CM’s positions andmarket volatility vary from one day to the next.12A V/B ratio smaller than 1 is a necessary condition for defaulting but not a su cient one. Reasonsfor not defaulting include the bene t of reduced clearing fee rate, reduced collateral cost (i.e., net marginingsystem), membership value, present value of future rents, and reputation e ect for parent companies.7
at least one margin-exceeding loss.We complement our visual inspection of the data with some descriptive statistics inTable 1. For each type of account (house vs. customer), we consider four variables ofinterest, namely the performance bond, the variation margin, as well as the level and theabsolute value of the V B ratio. We see that the average house performance bond is just shyof the 100 million mark and that the average customer performance bond is almost threetimes larger. Comparing average V across types of accounts reveals that proprietary tradingis on average more pro table than trading by customers, which is consistent with previousstudies comparing the performance of various investor types (Grinblatt and Keloharju,2000, and Frazzini and Lamont, 2007).13 Although the average and median values of theV B ratio are zero, the absolute value ratio is, on a typical day, around 15% for houseaccounts and 7% for customer accounts. In dollar terms, that amounts to 900 milliondollars ( 0:150 6 billion) for house accounts and 1.11 billion dollars ( 0:074 15billion) for customer accounts. On a technical note, we notice that the B and V variablesare much more skewed (especially BH and BC ) and exhibit fatter tails (especially VH andVC ) than the V B ratios.In the three lower panels of Table 1, we split the three-year sample period into threeequal-sized subperiods. Consistent with our analysis of Figures 1 and 2, we nd that theaverage margin account has been growing through time and that the distributions of thevariation margins are pathologically non-stationary. Di erently, the rst four momentsof the V B ratio are remarkably stable across subperiods. Of particular interest is thevery low correlation between the V B ratio and the level of the performance bond, i.e.,0.003 for house accounts and less than 0.001 for customer accounts. Furthermore, thiscorrelation coe cient has never exceeded 1:3% or gone below 1:3% on a given sampleyear using either house or customer data. This modest in-sample correlation points towardlinear independence between the V B ratio and the margin account size, which is a veryimportant property if one wants to aggregate data across CMs.In Table 2, we present similar descriptive statistics by account size quantile. Speci cally,the rst (respectively fourth) quantile considers the 25% smallest (respectively largest)daily performance bonds. Consistent with this partition rule, the average performance13We cannot infer the CM’s overall pro t/loss from house accounts since much of the trading activity isarbitraging between the futures and over-the-counter markets or cash markets (e.g., cash-futures arbitrageof the S&P 500 index, eurodollar-interest rate swap arbitrage). Thus a negative V might be matched bypositive mark-to-market gains elsewhere.8
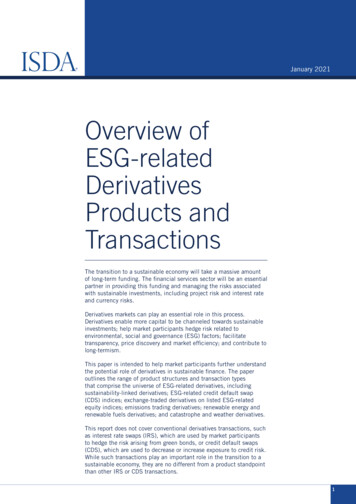
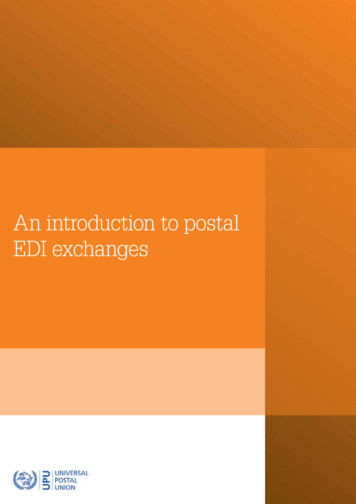
bond grows exponentially from Panel A (smallest accounts) to Panel D (largest accounts).We note that the distribution of the V B variable remains stable across size quantiles andthat the correlation between V B and B is always close to zero.In the following sections, we are going to focus our analysis on the V B ratio ratherthan on their sum, or on any of their component in isolation. We follow this strategy forthe following reasons. First, the V B ratio allows us to e ciently combine the informationabout variation margins and performance bonds (no loss of information) in a compact way.Second, the distribution of V B is much more stable through time and across size quantilesthan the distribution of B or V . Third, the very low correlation between V B and B allowsus to aggregate information across CMs without dramatically skewing the data because ofaccount size di erences.The nal step of our explanatory analysis of the data is constructing an histogram of theV B variable. Consistent with our previous results, we note in Table 3 the higher variabilityof the V B ratio for proprietary trading than for trading from customers. For instance,76.2% (respectively 48.62%) of the time VC BC (respectively VH BH ) remains within the]-0.1;0.1] range. Another key statistical di erence between house and customer accounts isthe thickness of the tails of the distribution of V B. In our house accounts sample, 1 out of185 observations lies in the extreme left tail (de ned as relative losses exceeding 70% of theperformance bond, i.e., V B 0:7) whereas the corresponding frequency is only 1 out of1,250 observations for customer accounts. With 60 CMs, this implies one extreme (but notrare) event a ecting a house account every three days (' 185 60). We also notice that,on average, observations in the tails of the distribution tend to be associated with smallerperformance bond. However, as suggested by the maximum values, some sizable accountsalso end up far in the tails of the distributions. We speci cally analyze the extreme left tailof the distribution in Figure 4. We clearly see that V B is much more negatively skewedfor house accounts than it is for customer accounts. This result further supports the ideathat the main source of default risk is proprietary trading and not trading by customers.2.2Tail BehaviorModelling defaults in a derivatives exchange calls for a characterization of the far end ofthe left tail of the V B distribution. To do so, we deviate from the standard approach instatistics that is to t the entire distribution with a given distribution. The intuition is thatdata in the bulk or in the right tail of the distribution do not help much, and sometimes9
hurt, in characterizing the left tail of the distribution. Instead, we follow an extreme valueapproach in which only observations with losses exceeding a pre-speci ed threshold areused.14The result we use is a theorem of Balkema and de Haan (1974) and Pickands (1975) thatstates that under moderately general conditions the distribution of the excess z Xofa random variable X over a high threshold , conditional on the threshold being exceeded,converges to the generalized Pareto distribution G. This distribution depends on twoparameters: a scale parameter and a tail shape parameter k, which both can be estimatedby maximum likelihood (see Appendix for details). Its cumulative distribution function is:G(z; ; k) (11(1 kz )1 k k 6 0:e z k 0(1)For k 0, the above applies for 0 z k, with G 1 for z k and G 0 for z 0(i.e., the range of z is bounded). The case k 0 will occurs if sampling is from normal,lognormal and several other common distributions. The case k 0 occurs if sampling fromfatter tailed distributions. Di erentiating G with respect to z gives the probability densityfunction:1(2)g(z; ; k) (1 kz ) 1 1 kin the relevant domain. Note that in what follows, exceedance is interpreted as amount bywhich V B falls below .The choice of the threshold is a crucial step in characterizing the tail of the distribution. In general it should be set large enough that the data exceeding it is clearly in therelevant tail of the distribution, but small enough that the remaining sample is adequate forestimating the remaining parameters. In our test, we perform estimation for a range of ’sfrom 0:7 to 0:9. This corresponds to daily losses ranging from
1998, the Chicago Mercantile Exchange s CCP held a total of 3.771 billion in house margin funds and 7.949 billion in customer margin funds. U.S. Treasuries account for 89.76% of house margin funds, letters of credit for 4.97%, and cash for 0.17%. Corresponding percentages for customer margin funds are 83.46%,