Transcription
May 2007T h e M o n t h l y N e w s l e t t e r o f t h e M a r k e t Te c h n i c i a n s A s s o c i a t i o n , I n c . F o r O v e r 3 0 Ye a r sTechnical Analysis of StockTrends, Ninth EditionBy Robert D. Edwards, John Magee andW. H. C. BassettiReviewed by Mike Carr, CMTIf Edwards and Mageewrote the bible of technicalanalysis in 1948 when theyfirst published “TechnicalAnalysis of Stock Trends,”then why do we need aNinth Edition of theirclassic? This question wasforemost in my mind as Ibegan reading this recentlyreleased version of a bookI spent many hours withas I prepared for the CMTexams. After reading all832 pages, I realized that in many ways, the financialmarkets, and technical analysis, are finally maturingto the point where we can fully grasp the significanceof what was first written almost sixty years ago. Witha focus on pragmatic portfolio theory, editor CharlesBassetti significantly contributes to the technicalanalysis body of knowledge especially related totactics, and has created a book worth a space on everytechnician’s bookshelf.In this edition, Bassetti delivers much more thanan update – it’s actually a new book. He focuses onstrategies for increasing profits: The basics of traditional chart analysis areclearly presented, just as Robert Edwardsmeant for them to be. In keeping with thepractice of earlier editions, Bassetti retains theoriginal charts showing examples of patternsfrom the 1940s and earlier. He also includesmore than two dozen new charts,demonstrating that the same old patterns stillwork today. The detailed discussion of themarket psychology that forms these patternsmay stimulate modern analysts to program thepatterns. Adds a comprehensive explanation of Magee’s“basing points” procedure for setting initial andtrailing stops on any position. Bassetti adds achapter and charts to clarify this powerfulconcept, which in itself is worth morethan the cost of the book. For what may be the first time, Bassettiprovides an annotated chart of the Dow,combining an in-depth discussion ofDow Theory with a visual history of thesignals. We’ve all seen tables showing thesell signal in Oct 1929 or the buy signalin late-1990 which lasted more than sevenyears, but the chart erases any doubt thatDow Theory is a valuable timing tool.Creating a comprehensive source on theDow Theory, he also includes anoverview of Robert Colby’s method toautomate the signals. Provides a link to www.edwards-magee.com, which offers downloadable materialthat supplements the text. As oneexample, readers can download pdf filesof the Dow Theory signals for closerexamination. Offers new perspectives on short-termand futures trading. The extensive newmaterial on commodity trading, includinga complete trading plan, was notaddressed in previous editions.Bassetti also ensures the reader understandsthe similarities between Magee’s SensitivityIndex and Modern Portfolio Theory’s Beta; andthe striking resemblance of Magee’s CompositeLeverage to the financial engineering concept ofValue at Risk. Readers of previous editions maynot have realized that Magee developed theseconcepts decades before Nobel Prize-winningwork was undertaken in these areas. Mageewrote in the language of the trader (semi-logcharts), rather than the academician and his ideashave been overlooked by economic theorists.examples – current at the time of publication. Theywrote with clarity and ease of style not usuallyfound in textbooks. Their text was a practical “howto” manual that explained the “study of the actionof the market itself” in concrete terms. It appealedto those seeking the Holy Grail on Wall Street, andto those serious students of the markets seeking anedge. In this new edition, Bassetti retains all of theirstyle and introduces his own, which in all ways issimilar to the original, but with a modern edge.Some question whether classical chart readingis still a valid discipline in an era defined by cheapdata, powerful scanning and backtesting software,instantaneous execution and quantitative analysis.After reading this book, you’ll be left with a deeperappreciation of the value of chart reading and willbecome an even stronger proponent of technicalanalysis in modern markets.About the authors:Robert D. Edwards and John Magee wrotethe original edition of Technical Analysis ofStock Trends. Magee is considered the “father oftechnical analysis,” while Edwards was a pioneerin pattern formation and trend analysis. W. H.Charles Bassetti is Adjunct Professor of Financeand Economics at Golden Gate University and aformer executive in the options and commoditiestrading industries. He was both a student and clientof John Magee.Technical Analysis of Stock Trends, NinthEdition; 2007; ISBN: 0-8144-0864-8; AMACOMBooks, NYC; 832 pages; 99.95.W H AT ’ S I N S I D E“What’s Hot” MTA Library Announces 2A classic book is one that stands the test oftime. No one can argue that Technical Analysisof Stock Trends fails in this regard. Patternsthat worked a hundred years ago are still foundin financial markets and they still work. Theforecasting ability of patterns lies in their abilityto document the history of human nature, whichremains unchanged over many centuries.Another feature of classic works is a uniquestyle. Edwards and Magee filled their work withMTA Annual Education Seminar 3John Magee 4W.H.C. Bassetti 5Meet The MTA Staff 6How They Do It - William O’Donnell 6
Te c h n i c a l l ywww.mta.orgS p e a k i n gFrom the Executive’s DeskMarket Technicians Association, Inc.61 Broadway Suite 514New York, NY 10006Phone: 646/652-3300Fax: 646/652-3322E-mail: info@mta.orgTechnically Speaking EditorMichael Carr, CMTeditor@mta.orgTechnically Speaking Associate EditorLawrence KlameckiMTA Office E-mail DirectoryInquiries DirectoryGeneral QuestionsMembership InformationCMT InformationTechnically SpeakingJournal of Technical AnalysisCharles Dow a.orgjournal@mta.orgdowaward@mta.orgPeople DirectoryPhilip Roth, CMTTom SilveriElliott CaponJeanne FarrellyTim LicitraMarie PenzaCassandra a.orgThe spring CMTexamination “window”is from April 25 - May5, 2007. The entire MTAStaff would like to wishall of the CMT Exam testtakers the best of luck.Tom SilveriDuring this tough andstressful time, feel free tocontact us with any questions or concerns.This month we have a very special event, theAnnual Education Seminar. Being held in NewYork City from May 18th-19th, we have someof the finest technicians presenting on a widearray of topics. We strongly urge our membership to try and attend, especially those in the NYarea. I would also like to thank our sponsors,TradeStation, ProShares, Fidelity, Bloomberg,and eSignal for contributing to what is shapingup to be a sensational event.I would also like to thank those of you whohave mailed back your proxy cards for the Boardvote. For those of you that have not done so,please try and have your proxy mailed to us byMay 17th. Your input is important to the MTA!The voting proxy cards will be counted at theMTA’s Annual Meeting, held on May 20th,at 10:15 AM EST. All of you are invited toattend this meeting, and to join us at the MTAHeadquarters for an open house and breakfastearlier that morning (9:00 AM - 10:15 AM).I look forward to the opportunity to seeingyou at these two important MTA events.Sincerely,Tom SilveriMTA Executive DirectorAdvertisingIf you are interested in advertising in theMTA’s monthly newsletter or journal, you canfind a listing of our advertising rates on ourwebsite.Please e-mail Tim Licitra at: Tim@mta.orgif you wish to submit an advertisement or haveany questions.Submitting an ArticleIf you are interested in submitting an articlein the MTA’s monthly newsletter, please e-mailthe editor Michael Carr, CMT at: editor@mta.orgIf you have any questions about Technically Speaking please contact Tim Licitra at:tim@mta.org“What’s Hot”The MTA Library Announces.Professionals Managing Market RiskIncorporated 1973This newsletter is produced by the Market Technicians Association,Inc., 61 Broadway, Suite 514, New York, NY 10006. All commentsand editorial material do not necessarily reflect the organization’sopinion nor does it constitute an endorsement by the Market Technicians Association, Inc., or any of its officers, of products or servicesmentioned. Sources are believed to be reliable at time of publication,but not guaranteed. The Market Technicians Association, Inc., and itsofficers, assume no responsibility for errors or omissions. Copyright 2007 Market Technicians Association, Inc. All rights are reserved.2The MTA Library would like to announce that the following books have been addedto our Library. Go to our website at www.mta.org and visit our Library to check out yourcopy today. “FOREX Trading using Intermarket Analysis” by Louis B. Mendelsohn “Support & Resistance Simplified” by Michael C. Thomsett “The Point & Figure Method” by Victor de Villers and Owen Taylor “Hedge Hogging”” by Barton BiggsMay 2007
Te c h n i c a l l yS p e a k i n gwww.mta.orgMTA Annual Education Seminar 2007New York City, May 18-19Sign Up NowFriday, May 18th8:30 - 9:00AM:9:15 - 10:15AM:10:30 - 11:30AM:11:30 - 12:00PM:12:00 - 1:15PM:1:30 - 2:30PM:2:30 - 3:30PM:3:30 - 4:00PM:4:00 - 5:00PM:5:00 - 6:00PM:Tom Silveri, (MTA Executive Director), “State of the MTA - An Update”Jeffrey Weiss, CMT, (Jesup & Lamont)Frank L. Teixeira, CFA, CMT (Wellington Management)Meet and GreetMTA Market Forecast Panel Luncheon: Featuring, Ralph Acampora, CMT (Knight Equity Markets); Mary Anne Bartels(Merrill Lynch); Jeffrey deGraaf, CMT (ISI Group); and John Roque (Natexis Bleichroeder)Rick Bensignor, (Morgan Stanley)Mary Ann Bartels, (Merrill Lynch)Snack BreakJohn Murphy, CMT, (stockcharts.com)Cocktails and MTA Reception Sponsored by FidelitySaturday, May 19th: Advanced Track9:00 - 10:00AM:10:00 - 11:00AM:11:00 - 12:00PM:12:00 - 1:15PM:1:30 - 2:30PM:2:30 - 3:30PM:3:30 - 4:30PM:Veronique Lashinski, (Fimat USA)David Aronson, CMTJeffrey Parent, (Research Capital Corporation)Luncheon Presentation: The 2007 MTA Annual Award and MTA Recognition AwardCharles H. Dow Award PresentationMarc Leigh Sutin (Knight Equity Markets)Stephen Todd (The Todd Market Forecast)Saturday, May 19th: CMT Institute Track8:30 - 9:30AM:9:45 - 10:45AM:11:00 - 12:00PM:12:00 - 1:15PM:1:30 - 2:30PM:2:45 - 3:45PM:4:00 - 5:00PM:AcamporaBartelsSetting the Stage: Technical Analysis Assumptions, Sentiment Measures, and BiasTrends and Moving Averages, Ranges and BreakoutsUsing Envelopes, Channels and BandsLuncheon Presentation: The 2007 MTA Annual Award and MTA Recognition AwardMomentum, Volume, and Open InterestMeasuring Equity Markets: A/D Line, Breadth, Arms IndexShort-term Patterns and CandlesticksBensignorPlatinum SponsorsdeGraafLashinskiParentMurphyGold SponsorsMay 2007SutinTeixeiraToddWeissOther Industry Sponsors3
www.mta.orgTe c h n i c a l l yS p e a k i n gJOHN MAGEEBy George A. Schade, Jr., CMTThis article was originally published in“Technically Speaking” in April 2005 and isbeing reprinted this month as part of our focus onEdwards & Magee.John Magee is one of the most well knownnames in the field of technical analysis and isviewed as the leading authority on classicalcharting. All chart readers know the phrase“Edwards and Magee,” and John Magee isrightfully famous as the coauthor of TechnicalAnalysis of Stock Trends, originally published in1948.Magee graduated from MIT in 1923 and workedin a variety of sales and marketing jobs, includinga position as a Fuller Brush salesman, until hemet Robert D. Edwards in 1942. Edwards was thebrother-in-law of Richard W. Schabacker, a Forbesfinancial editor in the 1920’s and later a New YorkTimes financial columnist. When Schabackerdied in 1935, Edwards took over Schabacker’spapers and the operation of the SchabackerInstitute. In 1941, Edwards moved to Springfield,Massachusetts, where Magee joined him the nextyear.Schabacker was the first to apply chartingmethods to individual stocks and not just themarket indexes. Schabacker was Edwards’ andMagee’s intellectual mentor. Between 1930 and1934, Schabacker had written three books. The1930 classic, Stock Market Theory and Practice, devoted 250 out of nearly 800 pages tocharting. The book was so highly regarded thatGraham and Dodd in their 1934 Security Analysisreferred readers to Schabacker’s 1930 book for anexplanation of charting, even though they saw novalue in “chart reading.”4Robert Edwardsstock on the NYSE and AMEX. He said, “Chartsare the working tools of the technical analyst.” But,he understood the limits of his craft, “A chart isnot a perfect tool. It does not give all the answersquickly, easily and positively.” His understandingof the imperfect nature of charting could haveresulted from his personal trading experience:“Frankly, I haven’t done as well with my owninvestments, over the long haul, as I have with myrecommendations to clients, but that’s because ofa shaky beginning.”In the early 1940’s, he had lost 25,000 in themarket.Magee’s work focused on four basic and usefultypes of chart analysis:1. Area patterns or formations of pricefluctuations that indicate consolidation ofstrength or an impending reversal of theprice trend. Formations give “get in” and“get out” signals.2. Trend and trendline studies whichsupplement analysis of area patterns orformations because stock prices tend tomove in trends and once established, trendscontinue in force.John MageeEdwards and Magee added to Schabacker’smaterials and greatly expanded that work,leading to the 1948 book, today recognized as thedefinitive book on charting. Edwards’ andMagee’s book has two parts. Part I, TechnicalTheory, is based on Schabacker’s charting work,but Part II, Trading Tactics, is based on Magee’sstudies and personal trading experience. Part I isEdwards’ work. Part II is truly Magee’s work. Thispartnership lasted less than a decade beforeEdwards left in 1951 to become a high schoolscience teacher in South Carolina.Magee maintained daily charts on almost everyMay 20073. Support and resistance levels which showwhere a move is likely to slow down orend.4. Broad market studies such as DowTheory.Magee defined technical analysis as follows:“Technical analysis is the science ofrecording, usually in graphic form, the actualhistory of trading (price changes, volume oftransactions, etc.) in a certain stock or in thecontinued on page 5
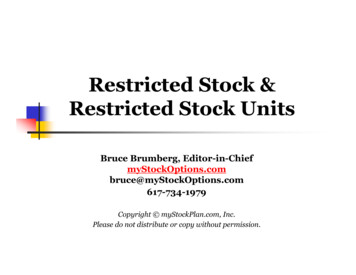
Te c h n i c a l l yJohn Mageecontinued from page 4averages and then deducting from that picturehistory the probable future trend .[t]he real valueof a share of [a stock] is determined at any giventime solely, definitely and inexorably by supplyand demand, which are accurately reflected in thetransactions consummated on the floor of the NewYork Stock Exchange.”In Magee’s opinion, supply and demand, andnothing else, moved the market. His philosophywas, “I will not be swayed or panicked by newsflashes, rumors, tips or well-meant advice.” In1958, Magee told market historian John Brooks:“Before I came to work here, I was on myown, making my charts and operating in themarket out of an office where I had nothing buta table, a chair, a telephone, a ticker and an airconditioning machine. I sealed up the windowswith boards and putty, so there would be nooutside sights and sounds to distract me. I had nofundamental information at my disposal whatever,which left me free to make up my mind solely onthe basis of my charts.”He felt that the successful analyst should beconcerned with interpreting supply and demand,as shown in these two insightful quotes: “The technical analyst’s task is to interpretthe action of the market - the flux in supplyand demand mirrored in the market. In thiswork, it doesn’t in the least matter whatcreates the supply and demand. The fact oftheir existence and the balance betweenthem are all that count.” “What does this action really mean in termsof supply and demand?”Magee had a wall sign which read: “MY MINDIS MADE UP. DON’T CONFUSE ME WITH THEFACTS.” The facts were the “daily outpouring” offinancial news and announcements. Except for thedaily quotes, he only read two-week old Wall StreetJournals. When TV arrived, his motto became, “WeFollow the Tape Not the Tube.”In later editions of his books, Magee pointed outthat “the inherent nature of a competitive marketdoes not change very much over the years, and that‘the same old patterns’ of human behavior continueto produce much the same types of market trendsand fluctuations.”Magee enjoyed writing and teaching. Hewrote two other books, The General Semanticsof Wall Street and Wall Street - Main Street - AndYou. These books presented his market wisdomin a lighter, but educational, writing style. As forteaching, for eight years, Magee taught aninvestment course in the Springfieldadult-education program titled “The Semantics ofWall Street.”In December 1984, Magee attended the MTA’smonthly meeting.S p e a k i n gMagee’s contributions to the study of technicalanalysis were formally recognized by the MTAin 1978 when he was named the recipient of theprestigious Annual Award. He died in 1987, at theage of 86.This article is based upon research done byGeorge A. Schade, Jr., CMT. He can be reachedat aljschade@aol.comW. H. C. Bassettiwww.mta.orgloss points, since pattern failure points are easilyidentified.In early April, the charts of the US stock marketwere bullish. The market had easily overcomewhat Charles termed the “China Syndrome” at theend of February and were moving higher. Chartsreflect fundamentals, and he thinks many marketanalysts are ignoring the solid fundamentals inthe economy, noting that in addition to normalspending, the US government has been spending anadditional 10 billion per month to support the waron terror. At that time, stocks were trading belowthe highs of earlier this year, and above their lows- a breakout from that range would determine hisnext directional bias.By Mike Carr, CMTBefore reading the ninth edition of TechnicalAnalysis of Stock Trends, I asked myself what typeof person would take on the task of updating thebible of technical analysis? This daunting task wasaccepted by Charles Bassetti, a highly qualifiedtechnician who considered it an honor when thepublisher asked him if he would update the workof his mentor and friend, John Magee.Charles began trading in 1960. In his ownwords, he did ‘some stupid things’ in the market,before a colleague introduced him to the workof Edwards and Magee. By 1963, he became ofa client of Magee’s advisory service, and wasfortunate enough to be able to spend many hoursdiscussing chart patterns and trading tactics withMagee. Charles benefited from the expertise ofMagee even after Magee retired in the late 1970s,as their friendship continued until Magee’s deathin 1987.As a professional, Charles began tradingcommodity futures with computerized systemsin 1972 and has worked with many of thelargest firms in the industry. As President of OptionsResearch Inc., Charles had the opportunity to workwith Market Wizard Blair Hull. ORI was the firstcompany to computerize the analysis of optionsand futures. In 1997, he began editing the secondedition of Magee’s book, General Semantics ofWall Street for John Magee Inc. He was the editor/reviser/coauthor of the eighth edition of Edwards& Magee’s Technical Analysis of Stock Trends andnow the ninth edition. Charles was an instructorin the Finance Department at the University ofCalifornia Berkeley Extension School from 19962001, teaching Technical Analysis and Value atRisk analysis. Since 1999, he has also taughttechnical analysis as an Adjunct Professor ofFinance and Economics at Golden GateUniversity.When approaching the markets, Charlesfollows the charts and trades the markets, not hisopinion. He has seen that mechanical systems canbe very effective, but they can also “grind capital tohamburger.” Charts provide him with well-definedbuy and sell signals, or they tell him to do nothingand wait for a clear signal. As a skilled chart reader,each signal is always accompanied by clear stopMay 2007Charles believes that Magee’s concept ofbasing points is worth a great deal ofadditional study. This is one of the most significantcontributions he makes to the new edition,updating this section in the tactics to ensure that alltraders understand this method of stop placement.His example is clear, and the reader can instantlyimplement this technique, which Charles thinks ofas one of the most valuable in the book.Author Charles Bassetti demonstrating thedanger of betting against a bull market.At this time, he is completing an ebook onbasing points, which he calls Stair Stops andwhich should be available on his web site, www.edwards-magee.com/stairstops.html. He willthen add material to that work and publish it as atraditional book, confident that traders willappreciate how much this concept can add to theirprofits. He is also working on a book, Zen Simple:Beat the Market with a Ruler which should bepublished this summer.Readers of Technically Speaking can receive thebook free with a six-month subscription to Charles’newsletter which provides current examples of thepatterns described in the book. Details of this offerare at www.edwards-magee.com.5
www.mta.orgMeet the MTA StaffWhen you call the MTAHeadquarters in New YorkCity, chances are the firstperson who will answer thephone is Cassandra Townes.Cassandra joined us inJanuary 2003, and,along with handling ourreceptionist and office services matters, sheis primarily responsible for the following keyfunctions:Cassandra assists our Affiliates with theimportant accreditation process to become afull time Member of the MTA. As part of thatprocess she directs applicants to the requiredapplication documents, assists in the gatheringof required sponsorship recommendations andassists our Admissions Committee and theBoard in the administration of this process.She is also responsible for fulfilling allrequests for the MTA products, whether quizcards, practice exams or our collection ofDVDs. All materials are shipped immediatelyupon request.Cassandra is responsible for the oversightof the MTA library (now over 4,000 books intotal) which includes the cataloging of all bookspurchased/donated, and the fulfilling of allbooks ordered by our Members and Affiliates.Cassandra views the library as her own, andprotects it as if they were her children, whichis a good thing for us all.If you have any questions regarding theaccreditation process, our library assets, or ourproducts/services, please fee free to contactCassandra. She can be reached at 646-6523300 or by e-mail at Cassandra@mta.org.ExcelTradingModels.comOnline Courses and Tools toModel, Analyze, and Trade themarkets using Excel.Institutional and groupdiscounts available! ContactSales@ExcelTradingModels.com6Te c h n i c a l l yS p e a k i n gHOW THEY DO ITWILLIAM O’DONNELLTechnical AnalystUBS US Interest Rates Strategy GroupBy Molly SchillingUBS built their USA Headquarters inStamford, Connecticut – just 45 minutes bytrain out of New York City. The architecture isstunning – a contemporary design with huge 5 storywindows across the façade of the building, and aninterior stairscape that leads up to the fifth storyall in one sweep – landings on each floor. Abovethe fifth story of executive offices, you come up (byelevator and through intense security) to what lookslike an airplane hanger of wide open space witha four-story high ceiling complex of beautifullyinterwoven lighting and air-circulating equipment.This gigantic trading floor is built without columnsor interior supports – there is no interference witha view to every periphery of the room twinklingwith multicolored numbers and symbols. I met withBill O’Donnell at his computer in this very excitingenvironment William O’Donnell [WOD]: I’m WilliamO’Donnell -- I run the US Interest Rates StrategyGroup here in Stamford for UBS. In the beginningyears of my career, from 1980 to 1984 I helped tostart up a company called Technical Data, whichwas ultimately bought by Thomson Financials.They published a commentary that I contributedto during ‘82, ‘83 and ‘84 – a technical write-up– and that’s where I learned a lot about technicalanalysis. I carried those lessons into my career asa Strategist. I work with a wonderful team at UBSin the US Economics Department run by two senioreconomists.I’ve always felt that trends are driven byfundamentals, and that technicals are critical atturning points in the market. That’s why I love usinga blend of the two -- of technical and fundamentalanalysis -- to synthesize a market view. That’s whatwe do here in Strategy.Fundamental trends don’t change thatquickly -- technical trends do. Technicals –looking at support resistance levels, looking atmomentum, looking at position sentiment,over-bought and over-sold conditions -- helpus to read the “weather systems” that evolvecontinuously over a fundamental landscape.MS: What tools do you use mostfrequently?WOD: That’s an excellent question. If weremove ourselves from the fundamentals for amoment, what we use in technical analysis area couple of different things And I would startby saying that my training goes back to patternrecognition. And when I say pattern recognition useMay 2007two forms in particular: First, there is the “Edwardsand Magee pattern recognition” that goes back tothat great book, The Technical Analysis of StockTrends. I look for patterns such as rising wedges,ascending and descending wedges, and roundingbottoms and tops. I also look for formations suchas pendants and flags in the context of marketsand trends.Patterns and formations help me to identifywhere a consolidation is occurring, and whenmomentum gets overdone. Are we goingsideways in a flag? Do we correct slightly downwardin a bull trend, in a pendant? Is it a continuationpattern? They help me to know when the next legof a move is coming.The second form of pattern recognition Iuse is candlestick charts – I’m relatively new tocandlesticks. I’ve been watching them now forthe past five or six years. I trained with StevenNison’s well-known books on candlesticks,and I have found candlestick observation to beexcellent at turning points. I look for dark cloudcovers, evening stars, morning stars, hammers,among other patterns, to help identify changes andturning points.MS: What kind of charts do you look at?WOD: I typically look at daily charts, becauseI have to comment every day – or we commentevery day as a Strategy Team here at UBS. Myexperience has shown that traders, people on ourtrading desk, tend to use short term charts such as30 and 60 minute charts. They’re trying to definewhere the next few ticks are coming up. We tryto look at the bigger picture. We try to look in thecontext of the next week or two. And daily chartsseem to be the best fit for that. We like to know whatseason we’re in (in the market) – is it winter, is itsummer, is it spring? So we use the weekly charts totry to take a look at even a further step back – kindof like getting a feeling for the weather.MS: Could you explain your weatheranalogy?WOD: Absolutely. This is an analogy that Iuse with born and bred fundamentalists -- thosewho think technical analysts are shamans – it’s theanalogy of the fur trapper in northern climates. Thefur trapper has to know the fundamentals of his job.He has to know where his quarry lives. What theidiosyncrasies of his quarry are. In others words,where to set the trap, when to set the trap, what theylike to eat, and so on. That’s what I would call thefundamentals of fur trapping.But at the same time, the technicals of themarket are something like a weather system –whatis the weather out there – which way are the windsare blowing. What is the temperature, and how isit going to affect his production or yield – as wellas his own well-being. Is a storm coming? Basedon that, how much food do you take when you’recontinued on page 7
Te c h n i c a l l yHow They Do Itcontinued from page 6going out to set your traps, or to recover yourgame? What kind of protection, clothing -- thewhole thing. That’s where technical analysis Ithink has its fit.In the context of the fundamental nature of themarket, it helps to know which way the winds areblowing in the short term. It helps to discover howand when to enter and exit.For example, learning what today’s NonfarmPayroll number is (Friday, April 6) is not goingto tell you where to get in or out of the market-- technical analysis will. Today’s NonfarmPayroll number will not tell you how over-bought orover-sold the market is or which way people areleaning with respect to positions or sentiment.We’re talking about tools that I use – and on thatnote – about positions and sentiment -- part of ouranalysis is to look at positions or sentiment proxiesalong with forecasts for a given number. We keepa weather-eye out to the JP Morgan Survey, theStone and McCarthy Duration Survey.MS: A weather-eye?WOD: We keep a weather-eye out forposition proxies, well-known ones, the JP MorganSurvey which comes out on Tuesday; the Stoneand McCarthy Duration Survey of portfolios thatcomes out on Wednesday; the CFTC data whichis free, and defines speculative futures positions.We take the CFTC data and aggregate net specpositions in all the financial futures contracts. Theaggregated CFTC data has been an outstandingtool to help indicate potential turning points in themarket in past years. And it’s been a very, verygood tool at turning points – not all of them -- butmany of them.People tend to be too long at highs -- thereforeover-extrapolating economic weakness into thefuture. And at the same time, the crowd tends tobe too short and defensive at market lows. TheCFTC data along with other position proxies tendsto highlight this phenomenon.MS: Can you give me an examp
become an even stronger proponent of technical analysis in modern markets. About the authors: Robert D. Edwards and John Magee wrote the original edition of Technical Analysis of Stock Trends. Magee is considered the "father of technical analysis," while Edwards was a pioneer in pattern formation and trend analysis. W. H.