Transcription
Technical Analysis and Stock Market ProfitsOriginally devised as a practical course for investors, it is as alive, vital and instructional todayas the day it was written. It paved the way for Robert Edwards and John Magee's best-sellingTechnical Analysis of Stock Trends – a debt which is acknowledged in their foreword: 'Part Oneis based in large part on the pioneer researches and writings of the late Richard Schabacker.'Richard SchabackerRichard Schabacker achieved his financial fame in the 1920s and 1930s. First as Financial Editorof Forbes and later as Editor of The Annalist, a weekend section of the New York Times. Duringthis time he also authored three books. To many in the markets, who know of him, he is knownas "the father of technical analysis"."To be a successful trader, you need to understand markets deeper than your competitors. A goodway to get started is to read this ground-breaking book - a major text on technical analysis thathas already helped countless traders find their way to market profits while avoiding dangerouspitfalls."Dr Alexander Elder, author of Trading for a Living"Today's technician has all the modern computer methods of interpreting price and buyingtrends. No matter how sophisticated they get, all technicians must get back to basics and there isno finer way of reviewing those time-honored technical principles, rules and precepts than withthe original version of Schabacker's Technical Analysis and Stock Market Profits."Ralph Acampora"If you think you know all there is to know about technical analysis as it pertains to charting andchart trading then you must read Technical Analysis and Stock Market Profits by RichardSchabacker. This original work by the founder of technical analysis will teach you manyvaluable things that you don't know."J. Welles WilderHhTechnical Analysis and Stock Market ProfitsSchabacker presents technical analysis as a totally organized subject and comprehensively laysout the various important patterns, formations, trends, support and resistance areas, andassociated supporting technical detail. He presents factors that can be confidently relied on, andgives equal attention to the blemishes and weaknesses that can upset the best of analyticalforecasts. Factors which investors would do well to absorb and apply when undertaking thefascinating game of price, time and volume analysis.RichardSchabackerRichard W. Schabacker's great work, Technical Analysis and Stock Market Profits, is a worthyaddition to any technical analyst's personal library or any market library. His "pioneeringresearch" represents one of the finest works ever produced on technical analysis, and this bookremains an example of the highest order of analytical quality and incisive trading wisdom.HhHarriman House Classics7.44 x 9.69.951TechnicalAnalysisandStock MarketProfits“The real bible oftechnical analysis”Richard W. SchabackerIntroduced and edited by Donald MackHh7.44 x 9.69Harriman House Classics
TECHNICAL ANALYSISAND STOCK MARKETPROFITSA Course in ForecastingRICHARD W. SCHABACKER
TECHNICAL ANALYSISAND STOCK MARKETPROFITSA Course in ForecastingRICHARD W. SCHABACKERformer Financial Editor of Forbes Magazineand author ofStock Market Theory and PracticeandStock Market ProfitsIntroduced and edited byDonald Mack
HARRIMAN HOUSE LTD43 Chapel StreetPetersfieldHampshireGU32 3DYTel: 44 (0) 1730 233870Fax: 44 (0) 1730 233880email: enquiries@harriman-house.comweb site: www.harriman-house.comTechnical Analysis and Stock Market Profitsfirst printed in the United States of America in 1932Second edition 1937First published in Great Britain 1997 by Pearson Professional LimitedThis edition published by Harriman House Ltd Harriman House Ltd 2005ISBN 1897597568British Library Cataloguing in Publication DataA CIP catalogue record for this book can be obtainedfrom the British Library.All rights reserved; no part of this publication may be reproduced,stored in a retrieval system, or transmitted in any form or by any means,electronic, mechanical, photocopying, recording, or otherwise without eitherthe prior written permission of the Publishers or a licence permitting restrictedcopying in the United Kingdom issued by the Copyright Licensing Agency Ltd,90 Tottenham Court Road, London W1P 0LP. This book may not be lent,resold, hired out or otherwise disposed of by way of trade in any formof binding or cover other than that in which it is published,without the prior consent of the Publishers.Printed and boundby Lightning Source
ABOUT THE AUTHORRichard W. SchabackerRichard W. Schabacker achieved his financial fame in the 1920s and 1930s first asFinancial Editor of Forbes and later as editor of the Annalist, a weekend section of theNew York Times. During this time he also authored three books: Stock Market Theoryand Practice, 1930; Technical Analysis and Stock Market Profits, 1932; and Stock MarketProfits, 1934.ABOUT THE SERIES EDITORDonald MackIf any phrase describes the editor of the Traders’ Masterclass series, which is dedicated solely to bringing back to traders and investors everywhere many of the greatand rare Technical Analysis classics from the past, that phrase would be “a perpetual student of the market”. Students in high school or college eventually graduate.Not so students of speculative markets. The study and the work is never finished,especially when there is an enduring interest in Technical Analysis. The editor’sinterest grew by leaps and bounds when in the late 1970s and the 1980s he established in Los Angeles the only bookstore in the USA that dealt exclusively in stockand commodity books; those that were in print at the time and those that were outof print. Current books were generally unchallenging and of various degrees ofquality. Many out-of-print books were also of varying degrees of quality, but somany fascinating rare works from the 1920s to the 1950s, of great creativity and marvelous technical analytics and application came his way, that a life long appreciationof their quality grew.Almost needless to say, more attention was focused on the old books than on thenew, for he found those old books that made up the great classics were superior tothe new in so many ways. While operating the bookstore, there was a natural inflowand outflow of many thousands of books and from those thousands of books a personal library and collection numbering a good 5,500 plus individual titles was puttogether. A little of the knowledge contained in these great market classics rubbedoff on the editor (actually more than a little) and he trusts that it will also rub off onthe many market students of today and tomorrow as they also come in contact withthe superb Technical Analysis classics that will come their way through this Series.
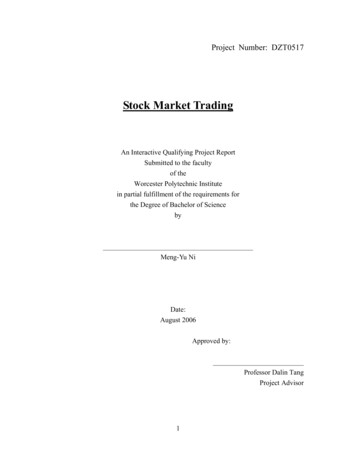
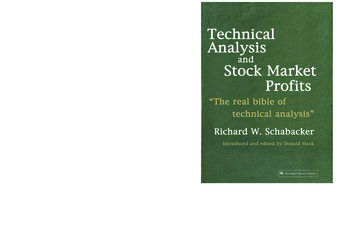
0808060604040202055SHARESDAILYAVERAGE STOCKTRADING-BY MONTHS4MILLION4322111897 1898 1899 1900 1901 1902 1903 1904 1905 1906 1907 1908 1909 1910 1911 1912 1913 1914 1915 1916 1917 1918 1919 1920 1921 1922 1923 1924 1925 1926 1927 1928 1929 1930 1931 1932 1933 1934 1935 1936 1937THE DOW-JONES INDUSTRIAL STOCKS AVERAGEMonthly High and Low of Closing Prices -- 1897 Through August, 1937.SHARESMILLION3
TABLE OF CONTENTSEditor’s IntroductionxiPreface to First EditionxixStudy I TECHNICAL APPROACH TO STOCK TRADING1Definition of a Stock Chart · Technical vs. Fundamental Factors · Technical Positionof Market Most Important · Sources for Chart Data · Advantages of Making YourOwn Charts · Which Stocks to Chart and How Many · Method of ConstructingCharts · Price, Volume and Time Scales · Major, Intermediate and Minor MovementsStudy II IMPORTANT REVERSAL FORMATIONS29Public vs. Insiders · Detecting Professional Operations · Determining Major TurningPoints or Reversals · Volume Signs at Reversals · The One-Day Reversal ·Comparative Volume at Tops and Bottoms · Price and Volume Must be ConsideredTogether · The Head and Shoulders Formation · Volume Action on Head andShoulders · Importance of Neck-Base Line · Varying Width of Shoulders · The Timeto Act on Head and Shoulders · Ascending and Descending Neck-Base Lines · FlatShoulder Variants of Head and Shoulders Formation · Reliability of Head andShoulders Formation · Logic of Chart PatternsStudy III IMPORTANT REVERSAL FORMATIONS CONTINUED65The Common or Rounding Turn · Volume Action on Rounding Turns · TheSymmetrical Triangle as a Reversal Formation · The Break-away Move fromTriangle Patterns · Volume Action on Break-Outs · Comparative Reliability of Earlyand Late Break-Outs · Relation of Price Move to Patterns Size · Wave MovementFollowing Apex · The Right-Angle Triangle as Reversal · The Descending Triangle ·Volume on Break-Out From Descending Triangle · Effect of General Market onIndividual Stocks · Ascending Triangles as Reversals · The Wedge Formation ·Action Following Up-Turned and Down-Turned Wedges Compared · StrictDefinition Required for Wedge Patterns · Probable Causes for TrianglesStudy IV IMPORTANT REVERSAL FORMATIONS CONTINUEDThe Double Top and Double Bottom · Requirements for Valid Double ReversalFormations · Multiple Tops and Bottoms · Illustration of a False Double Top ·Double Tops and Bottoms on Long-Range Charts · “M” and “W” Formations ·Complex Reversal Formations · Relation to Multiple Formations and Head and– vii –105
TABLE OF CONTENTSShoulders · Varieties of Complex Patterns · Volume Indications in ComplexReversals · The Broadening Top Reversal · Analysis of Broadening Top · BroadeningTop Ending Bull Market · Rally Following Completion of Broadening Top ·Broadening Formations Which Fail · Possible Explanation for Broadening TopStudy V MINOR REVERSAL FORMATIONS143The Inverted Triangle · Differences Between Inverted and Normal Triangle ·Inverted Right-Angle Triangle · The Diamond Formation · The Rectangle as aReversal · Break out of Dormancy · Relative Dormancy in an Active Stock · TheIsland Reversal · Strict Requirements for Island Formation · The One-Day IslandStudy VI MAJOR CONTINUATION FORMATIONS177Logic of the Intermediate Area Patterns · The Symmetrical Triangle as aContinuation · Volume Action in Continuation Triangles · Right-Angle Triangles asContinuations · The Ascending Triangle in Up-Trends · The Descending Triangle inDown-Trends · Inverted Triangles as Continuations · The Rectangle as aContinuation · Volume Action in Rectangle Continuations · The Flags and Pennants· Various Flag Aspects and Interpretations · Flags in Up and Down-Trends ·Relation of Pennant to Wedge Pattern · The Head and Shoulders ContinuationPattern · Review of Continuation Patterns · Formations Which Change TheirNatureStudy VII MISCELLANEOUS INTERMEDIATE PATTERNSAND PHENOMENA219Patterns with Drooping Bottom · Patterns with Accelerating Peaks · Trading on theAccelerating Patterns · The Horn Formation · The Inverted Horn · Out-of-Line PriceMovements · Interpretation of Out-of-Line Action · The Zig-Zag Movement ·Recurrent Patterns of Price Action · Warning Given by Recurring Movements · ThePrice Gap – General Description · Classification of Gaps · The Common Gap · TheBreak-Away Gap · Interpretation of the Break-Away Gap · Continuation Gaps · TheExhaustion Gap · The Interpretation of the Exhaustion Gap · Variants of the IslandFormation · Gaps on Ex-Dividend and Ex-Rights Days263Study VIII TREND LINE ACTIONDefinition of the Trend Line · The Theory of Trend Lines · Practical Uses of TrendLines · Methods of Establishing Trend Lines · Practicing on the Chart · PatternsAppearing Within Trends · Trading on the Primary Trend Line · The Double TrendLine or Trend Channel · Playing the Major Trend · Relative Profits With and Againstthe Major Trend · Trend Lines Signaling Reversals · Horizontal Trading Areas ·What Constitutes a Significant Break · Volume Action on Breaking of Trend Line ·Fanning Trend Lines and Flattening Trends · The Throw Back After a Trend isBroken · Estimating the Extent of Probable Movement by Trend Lines · Logarithmicvs. Arithmetic ScalesGENERAL REVIEW OF VOLUME : Volume as an Indication of Reversal · Volume Actionat Temporary Halts in Trends · Declining Volume During Patterns Formulation ·– viii –
TABLE OF CONTENTSVolume as an Indication of Continuation · Relation of Volume to Price Movement ·Relation of Volume Action to Basic TrendsTHE DOW THEORY: Its Major Tenets · Limitations of Dow Theory in Practical TradingStudy IX SUPPORT AND RESISTANCE LEVELS301Definition of Support and Resistance Levels · Logical Explanation for ReversalLevels · Reliability of Support and Resistance Levels · Bottoms Become Tops andTops Become Bottoms · Value of Weekly Charts in Forecasting · The Volume Factorin Estimating Future Influence · Practical Application of Support and ResistanceStudy to Current Charts · Resistance and Support Levels in Minor Fluctuations ·Resistances Set Up by Trend Lines · The Cradle Formation · Resistance and SupportLevels Set Up by Head and Shoulders Formation · Support and Resistance LevelsSet Up by Multiple Formations · Support and Resistance Levels Set Up byRectangles and Right-Angle Triangles · Support and Resistance Levels Set Up bySymmetrical Triangles · Support and Resistance at Gaps · Practical Uses of PatternResistance Study · The Longevity of Support and Resistance Levels · 50 and 100 asCritical Levels · The Half-Way Intermediate Movement Theory · Price Action atSupport or Resistance LevelsStudy X MEASURING RULES AND FORMATIONS333Use of Support and Resistance Factors in Measuring · Trend Lines as MeasuringIndications · Measuring Implications of Patterns in Bull and Bear Markets ·Measuring Implications of Head and Shoulders Formation · MeasuringImplications of Triangle · Flags and Pennants as Measuring Patterns · The HalfMast Congestion Pattern · Measuring Theories Applied to Gaps · The Single GapMeasuring Theory · The Multiple Gap Measuring Theory · Dependability of GapTheories · The Time Element in MeasuringFALSE MOVES AND SHAKE-OUTS: Definition of False Move and Shake-Out · TrianglesMost Susceptible to False Moves · Volume Action on False Moves · False Moves FromRight-Angle Triangles · False Moves out of Rectangles · False Move vs. Out-of-LineMovement · False Moves Follow Head and Shoulders Formations · Defense AgainstFalse Moves · Strict Construction of Break-Out Rules · Use of Stop-Loss OrdersAgainst False Moves · The Bright Side of False Moves · The End Run Price ActionSTOP - LOSS ORDERS : The Mechanics of Stop Orders · When to Place Stop Orders ·Where to Place Stop Orders · The 5% Allowance Rule · Shifting the Stop Order · The“Two Days Away” Rule · Stop-Loss Orders in Short Selling · Judgment in PlacingInitial Stop · Use of “Mental” Stops · Stop Orders Not Recommended WithinPatterns · Doubling or Switching Stops · Use of Stops to Make New CommitmentsStudy XI USE OF LONG-TERM CHARTS, AVERAGES AND GROUPSMonthly Charts · Average Charts · Group Charts · Shorter Time Intervals in Charts ·Hourly Charts · The Ticker Chart · Minor Move Chart · Minor Trend Line Chart ·Point or Figure ChartsCHARTING BONDS AND COMMODITIES : The Bond Market · Commodity Charts · TheWheat Market · Formations Appearing on Wheat Charts · The Cotton Market– ix –377
TABLE OF CONTENTS405Study XII TRADING TACTICSSelection of Operating Stocks · Swing Power Studies · Poor Stocks for Charting ·Necessity for Patience · Limited vs. Market Orders · Advice to the Too Conservative· Danger of Stubborness · Weighing Risks in Advance · Paper TradingSUMMARY AND REVIEW : Chart Science a Catalog of Experience · Chart DeceptionEngineered by Operators · A Program for the Beginner · Making Up the List ·Starting the Charts · Studying the Patterns · The Final TestIndex of Figures by Figure Number433Index of Figures by Subject437Index of Text References to Figures440Index of Subjects444Editor’s noteBecause of the poor quality reproduction of the original charts it was foundnecessary to re-draw each one. The vertical price bars on each chart were faithfullyreproduced as closely as possible to the original bars, in terms of size and date. Thehorizontal bars (the Closing Price bars) proved troublesome and the decision wasmade to insert them only when the author made specific reference to their position.With there being no other references in the text concerning the other horizontal barson the charts, the closing price indications were superfluous and could be, and were,safely omitted.–x–
EDITOR’S INTRODUCTION“Part One is based in large part on the pioneer researches and writings of the late Richard W.Schabacker. Students of his Technical Analysis and Stock Market Profits (the latest revision ofwhich – now out of print – was made in 1937 by the present writer and Albert L. Kimball) willfind in the pages of this section much that is familiar and except for the illustrations, only alittle that is really novel”From the Foreword to Technical Analysis of Stock Trendsby Robert D. Edwards and John Magee, 1948To American technical analysts past, present, and future, the year 1948 stands out asone of the brightest of beacons, bringing the solid foundations of modern TechnicalAnalysis. For it was this year that saw the publication of Technical Analysis of StockTrends, written by Messrs Edwards and Magee, which was the pivotal work inlaunching Technical Analysis at a time that was to prove ready for it. Without adoubt a great debt of gratitude has to be bestowed on the two authors and theirtimely book which has sold some 800,000 plus copies and in later years has earnedfor itself the accolade of “the bible of Technical Analysis.” A check with most dedicated technical analysts who have learned their craft since 1948 would confirm theirpersonal debt to this work, which was responsible for introducing them to Technical Analysis or expanding their technical education.But how did all of this come about? Technical Analysis certainly did not have along history of acceptance in the 1940s and before by the established investment fraternity in New York, London, Paris and elsewhere. Without a doubt it was easier tokeep to long held beliefs that this form of analysis, utilizing charts of share priceaction, was more akin to mumbo-jumbo than to the accepted seemingly logicalapproach built around the respectable tools of Fundamental Analysis. To value acompany it was enough to analyze its accounts, work out its p/e ratio, be aware ofits research developments, weigh up its reported sales figures, estimate futureprospects, etc., thus arriving at a basis to value the company in terms of its shareprice. Comparing that with the technical analyst’s toolbox containing charts, horizontal, vertical, angular and squiggly lines, fanciful looking patterns, pictured formations, plus indicators, oscillators and the like, logical investment thinking easilycame to the conclusion that Technical Analysis was a pseudo-scientific approachthat basically relied on price, time, and volume numbers, and paid little or no attention to the company itself. In comparison, accepted serious investment analysis concentrated on the company’s important fundamentals, for it was considered that in– xi –
EDITOR’S INTRODUCTIONthese lay the only real basis for valuing a company’s share price in the trading markets, which to fundamental analysts is what investing is about.Looking back now, it is easy to see that the post-World War II period investmentscene was ripe for new thinking not contrary to, but in addition to, the establishedfundamental approach that relied heavily on the work that flowed out of the largebrokerage firms’ research departments to their customers. Filling that vacuumknowingly or unknowingly, Messrs Edwards and Magee produced their timely andtechnically definitive book which not only gave organized form and shape to thefield of Technical Analysis, but also gave rise to new analytical thought that the postwar age could substantially make use of as an efficient methodology for investmenttiming and selection. In the years prior to the publication of their influential Technical Analysis of Stock Trends, it should not go unnoticed, however, that many bookswere published that can certainly be described as outstanding technical worksencompassing many phases of this analytical technology and thinking. A goodnumber of these books and courses were as original and as technically advanced asanything on the subject of Technical Analysis that has been published since; greattechnical thinking is just that whether it is expressed in 1920, 1940, 1997 or at anyother time. Such is the case with this book by Schabacker, for it, like many of thegreat works of the past, is a worthy addition to any technical analyst’s personallibrary or any market library. It is our belief that such great classics with their timeless analytical knowledge should never be allowed to disappear from the technicalscene, if possible. It is to this end that Pitman Publishing, publishers of this MasterClass Series, will be making many of these very rare works available again with anincreasing number of additions to this series of great classical writings from the“Golden Age of Technical Analysis,” that very productive period between 1922 and1957.Returning to the post-World War II period, it would appear the investment worldwas open to that one vital analytical work turning up to give this recovery period aboost. History has shown that Edwards and Magee were the boost-givers. Delvinginto their book we find it is divided into two main parts; Part One forms the bulk ofthe book and contains the main subject matter which is the descriptions contributedby Mr Edwards in his coverage on reversal, consolidation, and continuation patterns, trends, trend line action, support and resistance levels, and other areas of technical price action. The shorter Part Two by Mr Magee concentrates on the practicalapplications of what to do in the markets and when. While Part Two includes muchin the way of general investment and trading knowledge that has been covered inmany books before and since, it is Part One that made the difference in 1948. In PartOne both private investors and professional analysts were presented with a compendium of chart patterns, formations, and technical action. If they had studied conscientiously and applied the knowledge extensively, they would have had some– xii –
EDITOR’S INTRODUCTIONexcellent tools at hand to analyze skillfully any chart that they scrutinized in thelight of the tenets of Technical Analysis.As fine and comprehensive as the Edwards and Magee work is, a careful readingof the introduction and similar statements on the book’s cover reveals their debt toMr Schabacker. Their candor and honesty is to be admired for they freely state thatthey did not develop or create the many facets of Technical Analysis which theywere passing on to a new generation. What their excellent work did accomplish wasto save for posterity the vital creative and developmental work of their guiding lightwho had passed away some ten years earlier, and in so doing they educated manythousands in this new-to-them art of chart analysis. This takes us to a name nowunknown to almost all Technical Analysis devotees and cognoscenti around theglobe, the mentor of Edwards and Magee, Richard W. Schabacker. For it was fromSchabacker’s “pioneering research,” as pointed out by Edwards, that the monumental concepts and ideas which emerged in this book Technical Analysis and StockMarket Profits: A Course in Forecasting came, and have proven to be the foundation ofmodern Technical Analysis. It is certainly this writer’s opinion that this Course bySchabacker represents the finest work ever produced on conventional TechnicalAnalysis. The qualifying word “conventional” is inserted because it must be used incomparison to the work of William D. Gann who was equally as great, but more interms of the “unconventional” technical approach with which he is associated.It seems almost unbelievable that such remarkable writings could have remainedunknown to the investment public for so long. Other than Edwards in his introduction to Technical Analysis of Stock Trends, we know of no other reference to it. Marketstudents should be aware of how this happened, as it is a too familiar story thatequally applies to a great number of other superb technical works that also remainalmost unknown today; an unwelcome fate that leaves the Technical Analysis fraternity much the poorer. However, before going into the historical reasons anddevelopments that resulted in the dearth of classical Technical Analysis writingsthat has haunted the field for many years, it would be well to take a closer look atthis classical work by Schabacker which remains an example of the highest order ofanalytical quality and incisive technical thought, and should serve as an ideal totechnical students everywhere.The Schabacker stock market story centers around the time of his financial editorship activities with Forbes Magazine and later as editor for the Annalist weeklypublication that accompanied the New York Times. In 1930 Mr Schabacker wrote hisfirst book Stock Market Theory and Practice, a task that then firmly established hisinvestment literary credentials. It was an odd book in its own way. For a start it wasquite a thick book, some 800 plus pages long. Two-thirds of these pages wereinvolved with describing such pedantic subjects as to the functions of stockbrokersin the market place, the paths the buy and sells orders take to reach the various– xiii –
EDITOR’S INTRODUCTIONexchanges, details about these many exchanges, how orders are handled when theycome in and so on. Certainly these are not very exciting subjects, and for us today,even less exciting, as the computer has changed many of the mechanical aspects ofbuying and selling that the brokerage offices and exchanges used to rely on toaccomplish their tasks. It is the remaining third of the book that was destined togreatly heighten our interest. For it is here that the author for the first time in memory presented Technical Analysis as a totally organized subject wherein he comprehensively laid out the various important patterns, formations, trends, support andresistance areas, and associated supporting technical detail.Just two years later, in 1932, came the publication of the first edition of this work.We can only surmise why the author felt he had to publish a second work of a similar nature to the one he had written two years earlier. We have to think that whilehe must have felt the earlier book with its 250-plus pages devoted to technical subjects gave good coverage of what he wanted to say, he had come to the conclusionthat there was a great deal more he could expound on to advance Technical Analysis as a serious analytical approach in investment thinking, a more comprehensivepresentation worthy of the subject. The end result was this Course and masterpiecethat we now can say was well in keeping with his later recognition as “the father ofmodern Technical Analysis.” Nevertheless, most technical analysts today stillremain unaware of Mr Schabacker’s place in the order of things or his contributionsto what is now the most popular form of investment analysis, Technical Analysis.However, with this re-publishing of Schabacker’s finest writings, it is hoped anawakening appreciation will sweep the cobwebs of anonymity away from thisextremely important contributor to our world of analytical thought and application.For any trader or investor, from the rankest beginner to the most experiencedinstitutional fund manager, the most critical point that lies at the heart of any investment position they hold is when they find they have to ask themselves as the trendevolves whether that position is at a peak with a possible reversal in the offing or, asthe case may be, at a bottom and a possible reversal in that price movement.Depending on whether they are taking a long-term, a more intermediate-term, or ashort-term view (and they are all relative in respect to time), that change of trendcould make a vital difference to a profit gained or a loss sustained for that position.This would also hold true for any buying decision or short sale decision being considered as the price action goes through its upside/downside contortions. For thisreason Mr Schabacker chose to make Reversal Patterns the area he would give thegreatest emphasis and attention to in the Course, and in so doing stressed the importance of this knowledge in the education of technical students, who see themselvesas intertwined in the dynamics of the marketplace. (In truth we who see ourselvesas students of the market know we are destined to attend Analysis University for aslong we are market-oriented. With the potential pool of knowledge that is there to– xiv –
EDITOR’S INTRODUCTIONbe explored, and our time on this planet so relatively limited, there can never be anend to our learning experience. The only possible graduation ceremony we canexpect from our University has to be when we graduate to those Great Stock andCommodity Markets in the Sky.)In surveying the broad range of Reversal Patterns to be covered in the Course, theinitial formation the Author chose and the obvious one to feature was the one thatmost exemplified reversal indications, the Head and Shoulders Formation and themany variations of its basic construction. His first description centers on its idealized construction (as is the case when initially describing patterns and formations tobe seen on the charts. That they have to be “generally” described can be taken forgranted, as any description is normally started with an idealized version first. However, this must of necessity be tempered with the student’s realization that as innature, so is it in the reality of any patterned price movement, nothing repeats itself“exactly.”) Following this introduction to the price formation or action that he is presenting as he typically
It paved the way for Robert Edwards and John Magee's best-selling Technical Analysis of Stock Trends – a debt which is acknowledged in their foreword: 'Part One is based in large part on the pioneer researches and writings of the late Richard Schabacker.' Schabacker presents technical