Transcription
Volume 6, Issue 5, May – 2021International Journal of Innovative Science and Research TechnologyISSN No:-2456-2165Fundamental & Technical Analysis of Stock forBeginnersDr. Leena Sharma1, Mr. Pratik Patil2, Siddhesh Choudhari2,Devendra Sangle2, V pavan kumar reddy21Associate Professor, Pimpri Chinchwad College of Engineering, Pune2Student, Pimpri Chinchwad College of Engineering, PuneAbstract:- Stock market is for local public to invest theirmoney in companies and get their shares. If ‘A’ personwants to get shares of SBI Bank, stock market willprovide him a seller who wants to sell his stock. We havecreated this project for beginner to help them forprediction of stock. We have considered 3 major factorslike Technical, Fundamental & News. In Technicalanalysis we used 44 moving average, as it forms averageof 44 days closing candle average. In fundamental wehave used 3 basic rules of analysis, which are used bymany investors and they show long term vision ofcompany and their internal management. News plays animportant factor to dump or rise of share price, as is playswith people sentiments. Using these 3 predictions abeginner can sort list of stock which he wants to buy.I.INTRODUCTIONStock market can be the primary or secondary source ofincome. Investors use the stock market to build their wealth.Before investing in stock market, fundamental and technicalanalysis of stock should be done for the great returns withinless span of time. Also, investors should know the how anynews effects on the stock market so that they can avoid lossor make profit. So, in this research paper we will study someparameters like fundamental analysis, technical analysis andhow the news effects on the stock market by which we canpredict the direction of stock market or any specific stock.Also, we will see some stocks performance based on theabove parameters.Before that we will analyze some others research paperbased on respective parameter so that we can get the moreinformation about the stock market.II.LITERATURE REVIEW The Fundamental Analysis: An Overview: Soniar. Bentes,Rahul Navas[2].Fundamental analysis examines and determines thevalues of the companies while examining its economic andfinancial reports such as liabilities, assets, expenses etc.person uses a top-down approach or bottom-up approachwhile carrying out fundamental analysis. different sectorinvestors use the fundamental analysis method differently totarget different ways of gaining profits and predicting thefuture growth of a stock keeping in mind their span ofIJISRT21MAY1101investment. The fundamental analysis is mainly used by theshareholders who have largely surpassed the stock market’sannual return. This method is widely used because it helpsidentify companies with long term advantages, it is easy tocarry out, and it is a consistent process as the process iscarried out by analyzing the available financial reports. Itspros fundamental analysis specifies a range of prices. Manyanalysts use ratios such as EPS [earning per share], ROE[return on equity], ROI [return on investment], and P/E ratio [price to earnings ratio] thus, it concludes that fundamentalanalysis which uses qualitative and quantitative informationis better or suitable for long term investments. Technical Analysis of Indian Financial Market with theHelp of Indicator: Mohd Naved [3]Technical analysis is the method to predict futureearnings by studying past performance and trends. Majorindicators that are successful are moving average and MACD(moving averages and convergence/divergence). Financialmarkets are the places, where buying and selling of assets iscarried out at low cost. Stock market mainly contains twotypes of analysis fundamental and technical. fundamentalanalysis mainly focuses on financial performance and stockprices whereas technical analysis is predicting the future trendusing the study of past trends. moving average is the averageof security prices over a while. mean of all values. thisaverage keeps on changing every day. The Impact of Mass Media Communication on StockTrading Decisions: An Empirical Study: Prem Malhotra,Sunita Malhotra [4]The buying or selling of the stock is a crucial task fortraders and investor as it decides the wether they will getprofit or loss. The research shows that news/social mediacommunication has been more effective than bothfundamental and technical analysis. Mass media carriesrumours, news related to companies, etc. various mass mediaare Instagram, newspapers, media, Facebook, etc. Massmedia communication has a strong relationship with the buyand sells of stocks even more than the fundamental andtechnical analysis. This information passing through massmedia has a strong and effective psychological influence ontraders or investors. Local media working and informationexchange usually reflect the investing in the area. If there agood or negative news pf a company management affect thesentiments of traders and investors to change their decisionwww.ijisrt.com1334
Volume 6, Issue 5, May – 2021International Journal of Innovative Science and Research TechnologyISSN No:-2456-2165and there are rumours, which affects the share negatively infuture.III.SMA (23 23.40 23.20 24 25.50)/5SMA 23.82So the average of ABC stock is 23.83 Rs.IMPORTANT FACTORSA. NEWS ANALYSISEffect of news on the stock marketIn this part, we will see that how any news affects thestock market or any specific stock by studying news and itseffect on a specific stock. News changes the mindset ofinvestors. It impacts positively or negatively on the stocks.Bad news will normally cause people to sell stocks. Aless profit than expectation, pandemic and politicaluncertainty all convert to selling and causes a decrease inprices of specific stock or effects badly on the whole market.Positive news will normally cause investors to purchasestocks. The good earnings report, positive economicenvironment, stable political affairs all converts to a largeamount of buying and increase in stock prices or effectspositively on the whole market.Negative news for any stock may be taken positively foranother stock that is in competition with that stock or in thesame field.News and Effect:News: Bank of Maharashtra, Bank of India, IOB &Central Bank of India: Government shortlists these 4banks for potential privatisation, says report[news bymoney control website]Effect: Central Bank of India, Indian Overseas Bankshares jump 20% each on privatisation news.B. TECHNICAL ANALYSISIn technical analysis, we will use only one parameter topredict the market that is a simple moving average. A Simplemoving average is a technical indicator used to determine thedirection of a trend. It is the sum of all the data points over aperiod of time and divides the total by the number of timeperiods set to get an average. It is called a “moving” averagebecause it continuously keeps changing its value based on thelatest price . In financial markets, use of SMA indicator todetermine whether to buy or sell a stock . The formula forSimple Moving Average is written as follows:SMA (A1 A2 .An) / nWhere,A is the average in period nn is the number of periodsExample:If a person wants to calculate the simple movingaverage for Stock ABC by looking at the closing prices of thestock for the last five days. The closing prices for Stock ABCfor the last five days are as follows: Rs-23 , Rs-23.40 , Rs23.20 , Rs-24 , Rs-25.50. The SMA is then calculated asfollows:IJISRT21MAY1101 MOVING AVERAGE:Moving averages can be calculated for any time framefrom minutes, hours to days and months. Investors can selectany time frame to analyse the market on your requirements.The average is calculated by a smooth curving line andit continues to move as time passes.The moving average can be used to identify heavybuying or selling opportunities in the market. When the stockprice trades above its average price(i.e the chart of thespecific stock is above the moving average) it means thetraders are willing to buy the stock . This means the tradersfeelings are very good about the stock price. Therefore, oneshould look at buying the stock at that time. Likewise, whenthe stock price trades below its average price(i.e the chart ofthe specific stock is below the moving average) it means thetraders are willing to sell the stock. This means the tradersfeelings are not good about the stock. Therefore, one shouldsell the stock to avoid losses in the market.C. FUNDAMENTAL ANALYSISFundamental analysis is used to analyse the company’svaluation. By fundamental analysis, we get to know the actualvalue of the company. The fundamental analysis mainly usedto predict the true value of the stock by the calculated the riskof profits, dividends. Using it we can find the company whichcan be worth of core, and its share is undervalued, therefore itis an important factor of analyses. FINANCIALSTATEMENTSANDFINANCIALINDICATORSThe basic rule of analyses consists of the balance sheet,cash flow, debt, assets. These financial statements are theprimary source of information for retail investor, trader aswell as public. FUNDAMENTAL ANALYSIS 3 BASIC RULE:RULE 1: Assets Liabilities EquityASSET: Assets are likely to provide the organization with futurestrategic benefits due to earlier sales. Included are cash, receivables, stock and long-termproperty, such as equipment and furniture.LIABILITIES: This means that the corporation's obligations are theliabilities. Liabilities are described as responsible for debts orobligations from past purchases to be paid to products orfacilities in future.EQUITY: There are two pieces of equity on a company balancesheet: 1) Financial contributions or stock saleswww.ijisrt.com1335
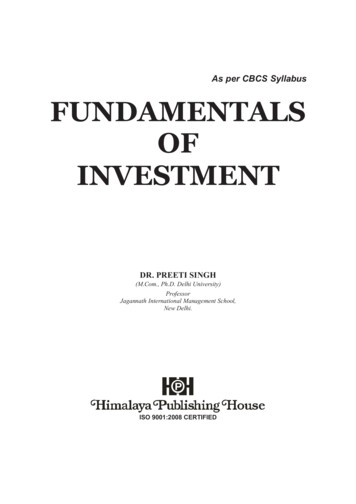
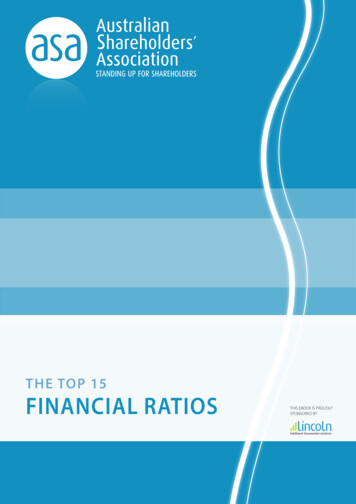
Volume 6, Issue 5, May – 2021International Journal of Innovative Science and Research TechnologyISSN No:-2456-2165investments by the proprietors (such as down payments ontheir homes), and 2) income sustained (like the increase invalue of your home). Recovered income is the amount of net income receivedby a corporation, which has not been paid to its ownerssince its foundation.RULE 1:RULE 2: Cash Flow You can't retain the corporation if you can't make thepayroll or pay the suppliers. Current ratio Current Assets / Current Liabilities The basics are cash, receivables and stock. Within one year, the company would pay all its liabilitiesunder an existing above-1 ratio.RULE 2:RULE 3: Compare the company balance sheet for the last5 years. Take a look at year to year balance sheet For instance, if you are a commodity company andinventory management is important, a comparativebalance sheet may be the first step in deciding whether ornot you have a problem.Total Assets74794.0074368.0078898.0078266.00Comparing the last 4 years Asset, the asset has grownand it shows a positive sign for long term investment.Reserves 00201877825.002017The cash flow in the company, as we can see in thecovid period the company reserves & surplus decreased in2020 but the company in 2021 has increased their reserves by431CR.RULE 3: DEBT EQUITY RATIO of the company is 0.0 as thereare no loans on the company. The Current Ratio of the company is decreased by1.78% Return On Assets of the company is down by 41.39%EXAMPLE:If we take an example of Tata ConsultancyServices(TCS) and measure it according to the 3 Basic Ruleof Fundamental Analysis.IV.CASE STUDYA. Tata Consultancy Services(TCS) [5,6]TCS is an example of good fundamental and good technical & news because of this it manages to give us profits for alonger time frame.Fundamental - Tata Consultancy Services (TCS) is thelargest and the most valuable debt-free company. Accordingto the 3 Rule of fundamental analysis, the asset has grownand it shows a positive sign for long term investment,reserves & surplus increased in 2021. Debt Equity Ratio ofthe company is 0.0 as there are no loans on the company. TheIJISRT21MAY1101Current Ratio of the company is decreased by 1.78% ReturnOn Assets of the company is down by 41.39%Technical - For technical analysis, we have used 44 movingaverage as parameters. As you can see in the above chart theblue line is moving average. If you had bought the stockwhen moving average touches the candle near the first arrowwww.ijisrt.com1336
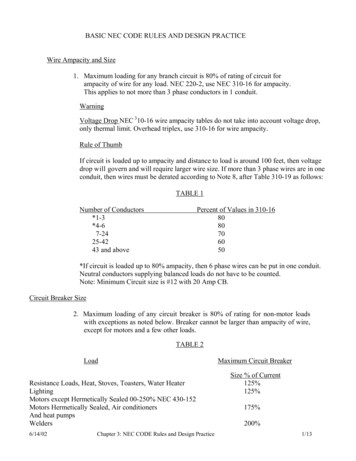
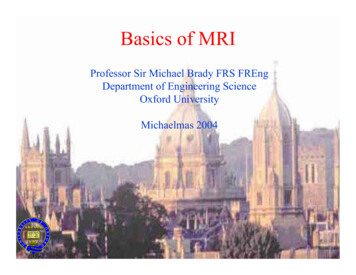
Volume 6, Issue 5, May – 2021International Journal of Innovative Science and Research TechnologyISSN No:-2456-2165and holds it for just one month till moving average againcomes near the candle. The stock moved from 2680 to 3225with a return of 20% in just one month.current market price of Tata Consultancy Services Ltd. is Rs3163.1.B. Tata Motors Ltd (TAMO) [5,6]News - ICICI Securities NSE 3.54 % has a buy call on TataConsultancy Services with a target price of Rs 3354. TheTata Motors is an example of a good technical but bad fundamental stock still the stock manages to go up because of thevery good technical & news of the stockFundamental - Tata Motors had a total debt of 1.18 lakhcrore as of March 31, 2020. So investing in a debt stock maylead to losing our capital in that stock. Investors should avoidsuch stocks in their portfolio.Technical - For technical analysis, we have used 44 movingaverage as a parameter. As you can see in the above chart theblue line is moving average. If you had bought the stockwhen it touches the candle on 20 December( first blackarrow) and hold it till it again touches the candle on 15 march(second black arrow) you can see the stock moved from 160to 310 which is 90% profit.News - Tesla in talks with Tata Motors for EV charginginfrastructureHDFC Securities is bullish on Tata Motors hasrecommended a buy rating on the stock with a target price ofRs 315 in its research report dated February 01, 2021.C. Yes Bank Ltd (YESB) [5,6]Yes Bank is an example of weak technicals and weak fundamentals, as well as the news related to this stock, are not goodin the market, hence sentiments in people related to stock are bad.IJISRT21MAY1101www.ijisrt.com1337
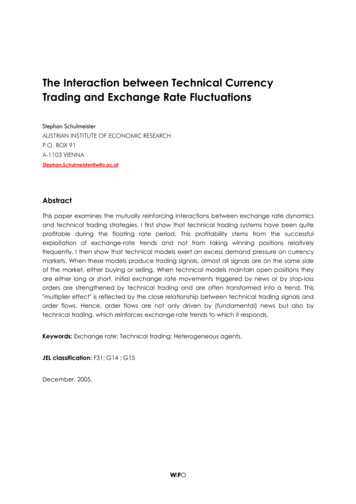
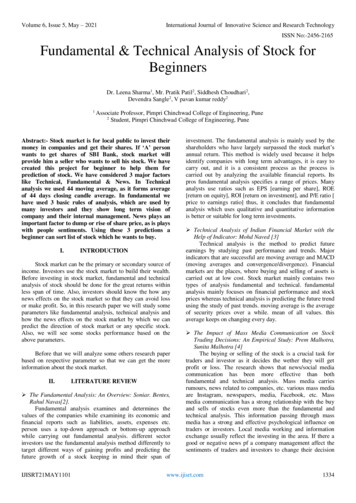
Volume 6, Issue 5, May – 2021International Journal of Innovative Science and Research TechnologyISSN No:-2456-2165Fundamentals: Total growth of yes bank in 2020 was 24.57% and had a profit of -18,576 cr.As the two parametersin fundamentals are negative, investors will avoid this stockto add to their portfolio.Technicals: In the chart, as we are using the moving averageparameter, we can see that the current share price is tradingbelow the moving average line. As it is showing weaktechnicals, so invest in this stock may be risky and leads tolosing the capital.News: Market capitalisation of the lender rose to Rs40,463.67 crore. The stock has touched a 52-week high of Rs87.95 and a 52-week low of Rs 5.55. Share of the privatelender has fallen 58% in one year. The share has fallen 3% inone week, 8.5% in a month. Year-to-date, the stock is down9%.D. Havells India Ltd (HVEL) [5,6]HAVELLS INDIA is an example of a good fundamental and down technical chart, as well as news of the company showingthat there is a surge in the home appliances market.Fundamental: According to the 3 Basic rule of analysis, thecompany shows a positive sign. The company has beenmaintaining a healthy dividend payout of 24.52%. The assetof the company also increases over the period of time, thecash flow of the company is very good. Stock P/E is 68.4which is very good for the long term and the market cap isrelative to its competitor.the share price as fallen in price, so this shows weak technicalsupport in market.Technical: In the chart, we can see there is a negative sign ofthe graph, as the 44 moving average shows the down line andE. Reliance Industries Ltd (RELI) [5,6]News: Ravindra Singh Negi, Havells NSE 0.38 %, discussesthe demand surge of home appliances during Covid-19 timesand how the market dynamics have shifted to online.Havells India shares fall 1.19% as Nifty dropsReliance Industries Ltd company is favourite of many investors as the company is showing very good results infundamental as well as technical analysis, news related to the company is also good. Reliance Industries is Good Stock forlong term investment.IJISRT21MAY1101www.ijisrt.com1338
Volume 6, Issue 5, May – 2021International Journal of Innovative Science and Research TechnologyISSN No:-2456-2165Fundamental: By looking at the 3 Rule of analysis, companynet profit, asset are increasing, sales of the company areincreased rapidly over the year. Reserver of the company isbrilliant, as the investment is increased from a foreigninstitute. The debt of the company is decreased in the year soin long term, very good share to buy.Technical: As we can see from the chart in 2020 may the 44moving average shows a linear growth in the market, from1100 to 2169, which is really good growth in a year. So thisshows a positive sign to include it in your portfolio.News: Reliance Industrial Infrastructure consolidated netprofit rises 11.90% in the March 2021 quarterRIL subsidiary acquires additional stake in skyTran; shareprice gainsV.CONCLUSIONWe can conclude that all parameters fundamentalanalysis, technical analysis and news analysis have their ownadvantages and disadvantages. News creates physiologicaleffects on investors or traders thus controlling their investingor trading more than fundamental and technical analysis.Fundamental is more of studying liabilities, assets, loan ofcompanies, debt, etc whereas technical analysis involvesmore of studying the past trends. The investor can predicttheir respective stock by using these parameters, but the profitis not 100% guaranteed by any of this method and there isalways a risk in investing in the stock market no matter howmuch the investor research, but he/she stands in a betterposition than other investors or traders.REFERENCES[1]. Stock Market Analysis of 10 Different Countries in thePeriod of Disease COVID-19, Dr. Leena Sharma,Aditya V. Yadav, S. P. Ahirrao, V. S. Manik, A. S.Ramani, International Journal of Engineering andManagement Research, Volume-10, Issue-4(August2020), https://doi.org/10.31033/ijemr.10.4.3[2]. The Fundamental Analysis: An Overview: Soniar.Bentes, Rahul Navas, Int. J Latest Trends Fin. Eco. Sc.Vol‐3 No. 1 March, 2013[3]. Technical Analysis of Indian Financial Market with theHelp of Indicator: Mohd Naved, International Journal ofScience and Research (IJSR), ISSN (Online): 23197064 Index Copernicus Value (2013): 6.14 ImpactFactor (2013): 4.438[4]. The Impact of Mass Media Communication on StockTrading Decisions: An Empirical Study: PremMalhotra, Sunita Malhotra, European Journal ofBusiness and Management, Vol 4, No 6 (2012)[5]. http://www.corporatefinanceinstitute.com[6]. isrt.com1339
beginner can sort list of stock which he wants to buy. I. INTRODUCTION Stock market can be the primary or secondary source of income. Investors use the stock market to build their wealth. Before investing in stock market, fundamental and technical analysis of stock should be done for the great returns within less span of time.