Transcription
J Head Trauma RehabilVol. 25, No. 4, pp. 293–305c 2010 Wolters Kluwer Health Lippincott Williams & WilkinsCopyright Visual Tracking Synchronizationas a Metric for Concussion ScreeningJun Maruta, PhD; Minah Suh, PhD; Sumit N. Niogi, PhD; Pratik Mukherjee, MD, PhD;Jamshid Ghajar, MD, PhDOur goal was to determine whether performance variability during predictive visual tracking can provide a screeningmeasure for mild traumatic brain injury (mTBI). Seventeen subjects with chronic postconcussive syndrome and9 healthy control subjects were included in this study. Eye movements were recorded with video-oculography asthe subject visually tracked a target that moved through a circular trajectory. We compared the variability of gazepositional errors relative to the target with the microstructural integrity of white matter tracts as measured by thefractional anisotropy (FA) parameter of diffusion tensor imaging. Gaze error variability was significantly correlatedwith the mean FA values of the right anterior corona radiata (ACR) and the left superior cerebellar peduncle,tracts that support spatial processing and sustenance of attention, and the genu of the corpus callosum. Becausethe ACR and the genu are among the most frequently damaged white matter tracts in mTBI, the correlationsimply that gaze error variability during visual tracking may provide a useful screening tool for mTBI. Gaze errorvariability was also significantly correlated with attention and working memory measures in neurocognitive testing;thus, measurement of visual tracking performance is promising as a fast and practical screening tool for mTBI.Keywords: Attention Network Test (ANT), California Verbal Learning Test, 2nd edition (CVLT-II), diffuse axonal injury(DAI), hemispheric specialization, head injury, neuroimaging, neuropsychology, prefrontal cortex, smooth pursuit, traumaticaxonal injuryTRAUMATIC BRAIN INJURY (TBI), often simplyreferred to as head injury, occurs when an externalforce causes damage to the brain. A common pathological feature of TBI includes distributed injury in the subcortical white matter, or diffuse axonal injury (DAI), thatmay occur with or without focal injury.1–5 Concussion,a mild form of TBI (mild TBI or mTBI), may involveDAI.6 Although DAI is difficult to detect by traditionalcomputed tomography and magnetic resonance imaging (MRI) scans,7–11 histological and imaging methodshave demonstrated that DAI is prevalent in the frontallobes.1,2 The outcome of DAI is frequently strikinglysimilar to that after a focal damage to the frontal lobe,12and the cognitive symptoms of both types of injury include deficits associated with concentration, attention,Author Affiliations: Brain Trauma Foundation, New York (Drs Marutaand Ghajar); Department of Biological Science, SungkyunkwanUniversity, Suwon, Korea (Dr Suh); Departments of Radiology (Dr Niogi)and Neurological Surgery (Dr Ghajar), Weill-Cornell Medical College,New York; and Department of Radiology and Biomedical Imaging,University of California, San Francisco, California (Dr Mukherjee).This study was supported by Department of Defense grants W81XWH-08-10646 and W81XWH-08-2-0177 and James S. McDonnell Foundation grantfor the Cognitive Neurobiological Research Consortium in Traumatic BrainInjury. The authors thank Rachel Kolster and Ranjeeta Sarkar for technicalassistance with eye movement and cognitive testing, and Drs. Carl Johnsonand Robert Zimmerman for the clinical MRI analyses.Corresponding Author: Jamshid Ghajar, MD, PhD, Brain Trauma Foundation, 7 World Trade Center, 34th Floor, 250 Greenwich St, New York, NY10007 (ghajar@braintrauma.org).memory, and high-level executive functions such as planning and decision making.12–14 These symptoms are consistent with postconcussive syndrome, subtle cognitivedeficits that can lead to chronic disability.15–19 Becausethe probability and the degree of injury are considered tobe proportional to the shear strain and the frontal lobesare highly susceptible to deformation,20,21 the functionaldeficits associated with mTBI may involve microstructural changes in the frontal white matter.Results of magnetic resonance diffusion tensor imaging (DTI), a powerful new tool for detecting microstructural changes in white matter8,9 and its severity,22–24 corroborate the prevalence of DAI in mTBI in the frontallobes25–28 although more widely distributed microstructural changes may take place. Of the several quantitativeparameters that can be derived from DTI,29 fractionalanisotropy (FA) is considered to be a robust indicator of white matter microstructural integrity.8,9,22–28,30–35In a parallel fiber arrangement of a white matter tract,the diffusion of water molecules is directionally constrained, which results in a high FA value. The theoreticalrange of FA values is from 0 (isotropic) to 1 (completelyanisotropic); the larger the value of the index, the greaterthe white matter structural alignment. Because FA is acontinuous measure, the spectrum of TBI-induced whitematter changes24 can be evaluated along the extension ofthe same FA axis that characterizes the normal population. In this comparison, a tract with a large deviation inthe FA value can be interpreted as damaged. In particular,293Copyright 2010 Lippincott Williams & Wilkins. Unauthorized reproduction of this article is prohibited.
294JOURNAL OF HEAD TRAUMA REHABILITATION/JULY–AUGUST 2010Niogi et al27 found that, among the population of 34mTBI subjects with chronic postconcussive syndrome,including the 17 with eye movement data comprisingthe present report, the most frequently damaged whitematter tracts were the anterior corona radiata (ACR), theuncinate fasciculus, the genu of the corpus callosum, andthe cingulum bundle.Important insights into postinjury cognitive functionsmay be provided by neuropsychological tests. However,these measures require lengthy testing sessions and maybe best suited for moderate to severe forms of TBI.14,36–38In addition, although a characteristic of TBI is frequentlapses of attention,39,40 traditional measures that use discrete responses would not detect momentary lapses inattention. Because attention varies over time, relativelycontinuous measures of performance should be usedto gauge moment-to-moment fluctuations in attentionwithin individuals.41A supplement to conventional neuropsychologicaltesting in mTBI subjects may be found in the examination of visual tracking performance.42 With videooculography, eye movement can be monitored easily,precisely, and continuously. Visual tracking of a moving target, which involves both smooth and saccadicelements to match the eye and target motions, requires integration of multiple sensory inputs as wellas one’s own motor efforts.43 Visual tracking also requires cognitive processes such as selection of the target,sustenance of attention, spatiotemporal memory, andexpectation.44–46 Because these complex requirementsinvolve a broadly distributed neural system, impairedvisual tracking behavior by itself may not implicate injury to a unique location in the brain. However, in thepresence of structural changes in the white matter, the associated cognitive dysfunctions are expected to manifestthemselves as deficits in the individual’s performance.Given the suspected vulnerability of frontal white matter in mTBI, examination of visual tracking performancemay provide a valuable and sensitive tool for assessment of functional as well as structural impairments inmTBI.The use of a circular target trajectory is exceptionally suited for assessing visual tracking performance.47,48With a target traveling at a constant velocity with a fixedradius from the center, the motion can be described withonly 2 constants. That is, the target movement is highlypredictable. This periodic movement can continue indefinitely within the orbital range of the eye, whichmakes the stimulus particularly suitable for studying theprocesses required to maintain predictive visual tracking.Predictive visual tracking requires both attention andworking memory.46 The prefrontal cortex is considered to be an important substrate for these cognitivefunctions,49 and these functions are often compromisedin mTBI patients.15–17,19,50 Because the right prefrontalcortex subserves spatial working memory51 and sustenance of attention,49,52 the integrity of the fiber tractsthat connect to and from this region, in particular, theright ACR, was suspected to be correlated with the performance of predictive visual tracking.Although previously not reported as vulnerable tomTBI, the forceps major and the superior cerebellar peduncle (SCP) subserve visuomotor functions. Hence, theintegrity of these tracts was also suspected to be correlated with visual tracking performance. The forcepsmajor mediates smooth pursuit eye movements by interconnecting bilateral middle temporal and medial superior temporal areas.53 The SCP is the cerebellar output ofprefrontal cerebellar loops. The crossed cerebrocerebellar connections suggest that the cerebellar counterpart ofthe prefrontal functions are localized contralaterally.54,55Therefore, in connection with the right prefrontal cortical functions, the integrity of the left SCP was suspectedto be correlated with the performance of predictivevisual tracking.Our goal was to determine whether performance variability during visual tracking can provide a useful screening measure for mTBI. Because TBI is known to increaseintraindividual performance variability in visuomotortasks,39,40 we quantified the variability of visual trackingperformance. Correlating and combining this cognitiveparameter with anatomical quantification of the whitematter microstructure in mTBI using DTI would providea practical method to gauge the severity of mTBI.METHODSParticipantsSeventeen mTBI subjects (10 males, 7 females) withchronic postconcussive syndrome (PCS), aged 20 to 52years, with the history of injury between 6 weeks and 5years (mean 2.7 years) before testing were recruited (Table1). The conditions for inclusion were blunt, isolated TBI,posttraumatic amnesia, and a Glasgow Coma Scale scoreof 13 to 15 at time of injury. The conditions for exclusionwere pregnancy, a history of neurological or psychiatricdiagnosis, seizure (before the injury), or drug or alcoholabuse. The mTBI subjects were recruited through referrals from local concussion clinics. Nine healthy subjects(6 males, 3 females) aged 19 to 31 years, with no priorhistory of TBI were recruited as controls through advertisements distributed in the community. Potential subjects were screened before enrollment in the study. Theexperimental protocol was approved by the Internal Review Board of Weill Cornell Medical College, and allsubjects provided informed consent before testing.Copyright 2010 Lippincott Williams & Wilkins. Unauthorized reproduction of this article is prohibited.
Visual Tracking Synchronization as a Metric295Demographic data for subjects with mTBI and summary of conventional clinicalMRI findingsTABLE 1SubjectsAge (y)SexGCS scoreTime since TBI (mo)Conventional MRI 23M1564.6Mild white matter gliosisUnremarkableNormalHemorrhagic shear injuryFocal hemorrhagic contusion; cerebellaratrophy; microhemorrhagesFoci of white matter ischemic changeUnremarkableNormalNormalSmall focus of shear injury in anterior limb ofinternal capsuleRight inferior temporal lobe contusion;microhemorrhageSmall left frontal chronic cortical hemorrhagiccontusionNormalIschemic white matter changeNormalCraniotomy/craniectomy; encephalomalacia;hemosiderin depositionNormalAbbreviations: GCS, Glasgow Coma Scale; MRI, magnetic resonance imaging; mTBI, mild traumatic brain injury; TBI, traumatic braininjury.Measures and procedureEye movement recording and analysisEye movements were recorded binocularly with avideo-oculography device (EyeLink II, SR Research,Osgoode, Ontario, Canada) at 500-Hz sampling frequency. Before testing, an eye chart was used to verifythat the subject had normal or corrected-to-normal vision. The visual stimulus was presented on a computerscreen 40 cm from the subject, and the subject’s headwas stabilized with a head- and chin-rest during the experiment (Fig 1a). The subject was instructed to visuallytrack a target presented on the computer screen. Calibration based on 9 fixation points whose boundary encompassed the test stimulus was performed before eachtrial. The test stimulus consisted of a target, a red circleof 0.2 diameter in visual angle, moving clockwise in acircular trajectory of 8.5 radius at 0.4 Hz for 10 to 12cycles on a black background.Analyses of eye movement data were conducted using a custom-made MATLAB program (The MathWorks,Natick, MA). The eye and target positions were expressedin visual angle. Blinks and other events during which thepupil was occluded were detected and excluded from theanalysis. The data segments for the first cycle were excluded because they included a transient response tothe initial target movement. To compensate for smallunwanted camera translation relative to the face duringeye movement recording, the offsets were estimated withpolynomial fits of horizontal and vertical eye positionsand subtracted from the data.The eye position data were differentiated to obtaineye velocity, which was then smoothed with a 10-pointmoving average filter. The eye velocity data were differentiated to obtain eye acceleration, which was furthersmoothed with a 5-point moving average filter. Saccadeswere detected with velocity and acceleration thresholdsof 100 /s and 1500 /s2 , respectively, and the saccadesegments in the velocity data were replaced with straightlines connecting the remaining segments. Gain is defined as the ratio between the eye and target velocities.To obtain the smooth pursuit gain, sine curves with thefrequency of the circular movement of the target werefit to the horizontal and vertical eye velocities using fastFourier transformation, and the ratios between the eyeand target velocities in the horizontal and vertical directions were computed. When a subject was tested withmultiple trials, the gain values were averaged.To visualize the variability of gaze positional errorsrelative to the target, the target position was expressedin polar coordinates, and the gaze positions were recomputed in a reference frame in which the target waswww.headtraumarehab.comCopyright 2010 Lippincott Williams & Wilkins. Unauthorized reproduction of this article is prohibited.
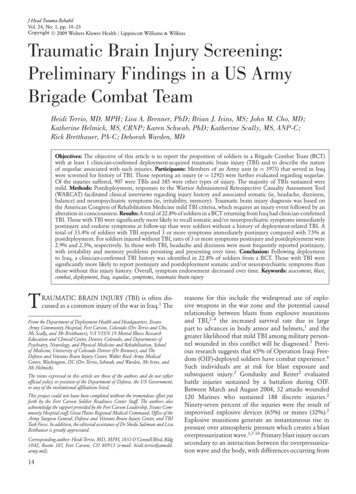
296JOURNAL OF HEAD TRAUMA REHABILITATION/JULY–AUGUST 2010Figure 1. (a) Experimental setup. (b) Schematic definition ofparameters. The target, moving clockwise along a circular trajectory (dot-dashed curve), is at the 12 o’clock position. Thedifference between the gaze and the target positions (gaze error)are indicated by the phase difference and the vectoral components in the radial and tangential directions.fixed at the 12 o’clock direction (Fig 1b). In this reference frame, the distance between the origin and thegaze represented the instantaneous radius of the gazetrajectory, and the angle formed by the vertical axisand the gaze vector represented the phase difference between the target and the gaze (phase error). The positivephase error was defined as the gaze leading the target(ie, the gaze being ahead of the target along the target’spath).Performance variability in the visual tracking behavior was characterized by the standard deviation (SD) ofgaze positional errors relative to the target. The variability in the radial direction was defined as the SD of gazeerrors perpendicular to the target trajectory, whereas thevariability in the tangential direction was defined as theSD of gaze errors along the target trajectory. To facilitatecomparison, the error variability measures are expressedin visual angle for both the radial and tangential directions. The radial error corresponds to the deviation inthe radius from the circular trajectory, and the tangentialerror is proportional to the phase error.Neurocognitive testsThe Attention Network Test56 (ANT) is a languageindependent measure of the efficiency of the neurocognitive networks involved in alerting, orienting, and executive attention based on changes in the reaction timesresulting from different types of prompts. The California Verbal Learning Test, 2nd edition (CVLT-II, Pearson,San Antonio, TX) is a verbal learning and memory test,in which examinees are read a list of words and askedto recall them across a series of trials. Seven normal and12 mTBI subjects took the ANT, and 7 normal and 13mTBI subjects took the CVLT-II. In total, 5 normal and10 mTBI subjects completed the ANT, the CVLT-II, andthe visual tracking test. The reasons for the incompleteness were technical problems or voluntary withdrawalsby the subjects.The results of the ANT and visual tracking performances were compared for the subset of subjects whotook both tests (7 normal, 12 mTBI). Based on the assumption that cognitive deficits exist on a spectrum, andbecause the ANT scores are continuous measures for different attentional components, the data for the normaland mTBI subjects were analyzed together (n 19).Similarly, the results of the CVLT-II and visual tracking performances were compared for the subset of subjects who took both tests (7 normal, 13 mTBI). Jacobsand Donders36 reported that the total recall discriminability and recognition discriminability indices of theCVLT-II varied meaningfully with the degree of severityof TBI; thus, we used these indices for the comparisons.Because these indices are continuous measures of verbal memory, the data for the normal and mTBI subjectswere analyzed together (n 20).Magnetic resonance imaging/diffusion tensor imagingAll subjects underwent MRI and DTI with a 3 Tesla GESigna EXCITE scanner (GE Healthcare, Waukesha, WI)equipped with 8-channel phased-array head coils. Themethodological details and the results of the scans wereincluded in previous publications.27,35 Briefly, wholebrain DTI was performed with a multisection single-shotspin-echo echo-planar pulse sequence (echo time 63ms, repetition time 14 seconds) using 55 diffusionencoding directions, isotropically distributed over thesurface of a sphere with electrostatic repulsion, acquisition at b 1000 s/mm2 , 1 at b 0 s/mm2 , 72 interleavedslices of 1.8-mm thickness with no gap between slices, a128 128 matrix zero-filled to 256 256 during reconstruction, and a field of view of 230 mm. Images werepostprocessed offline using DTIstudio to calculate thediffusion tensor and FA maps.57 The results of conventional MRI were interpreted by board certified neuroradiologists. As described previously, the FA parameterof DTI was obtained for specific structures throughoutthe brain selected a priori as regions of interest (ROI).The FA values from the voxels within each ROI wereaveraged to obtain our index.A white matter structure was considered to be damaged if the FA value was less than the mean 2.5SDs of healthy control subjects analyzed for the previous publication.27 However, to examine the relationshipCopyright 2010 Lippincott Williams & Wilkins. Unauthorized reproduction of this article is prohibited.
Visual Tracking Synchronization as a Metric297between visual tracking performance and the integrity ofwhite matter tracts, the data for the normal and mTBIsubjects were analyzed together (n 26).Statistical analysesTwo-tailed Student’s t test and Pearson’s correlationcoefficient r were used to test for a group differenceand dependence between 2 parameters, respectively. Allcomparisons were considered pairwise. A statistical difference or a correlation was considered to be significantfor P less than .05.RESULTSGeneral characteristicsGood visual tracking was characterized by smooth sinusoidal modulation of eye positions without large saccades (Fig 2A-a) and high-velocity gains (c, d). The radius of the gaze trajectory was nearly constant over time(b, e) and the corresponding histogram had a sharp peak(f). The fluctuations in the phase errors were also small(g, h). Overall, the gaze positions were tightly clusteredaround the target (i).In contrast, poor visual tracking of mTBI subjects wasgenerally characterized by the presence of large saccades(Fig 2B-a) and low-velocity gains (c, d). The radius of thegaze trajectory was uneven (b) and fluctuated over timewith both saccadic jumps and smooth changes (e). A directional preponderance of these components was notevident. The corresponding histogram showed a widespread (f). The phase errors were typically modulatedwith a sawtooth waveform (g) with the fast componentsbeing saccades directed in the direction of the targetmovement, the majority of which placed the gaze aheadof the target (phase error 0). The presence of residualvelocity with a positive gain indicated that, after landingahead of the target, the gaze continued to move in the direction of the target movement at a velocity slower thanthe target instead of completely stopping or reversingthe direction to meet it. Corresponding to the amplitude of modulation, the histogram of phase errors alsoshowed a wide spread (h). Overall, the gaze positions relative to the target were widely spread along the circularpath (i).The horizontal and vertical smooth pursuit gains ofnormal subjects were 0.94 0.055 (mean SD) and0.83 0.16, respectively, whereas those of mTBI subjects were 0.86 0.20 and 0.74 0.24, respectively(Fig 3a, b). Student’s t test did not reveal a significant difference between the 2 subject groups. The mean phaseerror of the normal subjects was 2.3 1.6 and thatof the mTBI subjects was 4.9 8.2 (Fig 3c). Student’st test did not reveal a significant difference between the2 subject groups.Figure 2. (A) Example of a good performance by a normalsubject (N02). (B) Example of a poor performance by a mildtraumatic brain injury subject (T17). (A, B) a: Horizontal andvertical eye positions in relation to time. b: Two-dimensionaltrajectory of the gaze superimposed over the 9 cycles shownin (a). c, d: Horizontal and vertical eye velocities in relationto time. The superimposed white curves indicate sine fits.e: Radius of gaze trajectory in relation to time. f: Histogramof gaze radius distribution. g: Phase error in relation to time.h: Histogram of phase error distribution. i: Scattergram of gazepositions relative to the target fixed at the 12 o’clock position.The white circle indicates the average gaze position. The dotdashed curve indicates the circular path. In (a, c, d, e, g), thegray vertical strips indicate blinks.Intraindividual performance variabilityPerformance variability was associated with inaccurate visual tracking. The intraindividual gaze positionalerror variability was examined in 2 orthogonal directions defined relative to the target trajectory. The variability measures for radial errors for the normal andmTBI subjects were 0.9 0.4 and 1.4 0.5 , respectively (Fig 3d). The variability measures for tangentialerrors for the normal and mTBI subjects were 1.1 0.6 and 2.4 1.3 , respectively (Fig 3e). Although thedistributions of these error variability measures of the2 subject groups overlapped, Student’s t test revealedwww.headtraumarehab.comCopyright 2010 Lippincott Williams & Wilkins. Unauthorized reproduction of this article is prohibited.
298JOURNAL OF HEAD TRAUMA REHABILITATION/JULY–AUGUST 2010Other cortical tracts vulnerable to mTBIOf the 17 mTBI subjects, 3 sustained damage in thegenu of the corpus callosum (Table 2). The variabilitymeasures for the radial and tangential errors were bothsignificantly correlated with the FA values of this structure (Fig 4b, Table 3) with r 0.54 and 0.53 (P .0042 and .0052), respectively.The variability measures for the radial and tangentialerrors were correlated with the FA values of the left uncinate fasciculus with r 0.42 and 0.43, respectively(P .030 for both). The variability measures for the radial and tangential errors were correlated with the FAvalues of the right uncinate fasciculus with r 0.45and 0.38 (P .021 and .052), respectively. The variability measures were not significantly correlated withthe FA values of the cingulum bundle (Table 3).Forceps major and SCPFigure 3. Histogram distribution of visual tracking performance parameters expressed in percentages of the subjectpopulations. (a) Horizontal smooth pursuit velocity gain.(b) Vertical smooth pursuit velocity gain. (c) Mean phase error.(d) Radial error variability. (e) Tangential error variability.significant group differences (radial: P .014; tangential: P .002). None of the 9 normal subjects exceeded 1.5 in radial error variability, whereas 9 of the17 mTBI subjects did so, and none of the normal subjects exceeded 1.9 in tangential error variability, whereas11 of the mTBI subjects did so. The variability measures of radial and tangential errors were closely correlated with each other (r 0.90, P 10 9 , n 26, allsubjects combined), but the tangential error variabilitywas significantly larger than the radial error variability(P .00013, n 26, paired t test).Correlations with DTI FA valuesAnterior corona radiataOf the 17 mTBI subjects, 11 sustained damage in theACR and 10 of these cases involved the right ACR (Table2). The variability measures for the radial and tangentialerrors were both significantly correlated with the FA values of the right ACR (Fig 4a, Table 2) with r 0.44 and 0.50 (P .024 and .0094), respectively, larger variability being associated with poorer white matter alignment.The variability measures were not correlated significantlywith the FA values of the left ACR (Table 3).Significant correlations were found between the gazeerror variability and the integrity of the forceps majorof both hemispheres (Table 3). The variability measuresfor the radial and tangential errors were correlated withthe FA values of the left forceps major with r 0.42and 0.43 (P .035 and .027), respectively. The variability measures for the radial and tangential errors werecorrelated with the FA values of the right forceps major with r 0.52 and 0.53 (P .0069 and .0054),respectively.The variability measures for the radial and tangentialerrors were both significantly correlated with the FA values of the left SCP (Fig 4c, Table 3) with r 0.59 and 0.67 (P .0016 and .00020), respectively. The variability measures were not correlated significantly withthe FA values of the right SCP (Table 3).Centrality measures of visual tracking and FA valuesThe horizontal and vertical pursuit gains and the meanphase error were significantly correlated with the FAvalues of the left SCP with r 0.52, 0.57, and 0.49(P .0059, .0025, and .011), respectively, with lowergains and a larger phase error being associated withpoorer white matter alignment. In comparison, neitherthe pursuit gain nor the mean phase error was significantly correlated with the FA values of the right SCP.Neither the pursuit gain nor the mean phase error wassignificantly correlated with the FA values of either theright or the left ACR. The horizontal and vertical pursuitgains were correlated with the FA value of the genu ofthe corpus callosum with r 0.47 and 0.42 (P .014 and.035), respectively. The horizontal pursuit gain was correlated with the FA value of the right uncinate fasciculuswith r 0.39 (P .05).Copyright 2010 Lippincott Williams & Wilkins. Unauthorized reproduction of this article is prohibited.
Visual Tracking Synchronization as a MetricTABLE 2299Frequency distribution of damaged tracts in subjects with mTBITracts not known tobe vulnerable to mTBITracts vulnerable to 3T24T26T27T29T30CountMean FA (controls)2.5 SD thresholdLeftRightXXXXUncinatefasciculusGenu 57Abbreviations: ACR, anterior corona radiata; FA, fractional anisotropy; mTBI, mild traumatic brain injury; SCP, superior cerebellar peduncle.Figure 4. Relationships between fractional anisotropy (FA) values and visual tracking performance variability. (a) Right anteriorcorona radiata (ACR). (b) Genu of the corpus callosum (CC). (c) Left superior cerebellar peduncle (SCP). Top panels: radialerror variability. Bottom panels: tangential error variability. The regression lines were determined from the combined subjectpopulation.www.headtraumarehab.comCopyright 2010 Lippincott Williams & Wilkins. Unauthorized reproduction of this article is prohibited.
300JOURNAL OF HEAD TRAUMA REHABILITATION/JULY–AUGUST 2010TABLE 3Correlations between FA values and visual tracking performance variabilityRadialerror variabilityROITangentialerror variabilityrPrPLeftRightLeftRight 0.21 0.44 0.54 0.42 0.45 0.280.03NS .05 .01 .05 .05NSNS 0.14 0.50 0.53 0.43 0.38 0.27 0.02NS .01 .01 .05NSNSNSTracts not known to be vulnerable to mTBIForceps majorLeftRightSCPLeftRight 0.42 0.52 0.59 0.14 .05 .01 .01NS 0.43 0.53 0.67 0.25 .05 .01 .001NSTracts vulnerable to mTBIACRGenu of corpus callosumUncinate fasciculusCingulum bundleLeftRightAbbreviations: ACR, anterior corona radiata; FA, fractional anisotropy; mTBI, mild traumatic brain injury; ROI, region of interest; SCP,superior cerebellar peduncle.Correlations with neurocognitive testsAttention Network TestThe overall mean reaction time in the ANT was significantly correlated with the variability measures for boththe radial and tangential visual tracking errors (Fig 5a)with r 0.60 and 0.54 (P .0061 and .016), respectively, with longer reaction times being associated withlarger visual tracking variability. Th
Visual Tracking Synchronization as a Metric 295 TABLE 1 entionalclinical MRI findings Subjects Age (y) Sex GCS .