Transcription
E6893 Big Data Analytics Lecture 3:Big Data Analytics Algorithms — IChing-Yung Lin, Ph.D.Adjunct Professor, Dept. of Electrical Engineering and Computer ScienceSeptember 24, 20211E6893 Big Data Analytics – Lecture 3: Storage and Processing 2021 CY Lin, Columbia University
Key Components of (basically retired) Mahout in Hadoop2E6893 Big Data Analytics – Lecture 3: Big Data Analytics Algorithms 2021 CY Lin, Columbia University
Key Components of Spark MLlib3E6893 Big Data Analytics – Lecture 3: Big Data Analytics Algorithms 2021 CY Lin, Columbia University
Spark ML Basic Statistics!Correlation: Calculating the correlationbetween two series of data is a commonoperation in Statistics4 Pearson’s Correlation Spearman’s CorrelationE6893 Big Data Analytics – Lecture 3: Big Data Analytics Algorithms 2021 CY Lin, Columbia University
Example of Popular Similarity MeasurementsPearson Correlation SimilarityEuclidean Distance SimilarityCosine Measure SimilaritySpearman Correlation SimilarityTanimoto Coefficient Similarity (Jaccard coefficient)Log-Likelihood Similarity5E6893 Big Data Analytics – Lecture 3: Big Data Analytics Algorithms 2021 CY Lin, Columbia University
Pearson Correlation SimilarityData:missingdata6E6893 Big Data Analytics – Lecture 3: Big Data Analytics Algorithms 2021 CY Lin, Columbia University
On Pearson SimilarityThree problems with the Pearson Similarity:1. Not take into account of the number of items in which twousers’ preferences overlap. (e.g., 2 overlap items 1,more items may not be better.)2. If two users overlap on only one item, no correlation canbe computed.3. The correlation is undefined if either series of preferencevalues are identical.Adding Weighting.WEIGHTED as 2nd parameter of the constructor can cause theresulting correlation to be pushed towards 1.0, or -1.0, depending on how manypoints are used.7E6893 Big Data Analytics – Lecture 3: Big Data Analytics Algorithms 2021 CY Lin, Columbia University
Spearman Correlation SimilarityExample for tiesPearson value on the relative ranks8E6893 Big Data Analytics – Lecture 3: Big Data Analytics Algorithms 2021 CY Lin, Columbia University
Basic Spark Data formatData: 1.0, 0.0, 3.0// straightforward// number of parameters, location of non-zero indices, and non-zero values// number of parameters, Sequence of non-value values (index, value)9E6893 Big Data Analytics – Lecture 3: Big Data Analytics Algorithms 2021 CY Lin, Columbia University
Correlation Example in Spark1.0, 0.0, 0.0, -2.04.0, 5.0, 0.0, 3.06.0, 7.0, 0.0, 8.09.0, 0.0, 0.0, 1.010E6893 Big Data Analytics – Lecture 3: Big Data Analytics Algorithms 2021 CY Lin, Columbia University
Euclidean Distance SimilaritySimilarity 1 / ( 1 d )11E6893 Big Data Analytics – Lecture 3: Big Data Analytics Algorithms 2021 CY Lin, Columbia University
Cosine SimilarityCosine similarity and Pearson similarity get the same results if data arenormalized (mean 0).12E6893 Big Data Analytics – Lecture 3: Big Data Analytics Algorithms 2021 CY Lin, Columbia University
Caching User SimilaritySpearman Correlation Similarity is time consuming.Need to use Caching remember s user-user similarity which was previously computed.13E6893 Big Data Analytics – Lecture 3: Big Data Analytics Algorithms 2021 CY Lin, Columbia University
Tanimoto (Jaccard) Coefficient SimilarityDiscard preference valuesTanimoto similarity is the same as Jaccard similarity. But,Tanimoto distance is not the same as Jaccard distance.14E6893 Big Data Analytics – Lecture 3: Big Data Analytics Algorithms 2021 CY Lin, Columbia University
Log-Likelihood SimilarityAsses how unlikely it is that the overlap between the two users is just due to chance.15E6893 Big Data Analytics – Lecture 3: Big Data Analytics Algorithms 2021 CY Lin, Columbia University
Performance measurementsUsing GroupLens data (http://grouplens.org): 10 million rating MovieLens dataset.Spearnman: 0.8Tanimoto: 0.82Log-Likelihood: 0.73Euclidean: 0.75Pearson (weighted): 0.77Pearson: 0.8916E6893 Big Data Analytics – Lecture 3: Big Data Analytics Algorithms 2021 CY Lin, Columbia University
Spark ML Basic Statistics!Hypothesis testing: Hypothesis testing is apowerful tool in statistics to determinewhether a result is statistically significant.Spark ML currently supports Pearson’s Chisquared (χ2) tests for independence.!ChiSquareTestconducts Pearson’sindependence test for every feature againstthe label.17E6893 Big Data Analytics – Lecture 3: Big Data Analytics Algorithms 2021 CY Lin, Columbia University
Chi-Square tml18E6893 Big Data Analytics – Lecture 3: Big Data Analytics Algorithms 2021 CY Lin, Columbia University
Chi-Square tml19E6893 Big Data Analytics – Lecture 3: Big Data Analytics Algorithms 2021 CY Lin, Columbia University
Chi-Square TestsWe would reject the null hypothesis that there is no relationship betweenlocation and type of malaria. Our data tell us there is a relationshipbetween type of malaria and re.html20E6893 Big Data Analytics – Lecture 3: Big Data Analytics Algorithms 2021 CY Lin, Columbia University
Chi-Square Tests in Spark21E6893 Big Data Analytics – Lecture 3: Big Data Analytics Algorithms 2021 CY Lin, Columbia University
Spark ML Clustering22E6893 Big Data Analytics – Lecture 3: Big Data Analytics Algorithms 2021 CY Lin, Columbia University
Example: clusteringFeatureSpace23E6893 Big Data Analytics – Lecture 3: Big Data Analytics Algorithms 2021 CY Lin, Columbia University
Clustering24E6893 Big Data Analytics – Lecture 3: Big Data Analytics Algorithms 2021 CY Lin, Columbia University
Clustering — on feature plane25E6893 Big Data Analytics – Lecture 3: Big Data Analytics Algorithms 2021 CY Lin, Columbia University
Clustering example26E6893 Big Data Analytics – Lecture 3: Big Data Analytics Algorithms 2021 CY Lin, Columbia University
Steps on clustering27E6893 Big Data Analytics – Lecture 3: Big Data Analytics Algorithms 2021 CY Lin, Columbia University
Making initial cluster centers28E6893 Big Data Analytics – Lecture 3: Big Data Analytics Algorithms 2021 CY Lin, Columbia University
K-mean clustering29E6893 Big Data Analytics – Lecture 3: Big Data Analytics Algorithms 2021 CY Lin, Columbia University
HelloWorld clustering scenario result30E6893 Big Data Analytics – Lecture 3: Big Data Analytics Algorithms 2021 CY Lin, Columbia University
Testing difference distance measures31E6893 Big Data Analytics – Lecture 3: Big Data Analytics Algorithms 2021 CY Lin, Columbia University
Manhattan and Cosine distances32E6893 Big Data Analytics – Lecture 3: Big Data Analytics Algorithms 2021 CY Lin, Columbia University
Tanimoto distance and weighted distance33E6893 Big Data Analytics – Lecture 3: Big Data Analytics Algorithms 2021 CY Lin, Columbia University
Results comparison34E6893 Big Data Analytics – Lecture 3: Big Data Analytics Algorithms 2021 CY Lin, Columbia University
Sample code of K-mean clustering in Spark35E6893 Big Data Analytics – Lecture 3: Big Data Analytics Algorithms 2021 CY Lin, Columbia University
vectorization example0: weight1: color2: size36E6893 Big Data Analytics – Lecture 3: Big Data Analytics Algorithms 2021 CY Lin, Columbia University
Canopy clustering to estimate the number of clustersTell what size clusters to look for. The algorithm will find the number of clusters that haveapproximately that size. The algorithm uses two distance thresholds. This method prevents allpoints close to an already existing canopy from being the center of a new canopy.37E6893 Big Data Analytics – Lecture 3: Big Data Analytics Algorithms 2021 CY Lin, Columbia University
Other clustering algorithmsHierarchical clustering38E6893 Big Data Analytics – Lecture 3: Big Data Analytics Algorithms 2021 CY Lin, Columbia University
Different clustering approaches39E6893 Big Data Analytics – Lecture 3: Big Data Analytics Algorithms 2021 CY Lin, Columbia University
Spark ML Classification and Regression40E6893 Big Data Analytics – Lecture 3: Big Data Analytics Algorithms 2021 CY Lin, Columbia University
Spark ML Classification and Regression41E6893 Big Data Analytics – Lecture 3: Big Data Analytics Algorithms 2021 CY Lin, Columbia University
Classification — definition42E6893 Big Data Analytics – Lecture 3: Big Data Analytics Algorithms 2021 CY Lin, Columbia University
Classification example: using SVM to recognize a ToyotaCamryNon-MLRule 1.Symbol hassomething likebull’s heaRule 2.Big blackportion in front ofcarRule 3. .?ML — Support Vector MachineFeatureSpacePositive SVsNegative SVsE6893 Big Data Analytics – Lecture 3: Big Data Analytics Algorithmsd.43 2021 CY Lin, Columbia University
Classification example: using SVM to recognize a ToyotaCamryML — Support Vector MachinePositive SVsPCamry 0.95FeatureSpaceNegative SVs44E6893 Big Data Analytics – Lecture 3: Big Data Analytics Algorithms 2021 CY Lin, Columbia University
When to use Big Data System for classification?45E6893 Big Data Analytics – Lecture 3: Big Data Analytics Algorithms 2021 CY Lin, Columbia University
The advantage of using Big Data System for classification46E6893 Big Data Analytics – Lecture 3: Big Data Analytics Algorithms 2021 CY Lin, Columbia University
How does a classification system work?47E6893 Big Data Analytics – Lecture 3: Big Data Analytics Algorithms 2021 CY Lin, Columbia University
Key terminology for classification48E6893 Big Data Analytics – Lecture 3: Big Data Analytics Algorithms 2021 CY Lin, Columbia University
Input and Output of a classification model49E6893 Big Data Analytics – Lecture 3: Big Data Analytics Algorithms 2021 CY Lin, Columbia University
Four types of values for predictor variables50E6893 Big Data Analytics – Lecture 3: Big Data Analytics Algorithms 2021 CY Lin, Columbia University
Sample data that illustrates all four value types51E6893 Big Data Analytics – Lecture 3: Big Data Analytics Algorithms 2021 CY Lin, Columbia University
Supervised vs. Unsupervised Learning52E6893 Big Data Analytics – Lecture 3: Big Data Analytics Algorithms 2021 CY Lin, Columbia University
Work flow in a typical classification project53E6893 Big Data Analytics – Lecture 3: Big Data Analytics Algorithms 2021 CY Lin, Columbia University
Classification Example 1 — Color-Fill54Position looks promising, especially the x-axis predictor variable.Shape seems to be irrelevant. Target variable is “color-fill” label.E6893 Big Data Analytics – Lecture 3: Big Data Analytics Algorithms 2021 CY Lin, Columbia University
Classification Example 2 — Color-Fill (another feature)55E6893 Big Data Analytics – Lecture 3: Big Data Analytics Algorithms 2021 CY Lin, Columbia University
Fundamental classification algorithmsExample of fundamental classification algorithms: Naive BayesianComplementary Naive BayesianStochastic Gradient Descent (SDG)Random ForestSupport Vector Machines56E6893 Big Data Analytics – Lecture 3: Big Data Analytics Algorithms 2021 CY Lin, Columbia University
Choose algorithm57E6893 Big Data Analytics – Lecture 3: Big Data Analytics Algorithms 2021 CY Lin, Columbia University
Stochastic Gradient Descent (SGD)58E6893 Big Data Analytics – Lecture 3: Big Data Analytics Algorithms 2021 CY Lin, Columbia University
Characteristic of SGD59E6893 Big Data Analytics – Lecture 3: Big Data Analytics Algorithms 2021 CY Lin, Columbia University
Support Vector Machine (SVM)maximize boundary distances; remembering “support vectors”60nonlinear kernelsE6893 Big Data Analytics – Lecture 3: Big Data Analytics Algorithms 2021 CY Lin, Columbia University
Example SVM code in Spark61E6893 Big Data Analytics – Lecture 3: Big Data Analytics Algorithms 2021 CY Lin, Columbia University
Naive BayesTraining set:Classifier using Gaussian distribution assumptions:Test Set: female62E6893 Big Data Analytics – Lecture 3: Big Data Analytics Algorithms 2021 CY Lin, Columbia University
Random ForestRandom forest uses a modified tree learning algorithm that selects, at each candidatesplit in the learning process, a random subset of the features.63E6893 Big Data Analytics – Lecture 3: Big Data Analytics Algorithms 2021 CY Lin, Columbia University
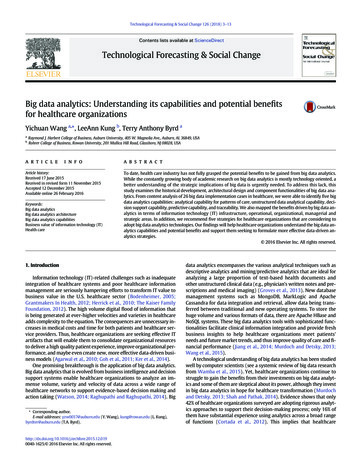
Adaboost Example Adaboost [Freund and Schapire 1996 Constructing a “strong” learner as alinear combination of weak learner- Start with a uniform distribution (“weights”) over training examples(The weights tell the weak learning algorithm which examples are important- Obtain a weak classifier from the weak learning algorithm, hjt:X {-1,1- Increase the weights on the training examples that were misclassifie- (Repeat))}d]s64
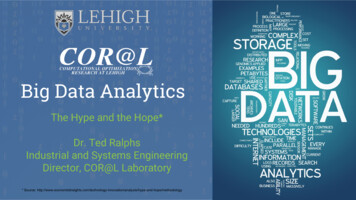
Example — User Modeling using Time-Sensitive Adaboost Obtain simple classifier on each feature, e.g., setting threshold onparameters, or binary inference on input parameters. The system classify whether a new document is interested by a personvia Adaptive Boosting (Adaboost) The final classifier is a linear weighted combination of singlefeature classifiers. Given the single-feature simple classifiers, assigning weights onthe training samples based on whether a sample is correctly ormistakenly classified. Boosting. Classifiers are considered sequentially. The selected weights inprevious considered classifiers will affect the weights to beselected in the remaining classifiers. Adaptive. According to the summed errors of each simple classifier, assign aweight to it. The final classifier is then the weighted linearcombination of these simple classifiers. Our new Time-Sensitive Adaboost algorithm In the AdaBoost algorithm, all samples are regarded equallyimportant at the beginning of the learning procesEach attribute is asimple classifier usedin Adaboost.We propose a time-adaptive AdaBoost algorithm that assignslarger weights to the latest training sampless::.65 People select applesaccording to theirshapes, sizes, otherpeople’s interest, etc
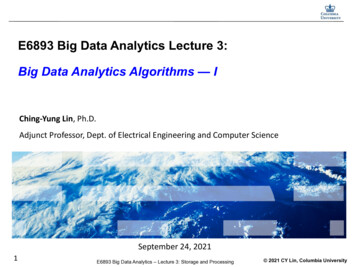
Time-Sensitive Adaboost [Song, Lin, et al. 2005]66
Evaluate the modelAUC (0 1):1 — perfect0 — perfectly wrong0.5 — randomconfusion matrix67E6893 Big Data Analytics – Lecture 3: Big Data Analytics Algorithms 2021 CY Lin, Columbia University
Homework #1 (Due 10/8/2021, 5pm)See TA’s instruction:Task 1: Clustering (60%)Task 2: Hadoop System Monitoring (40%)68E6893 Big Data Analytics – Lecture 3: Big Data Analytics Algorithms 2021 CY Lin, Columbia University
Questions?69E6893 Big Data Analytics – Lecture 3: Analytics Algorithms 2021 CY Lin, Columbia University
64 Adaboost Example - Start with a uniform distribution ("weights") over training examples (The weights tell the weak learning algorithm which examples are important)