Transcription
E6893 Big Data Analytics Lecture 4:Big Data Analytics Algorithms — IIChing-Yung Lin, Ph.D.Adjunct Professor, Dept. of Electrical Engineering and Computer ScienceOctober 1st, 20211E6893 Big Data Analytics – Lecture 4: Big Data Analytics Algorithms 2021 CY Lin, Columbia University
A schematic view of AI, ML, and Big Data Analyticscitation: For course discussions only; copying or forwarding prohibited 2020 CYLin Columbia Univ.
Spark ML Classification and Regression3E6893 Big Data Analytics – Lecture 4: Big Data Analytics Algorithms 2021 CY Lin, Columbia University
Spark ML Classification and Regression4E6893 Big Data Analytics – Lecture 4: Big Data Analytics Algorithms 2021 CY Lin, Columbia University
Spark ML Pipeline Example5E6893 Big Data Analytics – Lecture 4: Big Data Analytics Algorithms 2021 CY Lin, Columbia University
Spark ML Pipeline terms6E6893 Big Data Analytics – Lecture 4: Big Data Analytics Algorithms 2021 CY Lin, Columbia University
Spark ML Pipeline E6893 Big Data Analytics – Lecture 4: Big Data Analytics Algorithms 2021 CY Lin, Columbia University
Spark Tokenizer8E6893 Big Data Analytics – Lecture 4: Big Data Analytics Algorithms 2021 CY Lin, Columbia University
Spark Tokenizer9E6893 Big Data Analytics – Lecture 4: Big Data Analytics Algorithms 2021 CY Lin, Columbia University
Vectorization of textVector Space Model: Term Frequency (TF)Stop Words:Stemming:10E6893 Big Data Analytics – Lecture 4: Big Data Analytics Algorithms 2021 CY Lin, Columbia University
Spark StopWordsRemover11E6893 Big Data Analytics – Lecture 4: Big Data Analytics Algorithms 2021 CY Lin, Columbia University
Spark StopWordsRemover12E6893 Big Data Analytics – Lecture 4: Big Data Analytics Algorithms 2021 CY Lin, Columbia University
Most Popular Stemming algorithms13E6893 Big Data Analytics – Lecture 4: Big Data Analytics Algorithms 2021 CY Lin, Columbia University
n-gramIt was the best of time. it was the worst of times. bigramMahout provides a log-likelihood test to reduce the dimensions of n-grams14E6893 Big Data Analytics – Lecture 4: Big Data Analytics Algorithms 2021 CY Lin, Columbia University
N-gram code example15E6893 Big Data Analytics – Lecture 4: Big Data Analytics Algorithms 2021 CY Lin, Columbia University
Word2VecThe Word2VecModel transforms each document into a vector using the average of all wordsin the document; this vector can then be used as features for prediction, documentsimilarity calculations, etc.16E6893 Big Data Analytics – Lecture 4: Big Data Analytics Algorithms 2021 CY Lin, Columbia University
CountVectorizerCountVectorizer and CountVectorizerModel aim to help convert a collection of text documents to vectorstoken counts. When an a-priori dictionary is not available, CountVectorizer can be used as an Estimator toextract the vocabulary, and generates a CountVectorizerModel. The model produces sparse representationthe documents over the vocabulary, which can then be passed to other algorithms like LDA.17E6893 Big Data Analytics – Lecture 4: Big Data Analytics Algorithms 2021 CY Lin, Columbia University
CountVectorizer18E6893 Big Data Analytics – Lecture 4: Big Data Analytics Algorithms 2021 CY Lin, Columbia University
FeatureHasherFeature hashing projects a set of categorical or numerical features into a feature vector ofspeci ed dimension (typically substantially smaller than that of the original feature space). This isdone using the hashing trick to map features to indices in the feature vector.The FeatureHasher transformer operates on multiple columns. Each column may contain eithernumeric or categorical features. Behavior and handling of column data types is as follows: Numeric columns: For numeric features, the hash value of the column name is used to mapthe feature value to its index in the feature vector. By default, numeric features are nottreated as categorical (even when they are integers). To treat them as categorical, specifythe relevant columns using the categoricalCols parameter. String columns: For categorical features, the hash value of the string “column name value”is used to map to the vector index, with an indicator value of 1.0. Thus, categorical featuresare “one-hot” encoded (similarly to using OneHotEncoder with dropLast false). Boolean columns: Boolean values are treated in the same way as string columns. That is,boolean features are represented as “column name true” or “column name false”, with anindicator value of 1.0.Null (missing) values are ignored (implicitly zero in the resulting feature vector).fi19E6893 Big Data Analytics – Lecture 4: Big Data Analytics Algorithms 2021 CY Lin, Columbia University
FeatureHasher20E6893 Big Data Analytics – Lecture 4: Big Data Analytics Algorithms 2021 CY Lin, Columbia University
Term Frequency — Inverse Document Frequency (TF-IDF)The value of word is reduced more if it is used frequently across all the documents in the dataset.or21E6893 Big Data Analytics – Lecture 4: Big Data Analytics Algorithms 2021 CY Lin, Columbia University
An alternative variation of IDF22E6893 Big Data Analytics – Lecture 4: Big Data Analytics Algorithms 2021 CY Lin, Columbia University
TF-IDF exampleTFIDF (using the alternative formula)23E6893 Big Data Analytics – Lecture 4: Big Data Analytics Algorithms 2021 CY Lin, Columbia University
TF-IDF24E6893 Big Data Analytics – Lecture 4: Big Data Analytics Algorithms 2021 CY Lin, Columbia University
Examples — using a news corpusReuters-21578 dataset: 22 files, each one has 1000 documents except the last ctions/ reuters21578/Extraction code:25E6893 Big Data Analytics – Lecture 4: Big Data Analytics Algorithms 2021 CY Lin, Columbia University
Spark ML Pipeline Example Code I26E6893 Big Data Analytics – Lecture 4: Big Data Analytics Algorithms 2021 CY Lin, Columbia University
Spark Clustering27E6893 Big Data Analytics – Lecture 5: Big Data Analytics Algorithms 2020 CY Lin, Columbia University
Clustering — Gaussian Mixture Models28E6893 Big Data Analytics – Lecture 5: Big Data Analytics Algorithms 2021 CY Lin, Columbia University
Gaussian Mixture Model29E6893 Big Data Analytics – Lecture 5: Big Data Analytics Algorithms 2021 CY Lin, Columbia University
Gaussian Mixture Model30E6893 Big Data Analytics – Lecture 5: Big Data Analytics Algorithms 2021 CY Lin, Columbia University
Gaussian Mixture Model — EMExpectation maximization (EM) is a numerical technique for maximum likelihood estimation,and is usually used when closed form expressions for updating the model parameters can becalculated (which will be shown below). Expectation maximization is an iterative algorithm andhas the convenient property that the maximum likelihood of the data strictly increases witheach subsequent iteration, meaning it is guaranteed to approach a local maximum or xture-model/31E6893 Big Data Analytics – Lecture 5: Big Data Analytics Algorithms 2021 CY Lin, Columbia University
Gaussian Mixture Model spark code32E6893 Big Data Analytics – Lecture 5: Big Data Analytics Algorithms 2021 CY Lin, Columbia University
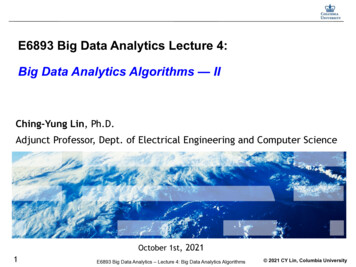
Content Analysis - Latent DirichletAllocation (LDA) [Blei et al. 2003]Goal – categorize the documents into topics! Each document is a probability distribution over topics! Each topic is a probability distribution over wordsmone0.8knbaloanbankDOCUMENT 1: money1 bank1 bank1 loan1 river2 stream2 bank1money1 river2 bank1 money1 bank1 loan1money1 stream2bank1 money1 loan1 river2 stream2 bank1 money1loanyyneobank mloanTOPIC 1riverkerir v banstrreamvir estreambankTOPIC 2Mixturecomponents330.30.2DOCUMENT 2: loan1 river2 stream2 loan1 bank2 river2 bank2bank1stream2 river2 loan1 bank2 stream2 bank2 money1loan1 river2 stream2 bank2 stream2 bank2 money1 river20.7MixtureweightsThe probability of ith word in a given documentTP (wi ) P (wi zi j ) P (zi j )j 1The probability of the word The probability of choosing a word fromthe jth topic in the current documentφw( j )wi under the jth topic θ (j d )E6893 Big Data Analytics – Lecture 5: Big Data Analytics Algorithms 2021 CY Lin, Columbia University
LDA (cont.)INPUT: document-word counts D documents, W wordsBayesian approach: use priorsMixture weights Dirichlet( α )Mixture components Dirichlet( β )αOUTPUT: likely topics for a documentθP( z w) P (w z ) P (z )z!!Parameters can be estimated byGibbs SamplingβOutperform Latent SemanticAnalysis (LSA) and ProbabilisticLSA in various experiments [Bleiet al. 2003]34E6893 Big Data Analytics – Lecture 5: Big Data Analytics AlgorithmsφTwWD: ObservationsT: number of topics 2021 CY Lin, Columbia University
Spark ML LDA code example35E6893 Big Data Analytics – Lecture 5: Big Data Analytics Algorithms 2021 CY Lin, Columbia University
Classification — definition36E6893 Big Data Analytics – Lecture 4: Big Data Analytics Algorithms 2021 CY Lin, Columbia University
Spark ML Pipeline Example — classifier37E6893 Big Data Analytics – Lecture 4: Big Data Analytics Algorithms 2021 CY Lin, Columbia University
Spark ML Pipeline Example Code II38E6893 Big Data Analytics – Lecture 4: Big Data Analytics Algorithms 2021 CY Lin, Columbia University
How does a classification system work?39E6893 Big Data Analytics – Lecture 4: Big Data Analytics Algorithms 2021 CY Lin, Columbia University
Evaluate the modelAUC (0 1):1 — perfect0 — perfectly wrong0.5 — randomconfusion matrix40E6893 Big Data Analytics – Lecture 3: Big Data Analytics Algorithms 2021 CY Lin, Columbia University
Average Precision — commonly used in sorted results‘Average Precision’is the metric that isused for evaluating‘sorted’ results.— commonly usedfor search &retrieval, anomalydetection, etc.Average Precision average of theprecision values ofall correct answersup to them, i.e., calculatingthe precision valueup to the Top n‘correct’ answers.Average all Pn.41E6893 Big Data Analytics – Lecture 4: Big Data Analytics Algorithms 2020 CY Lin, Columbia University
Confusion Matrix42E6893 Big Data Analytics – Lecture 4: Big Data Analytics Algorithms 2021 CY Lin, Columbia University
Number of Training Examples vs Accuracy43E6893 Big Data Analytics – Lecture 4: Big Data Analytics Algorithms 2021 CY Lin, Columbia University
Classifiers that go bad44E6893 Big Data Analytics – Lecture 4: Big Data Analytics Algorithms 2021 CY Lin, Columbia University
Target leak A target leak is a bug that involves unintentionally providing data about the target variable inthe section of the predictor variables. Don’t confused with intentionally including the target variable in the record of a trainingexample. Target leaks can seriously affect the accuracy of the classification system.45E6893 Big Data Analytics – Lecture 4: Big Data Analytics Algorithms 2021 CY Lin, Columbia University
Example: Target Leak46E6893 Big Data Analytics – Lecture 4: Big Data Analytics Algorithms 2021 CY Lin, Columbia University
Avoid Target Leaks47E6893 Big Data Analytics – Lecture 4: Big Data Analytics Algorithms 2021 CY Lin, Columbia University
Avoid Target Leaks — II48E6893 Big Data Analytics – Lecture 4: Big Data Analytics Algorithms 2021 CY Lin, Columbia University
Imperfect Learning for Autonomous Concept ModelingLearningReference: C.-Y. Lin et al., SPIE EI West, 200549E6893 Big Data Analytics – Lecture 4: Big Data Analytics Algorithms 2021 CY Lin, Columbia University
A solution for the scalability issues at training.Autonomous Learning of Video Concepts through Imperfect Training Labels:Develop theories and algorithms for supervised concept learning from imperfect annotations -imperfect learningDevelop methodologies to obtain imperfect annotation – learning from cross-modality information orweb linksDevelop algorithms and systems to generate concept models – novel generalized Multiple-InstanceLearning algorithm with Uncertain Labeling DensityAutonomous Concept 6893 Big Data Analytics – Lecture 4: Big Data Analytics Algorithms 2021 CY Lin, Columbia University
What is Imperfect Learning?Definitions from Machine Learning Encyclopedia:Supervised learning:a machine learning technique for creating a function from training data.The training data consists of pairs of input objects and desired outputs.The output of the function can be a continuous value (called regression), or can predict aclass label of the input object (called classification).Predict the value of the function for any valid input object after having seen only a smallnumber of training examples.The learner has to generalize from the presented data to unseen situations in a"reasonable" way.Unsupervised learning:a method of machine learning where a model is fit to observations.It is distinguished from supervised learning by the fact that there is no a priori output.A data set of input objects is gathered. Unsupervised learning then typically treats inputobjects as a set of random variables.A joint density model is then built for the data set.Proposed Definition of Imperfect Learning:A supervised learning technique with imperfect training data.The training data consists of pairs of input objects and desired outputs. There may be error ornoise in the desired output of training data.The input objects are typically treated as a set of random variables.51E6893 Big Data Analytics – Lecture 4: Big Data Analytics Algorithms 2021 CY Lin, Columbia University
Why do we need Imperfect Learning?Annotation is a Must for Supervised Learning.All (or almost all?) modeling/fusion techniques in our group used annotation for trainingHowever, annotation is time- and cost- consuming.Previous focuses were on improving the annotation efficiency – minimum GUIinteraction, template matching, active learning, etc.Is there a way to avoid annotation?Use imperfect training examples that are obtained automatically/unsupervisedly fromother learning machine(s).These machines can be built based on other modalities or prior machines on relateddataset domain.Autonomous Concept n ’03]52E6893 Big Data Analytics – Lecture 4: Big Data Analytics Algorithms 2021 CY Lin, Columbia University
PropositionSupervised Learning " Time consuming; Spend a lot of time to do the annotationUnsupervised continuous learning " When will it beat the supervised learning?accuracy of Testing Modelaccuracy of Training Data53# of Training DataE6893 Big Data Analytics – Lecture 4: Big Data Analytics Algorithms 2021 CY Lin, Columbia University
Recap: Classification example: using SVM to recognize aToyota CamryNon-MLRule 1.Symbol hassomething likebull’s heaRule 2.Big blackportion in front ofcarRule 3. .?ML — Support Vector MachineFeatureSpacePositive SVsNegative SVsE6893 Big Data Analytics – Lecture 3: Big Data Analytics Algorithmsd.54 2021 CY Lin, Columbia University
The key objective of this paper – can concept models belearned from imperfect labeling?Example: The effect of imperfect labeling on classifiers (left - right: perfect labeling,imperfect labeling, error classification area)55E6893 Big Data Analytics – Lecture 4: Big Data Analytics Algorithms 2021 CY Lin, Columbia University
False positive Imperfect LearningAssume we have ten positive examples and ten negative examples. if 1 positive example iswrong (false positive), how will it affect SVM? Will the system break down? Will theaccuracy decrease significantly?If the ratio change, how is the result?Does it depend on the testing set?If time goes by and we have more and more training data, how will it affect? In whatcircumstance, the effect of false positive will decrease? In what situation, the effect offalse positive will still be there?Assume the distribution of features of testing data is similar to the training data. When will it56E6893 Big Data Analytics – Lecture 4: Big Data Analytics Algorithms 2021 CY Lin, Columbia University
Imperfect LearningIf learning example is not perfect, what will be the result?If you teach something wrong, what will be the consequence?Case 1: False positive onlyCase 2: False positive and false negativeCase 3: Learning example has confidence value57E6893 Big Data Analytics – Lecture 4: Big Data Analytics Algorithms 2021 CY Lin, Columbia University
From Hessienberg’s Uncertainty Theory From Hessienberg’s Uncertainty Theory, everything is random. It is not measurable. Thus,we can assume a random distribution of positive ones and negative ones. Assume there are two Gaussians in the feature space. One is positive. The other one isnegative. Let’s assume two situations. The first one: every positive is from positive and everynegative is from negative. The second one: there may be some random mistake in thenegative. Also, let’s assume two cases. 1. There are overlap between two Gaussians. 2. There arenot. So, maybe these can be derived to become a variable based on mean and sigma. If the training samples of SVM are random, how will be the result? Is it predictable with aclosed mathematical form? How about using linear example in the beginning and then use the random examplesnext?58E6893 Big Data Analytics – Lecture 4: Big Data Analytics Algorithms 2021 CY Lin, Columbia University
False Positive Samples Will false positive examples become support vectors? Very likely. We can also assume a r.v.here. Maybe we can also using partially right data Having more weighting on positive ones. Then for the uncertain ones having fewer chance to become support vector Will it work if, when support vector is picked, we take the uncertainty as a probability? Or, shouldwe compare it to other support vectors? This can be an interesting issue. It’s like humanbrain. The first one you learn, you remember it. The later ones you may forget about it. Themore you learn the more it will be picked. The fewer it happens, it will be more easilyforgotten. Maybe I can even develop a theory to simulate human memory. Uncertainty can be a time function. Also, maybe the importance of support vector can be a timefunction. So, sometimes machine will forget things. " This make it possible to adapt andadjustable to outside environment. Maybe I can develop a theory of continuous learning Or, continuous learning based on imperfect memory In this way, the learning machine will be affected mostly by the current data. For those ‘old’ data,it will put less weighting " may reflect on the distance function. Our goal is to have a very large training set. Remember a lot of things. So, we need to learn toforget.59E6893 Big Data Analytics – Lecture 4: Big Data Analytics Algorithms 2021 CY Lin, Columbia University
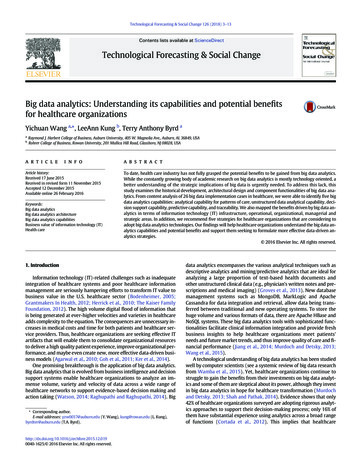
Imperfect Learning: theoretical feasibility Imperfect learning can be modeled as theissue of noisy training samples onsupervised learning. Learnability of concept classifiers can bedetermined by probably approximationclassifier (pac-learnability) theorem. Given a set of “fixed type” classifiers, thepac-learnability identifies a minimumbound of the number of training samplesrequired for a fixed performance request. If there is noise on the training samples,the above mentioned minimum bound canbe modified to reflect this situation. The ratio of required sample isindependent of the requirement ofclassifier performance. Observations: practical simulations usingSVM training and detection also verify thistheorem.A figure of theoretical requirementof the number of sample needed fornoisy and perfect training samples60E6893 Big Data Analytics – Lecture 4: Big Data Analytics Algorithms 2021 CY Lin, Columbia University
PAC-identifiable PAC-identifiable: PAC stands for probably approximate correct.Roughly, it tells us a class of concepts C (defined over an input spacewith examples of size N) is PAC learnable by a learning algorithm L,if for arbitrary small δ and ε, and for all concepts c in C, and for alldistributions D over the input space, there is a 1-δ probability that thehypothesis h selected from space H by learning algorithm L isapproximately correct (has error less than ε).PrD (PrX ( h( x ) c( x )) ε ) δ Based on the PAC learnability, assume we have m independentexamples. Then, for a given hypothesis, the probability that mexamples have not been misclassified is (1-e)m which we want to beless than δ. In other words, we want (1-e)m δ. Since for any 0 x 1, (1-x) e-x , we then have:1 1m ln( )ε δ61E6893 Big Data Analytics – Lecture 4: Big Data Analytics Algorithms 2021 CY Lin, Columbia University
Sample Size v.s. VC dimensionTheorem 2 Let C be a nontrivial, well-behaved concept class. If the VC dimension of C is d,where d , then for 0 e 1 and42 8d13m max( log 2 , log 2 )εδ εεany consistent function A: ScC is a learning function for C, and,for 0 e 1/2, m has to be larger than or equal to a lower bound, 1 ε 1 m max ln( ), d (1 2ε (1 δ ) 2δ )) δ ε For any m smaller than the lower bound, there is no function A: ScH, for any hypothesisspace H, is a learning function for C. The sample space of C, denoted SC, is the set of all62E6893 Big Data Analytics – Lecture 4: Big Data Analytics Algorithms 2021 CY Lin, Columbia University
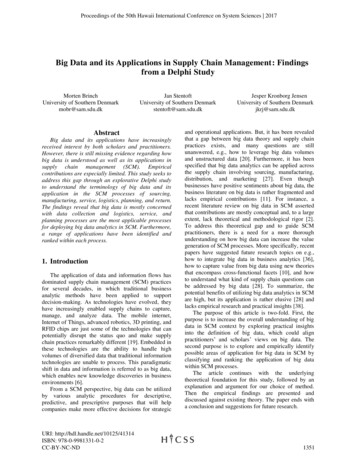
How many training samples are required? Examples of training samples required in different error bounds forPAC-identifiable hypothesis. This figure shows the upper bounds andlower bounds at Theorem 2. The upper bound is usually refereed assample capacity, which guarantees the learnability of trainingsamples.63E6893 Big Data Analytics – Lecture 4: Big Data Analytics Algorithms 2021 CY Lin, Columbia University
Noisy SamplesTheorem 4 Let h 1/2 be the rate of classification noise and N the number of rules in theclass C. Assume 0 e, h 1/2. Then the number of examples, m, required is at leastand at most ln(2δ )m max ,log 2 N (1 2ε (1 δ ) 2δ )) ln(1 ε (1 2η )) ln( N / δ )ε (1 exp( 12 (1 2η ) 2 ))r is the ratio of the required noisy training samples v.s. the noise-free training samplesrη (1 exp( 12 (1 2η ) 2 )) 164E6893 Big Data Analytics – Lecture 4: Big Data Analytics Algorithms 2021 CY Lin, Columbia University
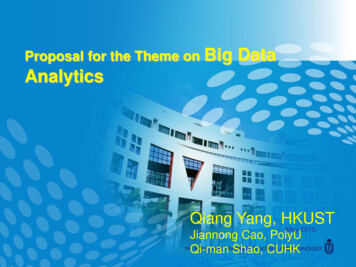
Training samples required when learning from noisyexamplesRatio of the training samples required to achieve PAC-learnability under the noisy andnoise-free sampling environments. This ratio is consistent on different error boundsand VC dimensions of PAC-learnable hypothesis.65E6893 Big Data Analytics – Lecture 4: Big Data Analytics Algorithms 2021 CY Lin, Columbia University
Learning from Noisy Examples on SVMFor an SVM, we can find the bounded VC dimension:d min( Λ 2 R 2 1, n 1)66E6893 Big Data Analytics – Lecture 4: Big Data Analytics Algorithms 2021 CY Lin, Columbia University
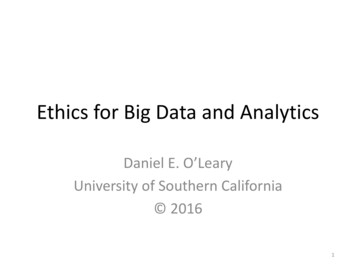
Experiments - 1Examples of the effect of noisy training examples on the model accuracy. Threerounds of testing results are shown in this figure. We can see that modelperformance does not have significant decrease if the noise probability in thetraining samples is larger than 60% - 70%. And, we also see the reverse effectof the training samples if the mislabeling probability is larger than 0.5.67E6893 Big Data Analytics – Lecture 4: Big Data Analytics Algorithms 2021 CY Lin, Columbia University
Experiments – 2:Experiments of the effect of noisy training examples on the visual concept modelaccuracy. Three rounds of testing results are shown in this figure. We simulatedannotation noises by randomly change the positive examples in manualannotations to negatives. Because perfect annotation is not available, accuracyis shown as a relative ratio to the manual annotations in [10]. In this figure, wesee the model accuracy is not significantly affected for small noises. A similardrop on the training examples is observed at around 60% - 70% of annotationaccuracy (i.e., 30% - 40% of missing annotations).68E6893 Big Data Analytics – Lecture 4: Big Data Analytics Algorithms 2021 CY Lin, Columbia University
ConclusionImperfect learning is possible.In general, the performance of SVM classifiers do not degrade too much if themanual annotation accuracy is larger than about 70%.Continuous Imperfect Learning shall have a great impact in autonomouslearning scenarios.69E6893 Big Data Analytics – Lecture 4: Big Data Analytics Algorithms 2021 CY Lin, Columbia University
Future of AI Full Function Brain CapabilityMost of existing “AI”technology is only a keyfundamental component. Machine Learning: ML and Deep Learning Autonomous Imperfect Learning Machine Cognition: Robot Cognition Tools Feeling Robot-HumanInteraction Machine Reasoning: BayesianNetworks Game TheoryTools Advanced Visualization: Dynamic andInteractive Viz. Big Data Viz.recognitionperception Graph Analytics: Network Analysis Flow gymemory Graph Database: DistributedNative Database70E6893 Big Data Analytics – Lecture 4: Big Data Analytics Algorithms 2021 CY Lin, Columbia University
Evolution of Artificial IntelligenceFuture ayerSensorLayer: observations71: hidden statesE6893 Big Data Analytics – Lecture 4: Big Data Analytics AlgorithmsMost of Today’s AI 2021 CY Lin, Columbia University
Event Detection BaselineTraining VideosFeature ExtractionsClassifiersLow-level featureSIFT (Visual)Attempting board trickSTIP (Motion)Feeding an animalMFCC (Audio) Mid-level lyFusion SVMOutputLanding a fish72Big Data Analytics Lecture 4: Big Data Analytics Algorithm 2021 CY Lin, Columbia University
Mid-level Feature Representation Decompose an event into conceptsspeechpersonsoundrunningjumping73Big Data Analytics Lecture 4: Big Data Analytics Algorithmboardparkstreet 2021 CY Lin, Columbia University
Events Classification FrameworkEvent ClassifierPair-Activity Event ClassifierEmbrace Key framesPeopleMeet ClassifierPersonRuns eSplitUpPostprocessingDetected PersonRunsPreliminary Events74Detected PeopleMeetBig Data Analytics Lecture 4: Big Data Analytics AlgorithmEvent IdentifyingBackwards SearchForwards Search 2021 CY Lin, Columbia University
75Big Data Analytics Lecture 4: Big Data Analytics Algorithm 2021 CY Lin, Columbia University
Examples of our Previous work on Abnormal Video EventAnalysisEvent: Abnormal Behavior(Surveillance Video)TRECVID Surveillance Event Detection(SED) Evaluation 2008-2016Event: Making a bomb(Consumer Video)TRECVID Multimedia Event Detection(MED) Evaluation 2010-201676Big Data Analytics Lecture 4: Big Data Analytics Algorithm 2021 CY Lin, Columbia University
Detection and Tracking of Head, Shoulder, and Body77Big Data Analytics Lecture 4: Big Data Analytics Algorithm 2021 CY Lin, Columbia University
Detection Results78Big Data Analytics Lecture 4: Big Data Analytics Algorithm 2021 CY Lin, Columbia University
Questions?79E6893 Big Data Analytics – Lecture 4: Big Data Analytics Algorithms 2020 CY Lin, Columbia University
3 E6893 Big Data Analytics – Lecture 4: Big Data Analytics Algorithms 2021 CY Lin, C