Transcription
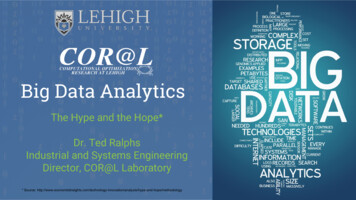
Big Data AnalyticsThe Hype and the Hope*Dr. Ted RalphsIndustrial and Systems EngineeringDirector, COR@L Laboratory* Source: tion/analysis/hype-and-hope/methodology
Introduction andMotivation
Goals We’ll survey the landscape surrounding“big data” and “big analytics”.This is a huge and amorphous agenda.Many things will necessarily be left out ordescribed only briefly.The goal is to cut through the hype andsee what is really happening.The perspective we’ll take is a bit“broader” than the usual answer to “whatis big /resolve/2013v2/index.html
What are we talking about? This talk is about technology for extracting insight from data.Academics and practitioners have been doing this for decades (Tukey).The problems we’re now struggling to solve are not new.What has changed is the scale. Potentially valuable data is being produced by a huge range of new sources sensors and smart devices medical records social media transactional data pictures, video Web application dataMore importantly, technologies now exist that allow us to store, move, and process the data.When data can no longer be maintained on a single computer at a singlelocation, lots of things become more difficult (techniques are not scalable)On the other hand, analysis that really requires big data may now be feasiblewhen it was not before.
What do we mean by “insight”?Description, prediction, prescription, recognition, recommendation/advice .Data contains (hidden) knowledgeknowledge valueWe are looking for patterns in the data that are difficult for a human to see, yield unexpected insights, can be used to explain observed phenomena, and lead to the development of “models” for prediction andinformed decision-making.
Summarizing data Descriptive analytics summarize the dataand are fundamental to insight.We can describe data by producingsummary statistics and visualizations.The goal is to get a first glimpse of whatinformation the data contains.Example: collegescorecard.ed.gov This huge data set contains a wealth ofinformation about college costs and outcomes. The graph at right is from an article in the NewYork Times on the gender earnings gap.source: a.html
Insight from visualizationssource: http://hint.fmsource: https://www.jasondavies.com/wordtree/?source https%3A%2F%2Fen.wikipedia.org%2Fwiki%2FDeep learning&prefix Deep
Making predictionsSource: http://www.100mdeep.com Predictive analytics go a step further andtry to extrapolate into the future.Simple Example: LendingClub.com Data Huge open data set of peer-to-peer loans. Beautiful interactive visualization of the data onhttp://www.100mdeep.com Succinctly summarizes a huge amount of data inan intuitive way.Historic trends are used to predict future trends. This is a simplistic example of bothdescriptive and predictive methods.We will see more sophisticated ones later.
Making data-driven decisions Prescriptive analytics use data to help us make optimaldecisions.Example: Google Maps driving directions This is a great example of real-time decision-making usingstreaming data to both predict and prescribe. Historical traffic data and real-time information on road conditionsfrom users are used to predict travel time.The optimal route is chosen and updated throughout the trip.This is amazing stuff! Prescriptive analytics is the main strategic focus ofLehigh’s Industrial and Systems Engineering Department.
The scale of Big Data Every Minute: 227K Tweets72 Hours of Video uploaded to YouTube570 Web sites created100 million e-mails sent350 Gb data processed by Facebook47k apps downloaded from Apple34k Facebook likes350 blog postsIn 2012, 2.5 Exabytes of datagenerated every day.1 Exabyte 1000 Petabytes; 1Petabyte 1000 TeraBytes1 TeraByte 1000 GigaBytes1 DVD 4.7 GigaBytes
Do we always need “big” data? Not always! Sometimes yes, sometimes no.It depends on complexity of the “model.”We want to avoid fitting a complex model with a small amount of data.However, we also don’t want to fit a “simple” model with too much data.source: http://xkcd.com/904/What not to do
What is a “model”? In almost all big data applications, there is an underlying “model.”The “model” is a simplified version of the world that we can describe andanalyze more easily than the real world.The model is typically not complete---it has parameters and features weassume are unknown.Thus, we are selecting one from a set of possible models arising fromdifferent possible values of the parameters.We choose the fully specified model that fits “best” according to ourobserved data.Some models are very abstract and have little structure initially, while othersare concrete.
ExampleRecommendation systems (think Netflix) We have a collection of users and products.We also have ratings of some products by some users.How do we predict a missing rating (a product not yet rated by a user)?Model Assume products are described by “features” that determine a user’s rating.Use data to elicit what the “features” are and how important each feature is to each user. Note that we don’t even need to know what real-world properties of a product the featuresrepresent.Once we populate the parameters of the model (features and weights), wecan predict how existing users will rate new products.Next step: Predict how a brand new user will rate a given product (how?)
ExampleClustering/Classification We want to divide a group of “objects” into clusters that are similar. This could be used, for example, to divide customers into segments. Similarity Model Connectedness Model (Social Networks) Objects are described as tuples of “features” that each have a numerical value.For consumers, features could be credit score, salary, home location, work location, etc.We have a “distance” measure between two objects that we use to assess similarity.Groups that are all mutually close to each other are put in one set.Objects are people and/or things that we want to advertise.We only have lists of what objects are connected (friends, likes) to what other objects.Groups with a lot of interconnections are related/similar.We’ll see yet other models later.
ExampleImage recognition To recognize the components of an image, we have to build a simple modelof the physical objects around us.Model The physical world consists of “objects” with properties such as color, shape, texture, etc.To recognize the content of an image, we have to separate it into “objects” (edge detection).Each object has to be recognized by its properties as being of some “type.”Ideally, we want a set of examples that are already labeled, although it’spossible to do recognition even without any labeled data.The Internet is full of labeled photographs.
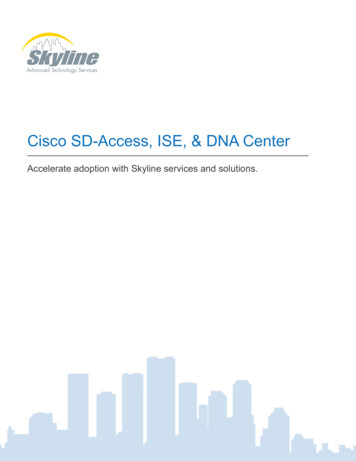
What Google think is “fish”Fish or not?
IntroductionE. Kim, X. Huang, G. Tan, Markup SVG - An Online Content Aware ImageAbstraction and Annotation Tool,'’Published in IEEE Trans. on Multimedia (TMM), 13(5):993-1006, 2011.
The Analytics Process
The analytics process The methods we informally introduced in the first part are all part of “theanalytics process.”You will find many descriptions of this process from different points of view.Almost all of them share some common steps.
Oracle’s process descriptionThese basic steps are distilled from a presentation by Oracle.1.2.3.4.Standard reporting (What happened?)Descriptive Analytics (How many? Where? When?)Query/Drill Down (What is the problem?)Predictive Analyticsa.b.5.Simulation (What could happen?)Forecasting (What will happen if current trends continue)?Prescriptive Analytics/Optimization (What is the best course of action?)source: are
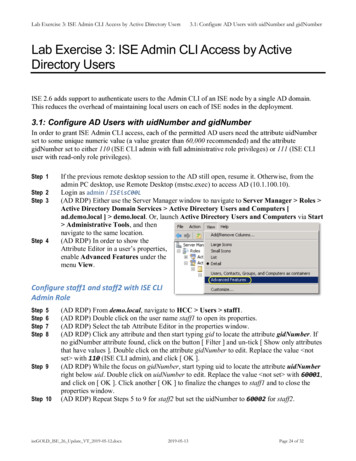
The INFORMS analytics process The figure below is taken from the Institute for Operations Research andManagement Science.It’s similar to the Oracle process, but shows that the process is really cyclic.source: ytics
Mason and Wiggins data process Mason and Wiggins espouse a five-step process. ObtainScrubExploreModelInterpretWhat is important to note here is the “model” step.This step is crucial and involves developing an idealized model of “how theworld works.”By tuning the parameters of this model, we try to reverse engineer theprocess that created the data.
Big Data and Big Analytics (Big) Data is the raw input to a cyclic process that extracts insight.Analytics is the process and the tools we can bring to bear on the data.Even simple procedures become a challenge when the data are “big.”On the other hand, more sophisticated analytics may be difficult, even with“small data.”Roughly speaking then, we can think of a two-step process. Distill the big data to something more manageable using techniques that scale to large datasets (dimensionality reduction).Apply more sophisticated analysis to the distilled data.Each of these steps requires distributed computing, but in the first case, thedata are distributed and in the second case, the computation is distributed.
Big Data AnalyticsDescriptive Analytics:Hadoop/Sparksource: p/mapreduce-workflow.pngPredictive and Prescriptive Analytics:Parallel Simulation/Optimizationsource: http://www.prace-ri.eu/
Big Data Challenges
Big challenges Where does the challenge of Big Data come from? The sheer amount of data is huge (Volume)The data is streaming and must be analyzed in real-time (Velocity)The data comes from many different sources in different forms (Variety)The data is unreliable (Veracity)Often, the questions we are trying to answer also require Big Computation.The traditional model of a single compute “core” with associated localmemory is not enough.
What does “scalability” mean? Why might things that work well at a small scale break down at large scale?Example: procedure to alphabetize books on a shelf Take all books off shelf.Scan to find first book in order and put it back on the shelf.Repeat.This is what you would do with a single bookshelf, but does it scale?What if you are sorting the books in an entire library?With big data problems, things may break for reasons as simple as nothaving fast access to all the data from one location.The cost ( and time) of moving data from one location to another is a bigdriver.
A more technical example Suppose you want to count the number of occurrences of each word in a setof documents. Read each document sequentially.Keep a separate list of all words seen so far with a count for each word.Increment the count as you encounter each word.Now suppose you want to do this for every page on the World Wide Web.Suppose you also want to have an inverted list containing all pages onwhich a given word appears.The naive approach no longer works.This is why Google invented MapReduce, the methodology behind Hadoop.We’ll discuss more about this later.
Breaking it downsource: http://arxiv.org/pdf/1509.02900v1.pdfThe following are primary Big Data challenge areas identified in a recentreport by the Fields Institute:1.2.3.4.5.6.Data WranglingVisualizationReducing DimensionalitySparsity and RegularizationOptimizationRepresentation Learning (Deep Learning, Feature Learning)a.b.7.supervisedunsupervisedSequential Learning (Distributed, On-line)
Giving data structure Often, the first step is simply to give the data some “structure”.Example: E-mail (Hillary Clinton) sIn pure text form, it’s unstructured.However, we can extract structure from the text Date Subject Sender Recipient BodyOnce we understand the structure, we can put the data in a database.This makes answering questions about the data quicker and easier.Scanned medical records are a similar but more complex example.
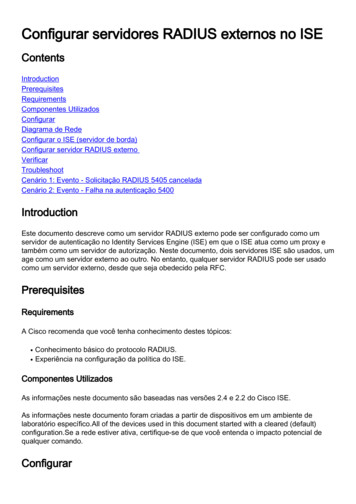
ExampleMining Transactional Data Walmart is an industry leader in “data warehousing” and miningtransactional data.Their data warehouse contains approximately 2.5 Petabytes of data.This includes not only transactional data but social network data, etc.Types of analysis Look for patterns in co-occurrence of purchases.Targeted advertising based on predicted purchases.Test different in-store promotions in each store and quickly propagate the ones that work.These are relatively simple things to analyze on a small scale, but.
source: part-dna/509Walmart’s Big Data ecosystem
Some Big Data application areasGeneral Recommendation systems Co-occurrence analysis Behavior discovery Classification/Machine learning Sorting/Indexing Search Network analysis ForecastingSpecific Image analysis Speech and hand-writing recognition Natural language processing Language translation Fraud detection Mining of social data Sentiment analysis Medical decision-making Portfolio analysisAlthough this seems like a highly divergent list, the tasks to beexecuted have much in common.
Big Analytics Challenges
Large-scale optimization Many (most?) prescriptive and predictive analytics problems involve solvingan underlying optimization problem.Often, we are selecting the predictive model that best fits the observed data. We may also be trying decide on a course of action. NetflixImage recognitionBased on projected demand, where should we locate stores?Based on consumer behavior, where should our advertising dollars be spent?Solving these difficult optimization problems is the research focuses of thethe COR@L Laboratory.
Example: Neural networks (M. Takac, F.Curtis) We try to build a predictor (function) that can map input to a correct output.Example: hand-writing recognition Input is a digitized sample of hand-writing.source: lOutput is the text it represents.We try to “learn” how to distinguish letters/numbers from each other by example.The algorithms are fashioned after how the human brain learns.
Example: Recommendation (K. Scheinberg) Let’s consider the Netflix example again.How do we determine the important “features” that determine someone’smovie choices?One way is to use a statistical technique called “principal componentsanalysis.”We build a table with columns being the movies and rows being the“features.”By solving an optimization problem, we construct a table that does the bestjob of predicting observed behavior and has a “small” number of rows.
Example: Facility location (L. Snyder, T.R.) The basic problem is where to locatefacilities.Potentially massive customer data.First step is to distill data: segmentcustomers, predict demand.Second step: locate facilities to maximizeservice level, minimize cost, .Involves modeling of customer preferencesfor products, facilities,.
Example: OR scheduling (R. Storer) “Optimal” scheduling of an OR isextremely challenging.First step is to estimate probabilitydistributions for surgery (big data)Second step is to determineschedule, taking into account patient waiting timesurgeon idle timestaff overtimeOptimal schedule involves balancingall costs across all scenarios“SIMULATION OF A MULTIPLE OPERATING ROOM SURGICAL SUITE”, Denton et.al., Proceedings of the 2006 Winter Simulation Conference, p 414.
Tools and Technologies
Types of tools Storage MapReduceData MiningSearchPredictive and Prescriptive Analytics Database/Data WarehousingDistributed FilesystemsData Aggregation and TransferDescriptive Analysis source: ingBusiness IntelligenceOptimization and Machine LearningProgramming and App Development
Parallel data processing: Hadoop, Spark, etc. Idea: Move the computation to thedataMapReduce paradigm Developed and popularized by GoogleEnables distributed big data analysisSpecify only 2 functions: MAP and REDUCE Framework takes care of everything else(distributed data, communications,.)High performance requires fastnetwork, purpose-built file systemFigure shows prototypical “wordcounting” application.source: http://dme.rwth-aachen.de/en/system/files/file upload/project/MapReduce.jpg
MapReduce is a standard in cloud computing
Parallel computation: MPI, Condor Many difficult optimization problemsare solved by distributed algorithms Search methods can often be parallelized(partition solution space). In iterative methods, we distribute thingslike function evaluation.We divide the computation amongmany computers to speed things up.“Dividing things up” sounds easy, butit really isn’t!Figuring out how to “divide things up”is the primary challenge.
Take-home messages Big Data Analytics challenges are driven mostly by scale. The challenge of Big Data can be because of high volume, high velocity, and/or high variety. The challenge of Big Analytics can be either because the data are big or the computationsrequired to get insight are large-scale or both.Overcoming the challenges of scale requires a host of new technologies Hardware: Storage, networkingSoftware: New programming paradigms, development environmentsMathematics: Development of fundamental techniques for mathematical analysisComputer Science: Development of algorithms that are more scalable and parallelizable.Big Data Analytics Big Data Big AnalyticsResearchers in ISE at Lehigh are focused on solving today’s most difficultanalytics challenge problems.
CreditsThanks to Frank E. CurtisKatya ScheinbergLarry SnyderBob StorerMartin TakacYou!
Questions?
Big Data and Big Analytics (Big) Data is the raw input to a cyclic process that extracts insight. Analytics is the process and the tools we can bring to bear on the data. Even simple procedures become a challenge when the data are "big." On the other hand, more sophisticated analytics may be difficult, even with "small data."