Transcription
9 Advanced andProfitable TradingStrategiesRoman Sadowski
9 Profitable Trading StrategiesPeople who succeed at day trading do three things very well:They identify intra-day trading strategies that are tried, tested.They are 100% disciplined in executing those strategies.They stick to a strict money management regime.Jump right to one you like, just click on itMomentum Reversal Trading StrategyRole Reversal Trading StrategyHeikin-Ashi Trading StrategyRSI Trading Strategy, 5 Systems Back Test ResultsThe Moving average crossover strategyThe swing day trading strategyCandlestick patternsThe Bollinger band squeeze strategyThe narrow range strategyThe 2 period RSI strategyBinary options trading strategy that generates 150% returnHumbleTraders
9 Profitable Trading StrategiesYou’re probably thinking:“How do I find intra-day trading strategies that actually work?”And Are there some day trading rules that will help me to trade forex,commodities, stocks?All you need to do is: set aside a few minutes of your day to tackle one of thefollowing forex day trading strategies which I outline for you below.The reality is this:Few people are successfully day trading forex or other markets for a living,That’s the uncomfortable fact of life that marketers don’t like to speak of!And those few people are most probably trading with other peoplesmoney, like traders working for a bank or a hedge fund.That means the stakes are not as high for them, as they are for aperson trading their own capital.That being said;There are intra-day trading strategies beginners can use to maximise theirchances to stay in the game for the long haul. These can be use in mostmarkets like forex, commodities or stocks.Because, ‘the long haul’ is where someone can turn theirinitial starting capital, into a retirement nest egg!HumbleTraders
9 Profitable Trading StrategiesSo, in this article I will show you everything you need to know to getstarted including:Awesome forex day trading strategies that are used successfullyevery day.The main chart patterns associated with these forex tradingstrategies.Instructions for implementing the strategies.Then I will tell you,How to manage your trading risk to stay in the game for the longhaul.The simple truth is.Learning to use and implement a basic intra-day trading strategies can cutyour losses by 63% immediately and will increase your profitability chancesin the long run.MUST READ: Few Things About Risk Management Forex TraderShould KnowSo lets get down to business!HumbleTraders
9 Profitable Trading Strategies1.Momentum Reversal Trading Strategy#1 The strategy seeks trading opportunities through the combination offundamental and technical analysis.#2 It requires a trader to analyse the fundamental aspects of the tradedcurrency to establish mid to long term trend first. Then it uses the pricemomentum, support and a resistance zones to spot market reversals.#3 The strategy allows to enter the market at low risk and provide a largeprofit potential through advanced money management.#4 All trades are planned in advance to give a trader enough time to enter themarket every time. Most trades are placed as pending limit orders oftenexecuted during London’s session.#5 The strategy works well on all major US Dollar crosses. It generatesbetween 1-5 signals per month. All trades are entered and held for anythingup to several weeks depending on the price action and the marketfundamentals.#6 The strategy has been traded in live markets for the last 15 months and itsperformance is clearly documented in the performance sectionThe strategy uses a few indicators only:1. Stochastic Oscillator ( multi-time frame)2. Support and resistance3. Fibonacci retracementsAfter establishing your bias and long term trend through Commitments ofTraders report, it’s time to switch to daily charts and look for a price reversalphase.HumbleTraders
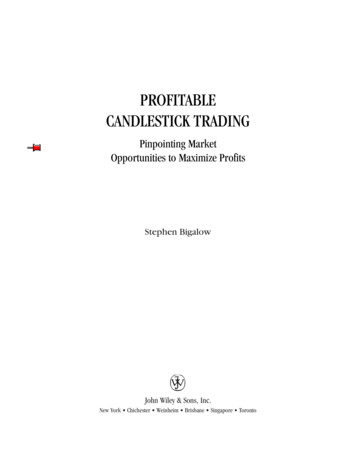
9 Profitable Trading StrategiesTo define the price reversal you need to analyse the price on daily charts firstand answer 3 simple questions:1. Has the market been clearly falling or rallying recently?2. Is the weekly and daily stochastic showing overbought or oversold levelson daily charts?3. Is the price trading around major support or resistance zones?Example 1: USDJPY – Daily chartIn the USDJPY chart above you can see four examples of the price being in areversal phase.Setup #1 on the chartWeekly and daily stochastics are above 70 zone and the market has been in asubstantial rally prior to that. A trader should be marking this zone as bearishand switching to intraday charts to seek a bearish reversal price pattern.HumbleTraders
9 Profitable Trading StrategiesSetup #2 on the chartSimilar to setup #1, price, after a few days of rally, it came back up to anoverbought stochastics zone ( above 70) and is now trading around a majorresistance zone. A trader will be marking this area as bearish and switching tointraday charts to seek a bearish reversal price pattern.Setup #3 on the chartOnce again, the momentum is now overbought and the price is forming aclear resistance. A trader will be marking this area as bearish and switching tointraday charts to seek a bearish reversal pattern.Setup #4 on the chartThe price declined and reached a support at 117 area. The momentum is nowoversold. A trader will be marking this area as bullish and switching tointraday charts to seek a bullish reversal price pattern.The above setups will be attempted only in the direction of the trendestablished by the trader during a fundamental analysis. The fundamentalswere pointing to the downside in USDJPY. The first 3 setups would beconsidered and the 4th would be either ignored or entered as a counter trendposition with a lower lot size.Fore more information CLICK HEREHumbleTraders
9 Profitable Trading Strategies2:The Moving average crossover strategy.What is it?Moving average indicators are standard within all trading platforms, theindicators can be set to the criteria that you prefer.For this simple day trading strategy we need three moving average lines,One set at 20 periods,the next set at 60 periodsand the last set at 100 periods.The 20 period line is our fast moving average, the 60 period is our slowmoving average and the 100 period line is the trend indicator.How do I trade with it?This day trading strategy generates a BUY signal when the fast movingaverage ( or MA) crosses up over the slower moving average.And a SELL signal is generated when the fast moving average crosses belowthe slow MA.So you open a position when the MA lines cross in a one direction and youclose the position when they cross back the opposite way.How do you know if the price is beginning to trend?Well, If the price bars stay consistently above or below the 100 period linethen you know a strong price trend is in force and the trade should be left torun.The settings above can be altered to shorter periods but it will generate morefalse signals and may be more of a hindrance than a help.HumbleTraders
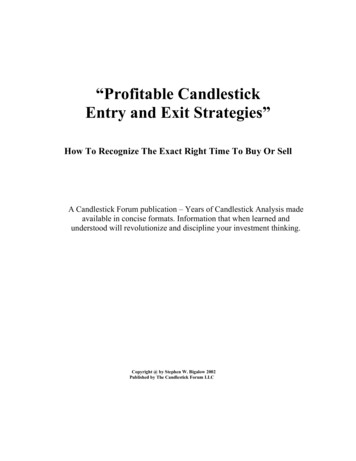
9 Profitable Trading StrategiesThe settings I suggested will generate signals that will allow you to follow atrend if one begins without short price fluctuations violating the signal.On the chart above I have circled in green four separate signals that thismoving average crossover system has generated on the EURUSD daily chartover the last six months.On each of those occasions the system made 600, 200, 200 and 100 pointsrespectively.I have also shown in red where this trading technique has generated falsesignals, these periods where price is ranging rather than trending are when asignal will most likely turn out to be false.The first false signal in the above example broke even, the next example lost35 points.HumbleTraders
9 Profitable Trading StrategiesThe above chart shows the first positive signal in detail, the fast MA crossedquickly down over the slow MA and the trend MA, generating the signal.Notice how the price moved quickly away from the trend MA and stayedbelow it signifying a strong trend.HumbleTraders
9 Profitable Trading StrategiesThe second false signal is shown above in detail, the signal was generatedwhen the fast MA moved above the slow MA, only to reverse quickly andsignal to close the position.Although the system is not correct all the time, the above example wascorrect 6/12 or 50% of the time.BUT.We can immediately see how much more controlled and decisivetrading becomes when a trading technique is used. There are no wildemotional rationalisation, every trade is based on a calculated reason.3.Heikin-Ashi Trading StrategyWhat is it?Heikin-Ashi chart looks like the candlestick chart but the method ofcalculation and plotting of the candles on the Heikin-Ashi chart is differentfrom the candlestick chart. This is one of my favourite forex strategies outthere.In candlestick charts, each candlestick shows four different numbers: Open,Close, High and Low price. Heikin-Ashi candles are different and each candleis calculated and plotted using some information from the previous candle:Close price: Heikin-Ashi candle is the average of open, close, high andlow price.Open price: Heikin-Ashi candle is the average of the open and close ofthe previous candle.High price: the high price in a Heikin-Ashi candle is chosen from one ofthe high, open and close price of which has the highest value.Low price: the high price in a Heikin-Ashi candle is chosen from one ofthe high, open and close price of which has the lowest value.HumbleTraders
9 Profitable Trading StrategiesHeikin-Ashi candles are related to each other because the close and openprice of each candle should be calculated using the previous candle close andopen price and also the high and low price of each candle is affected by theprevious candle.Heikin-Ashi chart is slower than a candlestick chart and its signals aredelayed (like when we use moving averages on our chart and trade accordingto them).This could be an advantage in many cases of volatile price action.This forex day trading strategy is very popular among traders for thatparticular reason.It’s also very easy to recognise as trader needs to wait for the daily candle toclose. Once new candle is populated, the previous one doesn’t re-paint.You can access Heikin-Ashi indicator on every charting tool these days.Let’s see how a Heikin-Ashi chart looks like:HumbleTraders
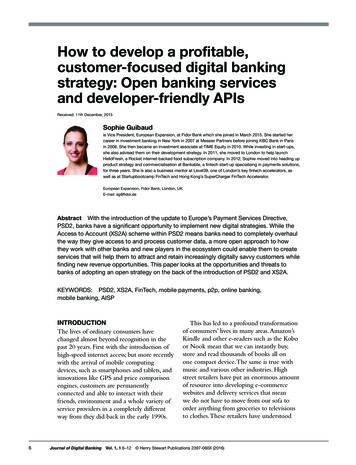
9 Profitable Trading StrategiesHow do I trade with it?On the chart above; bullish candles are marked in green and bearish candlesare marked in red.The very simple strategy using Heikin-Ashi proven to be very powerful inback test and live trading.The strategy combines Heikin-Ashi reversal pattern with one of the popularmomentum indicators.My favourite would be a simple Stochastic Oscillator with settings (14,7,3).The reversal pattern is valid if two of the candles (bearish or bullish) are fullycompleted on daily charts as per GBPJPY screenshot below.HumbleTraders
9 Profitable Trading StrategiesSHORT SETUPOnce the price prints two red consecutive candles after a series of greencandles, the uptrend is exhausted and the reversal is likely. SHORT positionsshould be considered.LONG SETUPIf the price prints two consecutive green candles, after a series of red candles,the downtrend is exhausted and the reversal is likely. LONG positions shouldbe considered.FILTERSThe raw candle formation is not enough to make this day trading strategyvaluable. Trader needs other filters to weed out false signals and improve theperformance.MOMENTUM FILTER (Stochastic Oscillator 14,7,3)We recommend to use a simple Stochastic Oscillator with settings 14,7,3.I strongly advise you read Stochastic Oscillator guide first.Once applied, it will show the overbought/oversold area and improve theprobability of success.HumbleTraders
9 Profitable Trading StrategiesA Trader would now:Enter long trade after two consecutive RED candles are completed and theStochastic is above 70 markEnter short trade after two consecutive GREEN candles arecompleted and the Stochastic is below 30 mark.STOP ORDER FILTERTo further improve the performance of this awesome day tradingstrategy,other filers might be used. I would recommend to place stop ordersonce the setup is in place.In the long setup showed in the chart below, the trader would place a longstop order few pips above the high o the second Heinkin-Ashi reversal candle.The same would apply to short setups, trader would place a sell stop orderfew pips below the low of the second reversal candle.HumbleTraders
9 Profitable Trading StrategiesAccelerator Oscillator filterAs another tool you could use the standard Accellarator Oscillator. This ispretty good indicator for daily charts. It re-paints sometimes, but mostly ittends to stay the same once printed. Every bar is populated at midnight. Howto use it? After Heikin-Ashi candles are printed, confirm the reversal withAccellarator Oscillator.For Long trades: If two consecutive GREEN candles are printed, wait for theAC to print the green bar above the 0 line on the daily chartsFor Short trades; If two consecutive RED candles are printed, wait for the ACto print the red bar above the 0 line on the daily chartsHumbleTraders
9 Profitable Trading StrategiesRULESThe reversal pattern is valid if two of the candles (bearish or bullish) are fullycompleted on daily charts as per GBPJPY screenshot below. Don’t enter themarket straight after a volatile price swing to one direction. It important toconsider fundamental news in the market. I would advise to avoid days like:Bank HolidayNFPFOMCCentral Bankers speeches.HumbleTraders
9 Profitable Trading StrategiesMoney management:Move position to break even after 50 pips in profit.Move stop loss at the major local lows and highs or if the opposite signalis generated. Let your winners run.Stop loss 100 pips flat or use local technical levels to set stop losses.Every trader is advised to implement their own moneymanagement rules.Strategy examples and screen
MUST READ: Few Things About Risk Management Forex Trader Should Know So lets get down to business! HumbleTraders. 9 Profitable Trading Strategies 1.Momentum Reversal Trading Strategy #1 The strategy seeks trading opportunities through the combination of fundamental and technical analysis. #2 It requires a trader to analyse the fundamental aspects of the traded currency to establish mid to