Transcription
UNIVERSITIES AUSTRALIA2020HIGHER EDUCATIONFACTS AND FIGURESOCTOBER 2020
This work is licensed under a Creative Commons Attribution 4.0 International Licence.Further inquiries should be made to the Chief Executive:GPO Box 1142 Canberra ACT 2601Ph: 61 (0)2 6285 8100Fax: 61 (0)2 6285 8101Email: STRALIA.EDU.AUABN 53 008 502 930
FOREWORD2020 is the year that facts, evidence and data became more critical than ever before. As theCOVID-19 pandemic unfolded, Australia turned to university experts, research and facilities toeducate and inform. Before that, universities helped with our understanding and response to thesummertime bushfire crisis.The elevation of facts and expertise was to the country’s great benefit.Whether in periods of relative calm or crisis, Australian universities provide a standing army ofexperts that underpin community discussion with knowledge and evidence. To help with aninformed discussion about Australian higher education, the peak body for Australia’s universitiesproduces a regular snapshot of the sector’s facts and figures.In 2020 Higher Education Facts and Figures you will find the most recent key facts and figuresabout funding, students, staff, world-class research, international rankings performance and muchmore.This update tells a clear story: universities remain a cornerstone of Australia’s economic success.In 2018, universities contributed 41 billion to the Australian economy and supported a total of259,100 full-time jobs. Notably, 325,171 students completed their degrees at Australia’s 39universities.In the future, Australia will need even more new ideas, new skills and new jobs to power theeconomic and social recovery. Universities will drive the nation’s recovery through their researchand innovation, and through the skilled graduates they supply to the labour market.While this year’s update does not yet reflect some of the profound changes brought about by theCOVID-19 pandemic or the newly created 30,000 university places, we do see the impact of theDecember 2017 cap on domestic undergraduate places.We hope you find this publication an informative contribution on the value of Australia’s universitysector: to our students, staff, and to the nation.Professor Deborah Terry AOChair, Universities AustraliaMs Catriona JacksonChief Executive, Universities AustraliaNote: Data in this report was current as at 9 September 2020UNIVERSITIES AUSTRALIA HIGHER EDUCATION FACTS AND FIGURES3
CONTENTSList of figures . 6List of tables. 111Funding and university finances . 121.1Australian Government funding . 121.1.1 Australian Government higher education outlays . 121.1.2 Funding per Commonwealth supported place . 141.1.3 Public vs private contribution for commonwealth supported places151.1.4 Other funding to support teaching and learning . 171.1.5 International comparisons . 211.2Higher Education Loan Program (HELP) . 231.3University finances . 251.3.1 Revenue by source . 251.3.2 Expenditure by category . 261.3.3 Universities’ financial position . 272Students . 292.1Domestic students . 302.1.1 Trends in domestic enrolments . 302.1.2 Student profiles . 302.2International students . 362.2.1 Trends in international student enrolments . 362.2.2 Student profiles . 392.2.3 Contribution to the Australian economy . 422.3Student load . 442.3.1 Trends in student load by liability status . 442.3.2 Composition of domestic student places . 452.3.3 Trends in Commonwealth supported places . 462.3.4 Commonwealth supported places and population growth . 482.4Enrolments in courses leading to professional registration. 502.5Work-integrated learning . 522.6Student outcomes and employment . 532.6.1 Award course completions . 532.6.2 Attrition and completion rates . 542.6.3 Graduate employment . 562.6.4 Graduate salaries . 59UNIVERSITIES AUSTRALIA HIGHER EDUCATION FACTS AND FIGURES4
2.6.5 Satisfaction . 612.73Educational attainment . 62Science, research and innovation . 663.1Australian Government support for science, research and innovation . 663.2Sources of university research income . 673.2.1 Changing composition of Australian Government funding foruniversity research. 693.2.2 Government funding to support research training . 703.3Australia’s gross expenditure on research and development . 723.3.1 International comparisons . 733.3.2 University spending on research and development . 753.4Research outcomes . 783.4.1 Higher degree by research completions . 783.4.2 Research excellence . 783.4.3 International research collaboration . 813.4.4 University-industry collaboration . 824International rankings . 845University workforce . 866Indigenous students and staff. 896.1Indigenous student enrolments . 896.1.1 Field of education . 906.1.2 Course level. 916.1.3 Undergraduate applications . 916.2Indigenous student outcomes . 946.2.1 Award course completions . 946.2.2 Completion rates . 956.2.3 Labour market outcomes . 966.3Indigenous workforce . 986.3.1 Academic vs non-academic . 986.3.2 Staff characteristics . 100UNIVERSITIES AUSTRALIA HIGHER EDUCATION FACTS AND FIGURES5
LIST OF FIGURESFigure 1: Australian Government higher education spending, in 2018 dollars . 13Figure 2: Australian Government higher education spending as a percentage of GDP . 13Figure 3: Total funding per Commonwealth supported place, in 2018 dollars . 15Figure 4: Other government funding to support teaching and learning, by purpose, 2018 dollars 18Figure 5: HEPPP funding – actual and budget cuts . 19Figure 6: Funding for Disability Support Program – total and per student – in 2018 dollars . 20Figure 7: Public investment in tertiary education institutions as a percentage of GDP, 2017 . 21Figure 8: Private investment in tertiary education institutions as a percentage of GDP, 2017 . 22Figure 9: Estimated average annual tuition fees charged by public institutions for domesticstudents at Bachelor degree or equivalent, 2017–2018, in US dollars . 23Figure 10: Amount of new HELP lending by programs, in nominal dollars . 25Figure 11: Sources of university revenue, in 2018 dollars . 26Figure 12: Categories of university expenditure, in 2018 dollars . 27Figure 13: University net operating results, 2010 to 2018, in 2018 dollars . 28Figure 14: Proportion of universities by size of operating margins, 2010 to 2018 . 28Figure 15: Overall university enrolments, 2001 to 2018 . 29Figure 16: Overall enrolments, by broad disciplines, 2018 . 29Figure 17: Annual growth in domestic enrolments, by course levels, 2005 to 2018. 30Figure 18: Domestic students, by course level and type of attendance, 2018 . 31Figure 19: Share of domestic students studying full-time, 2005 to 2018 . 31Figure 20: Share of commencing domestic undergraduate students, by age cohort . 32Figure 21: Annual growth in commencing domestic undergraduate student enrolments, by agecohort . 32Figure 22: Basis of admissions for commencing domestic Bachelor degree students. 33Figure 23: Domestic undergraduate and postgraduate enrolments, by broad field of education,2018 . 34Figure 24: Growth in domestic undergraduate enrolments, by broad field of education, between2008 and 2018 . 34Figure 25: Growth in domestic postgraduate enrolments, by broad field of education, between2008 and 2018 . 35UNIVERSITIES AUSTRALIA HIGHER EDUCATION FACTS AND FIGURES6
Figure 26: Number of domestic undergraduate student enrolments, 2008 and 2018 . 35Figure 27: International student enrolments, 2001 to 2018 . 36Figure 28: International student enrolments, by course levels . 37Figure 29: International higher education students in Australia, by country or region of origin,2018 . 38Figure 30: Distribution of international students in tertiary education, by country of destination,2017 . 38Figure 31: Share of students by gender, domestic vs international students, 2008 and 2018 . 39Figure 32: Share of students by course level, domestic vs international students, 2008 and 2018. 40Figure 33: Share of students by broad field of education, domestic vs international students, 2018. 41Figure 34: Growth in international student enrolments by broad field of education, between 2008and 2018 . 42Figure 35: Value of education-related personal travel exports, in nominal dollars . 43Figure 36: Type of international student expenditure, by educational sector, 2019 . 43Figure 37: EFTSL – student places – by liability status, 2001 to 2018 . 44Figure 38: Annual growth in commencing EFTSL, by liability status, 2005 and 2018 . 45Figure 39: Composition of domestic student places, 2018 . 45Figure 40: Commonwealth supported places, 2001 to 2018 . 46Figure 41: Annual growth in Commonwealth supported places, 2001 to 2018 . 47Figure 42: Commonwealth supported places, by course level, 2001 to 2018 . 47Figure 43: Commonwealth supported places per 10,000 population aged 15–24 years old . 48Figure 44: Actual Commonwealth supported places compared to the 15–24 year old population 49Figure 45: Estimated annual increase in additional Commonwealth supported places to align withpopulation growth . 49Figure 46: Enrolments in courses for initial teacher training . 50Figure 47: Enrolments in courses for initial registration as nurses . 50Figure 48: Enrolments in courses leading to provisional registration as a medical practitioner . 51Figure 49: Enrolments in courses leading to provisional registration as a dental practitioner . 51Figure 50: Work-integrated learning participation rates, by broad field of education, uniqueheadcount, per cent . 52UNIVERSITIES AUSTRALIA HIGHER EDUCATION FACTS AND FIGURES7
Figure 51: Work integrated learning participation rates, by student characteristic, per cent . 53Figure 52: Number of award completions, by course level . 53Figure 53: Attrition rate for domestic commencing Bachelor degree students . 54Figure 54: Completion rates – nine, six and four years – of commencing domestic Bachelordegree students . 55Figure 55: Graduate full-time employment rate – four months after completing their degree – bycourse levels, per cent . 57Figure 56: Short- and medium-term full-time employment rate for 2007 to 2017 graduates –undergraduate degree, per cent . 57Figure 57: Unemployment rates – graduates and overall – May 2007 to May 2019, per cent . 58Figure 58: Unemployment rates, by level of qualification, 2018 . 58Figure 59: Median starting salaries for graduates employed full-time, in 2018 dollars. 59Figure 60: Short and medium-term salary outcomes for 2016 graduates employed full-time, in2018 dollars . 60Figure 61: Median weekly earnings ratios compared to people with no post-school qualification 60Figure 62: Undergraduate student experience, 2013 to 2019, per cent of positive rating . 61Figure 63: Employer satisfaction with graduate attributes and overall satisfaction, per cent . 62Figure 64: Proportion of people aged 25–34 years old with a Bachelor degree or higher . 62Figure 65: Proportion of people aged 25–34 years old with a Bachelor degree or higher, bydegree of remoteness . 63Figure 66: Proportion of people aged 25–34 years old with a Bachelor degree or higher, by SA4area, 2016 . 64Figure 67: Proportion of people aged 25–34 years old with a Bachelor degree or higher, byselected countries, 2019 . 65Figure 68: Australian Government support for science, research and innovation, in 2018 dollars 66Figure 69: Australian Government support for SRI, per cent of GDP . 67Figure 70: Sources of university research income, in 2018 dollars . 68Figure 71: Growth in sources of funding for university research since 2000, in 2018 dollars . 69Figure 72: Composition of research income sourced from Australian Government, in 2018 dollars. 70Figure 73: Research training funding per student, in 2018 dollars . 71Figure 74: Number of research training students per 100,000 population aged 25–64 years . 71UNIVERSITIES AUSTRALIA HIGHER EDUCATION FACTS AND FIGURES8
Figure 75: Composition of Australia’s gross expenditure on research and development (GERD),in nominal dollars . 72Figure 76: Share of research and development expenditure, by type of activity and sector, latestavailable . 73Figure 77: Gross expenditure on research and development (GERD) as a percentage of GDP, bycountry . 74Figure 78: Higher education expenditure on research and development (HERD) as a percentageof GDP, by country . 74Figure 79: Higher education expenditure on research and development (HERD) compared toresearch income sourced from Australian Government, in 2018 dollars . 75Figure 80: Higher education expenditure on research and development (HERD), by type of R&Dactivity, 2000 to 2018, in nominal dollars. 76Figure 81: Higher education expenditure on research and development, by source of funds, 2018. 77Figure 82: Contributions to growth in higher education expenditure on research and development,2008 to 2018, by source of funds . 77Figure 83: Higher degree by research completions . 78Figure 84: Universities at or above world standard by Excellence in Research for Australia rating– two-digit field of research code – 2018 . 79Figure 85: Ratings for research engagement by two-digit field of research, interdisciplinary andAboriginal and Torres Strait Islander research, 2018 . 80Figure 86: Ratings for research impact by two-digit field of research, interdisciplinary andAboriginal and Torres Strait Islander research, 2018 . 81Figure 87: Percentage of Web of Science documents with international collaborators, 2012 and2018 . 82Figure 88: Full-time equivalent (FTE) staff count, academic and professional, including casualstaff . 86Figure 89: Full-time equivalent (FTE) staff count, by classification, including casual staff . 87Figure 90: Full-time equivalent (FTE) staff count, by work contract . 87Figure 91: FTE staff count, by function and duties term, 2018 . 88Figure 92: Indigenous student enrolments, 2006 to 2018 . 89Figure 93: Share of Indigenous student enrolments, 2006 to 2018 . 89Figure 94: Annual growth in Indigenous student enrolments, 2007 to 2018 . 90Figure 95: Enrolments by broad disciplines, 2018 . 91Figure 96: Annual growth in undergraduate applications, 2013 to 2019 . 92UNIVERSITIES AUSTRALIA HIGHER EDUCATION FACTS AND FIGURES9
Figure 97: Share of undergraduate applications, by age, 2019 . 92Figure 98: Share of Indigenous undergraduate applications compared to share of Indigenouspopulation, by age, 2019 . 93Figure 99: Share of undergraduate applications, by gender, 2019 . 94Figure 100: Number of award course completions by Indigenous students, by course level . 94Figure 101: Completion rates – nine, six and four years – of commencing Indigenous and nonIndigenous Bachelor degree students . 95Figure 102: Share of Indigenous students commencing a Bachelor degree that never return –after four years . 96Figure 103: Short-term graduate employment outcomes, 2019 . 96Figure 104: Short and medium-term full-time employment outcomes, for 2016 graduates . 97Figure 105: Number of Indigenous staff by duties classification, 2005 to 2019 . 98Figure 106: Share of Indigenous staff, 2005 to 2019 . 99Figure 107: Proportion of Indigenous staff by duties classification . 99Figure 108: Proportion of staff aged under 40 by duties classification, 2019 . 100Figure 109: Share of female staff by duties classification, 2019. 101Figure 110: Share of staff by academic functions, 2005, 2010 and 2019 . 102Figure 111: Share of staff by academic duties classification, 2005, 2010 and 2019 . 102UNIVERSITIES AUSTRALIA HIGHER EDUCATION FACTS AND FIGURES10
LIST OF TABLESTable 1: Top 20 Australian Government programs by expenses in 2019–20 . 14Table 2: Relative government and student contribution by discipline, 2021 (existing clusters) . 16Table 3: Relative government and student contribution by discipline, 2021 (new clusters) . 17Table 4: Number of students receiving HELP loans and new HELP lending by programs . 24Table 5: Enrolments by course level, domestic vs international students, between 2008 and 2018. 39Table 6: Top 10 reasons for undergraduate students considering early departure, 2016 to 2019 56Table 7: Selected OECD metrics for engagement between business and higher educationinstitutions . 83Table 8: Top 10 university systems and their measures for resources and output, 2020 . 84Table 9: Australian universities performance in different university ranking systems . 85Table 10: Indigenous enrolments, by course level, 2008 and 2018 . 91UNIVERSITIES AUSTRALIA HIGHER EDUCATION FACTS AND FIGURES11
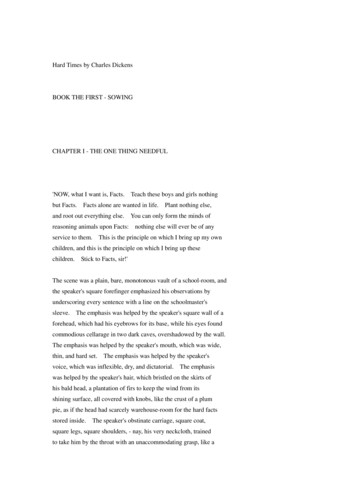
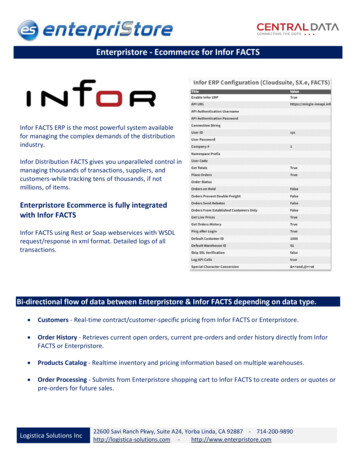
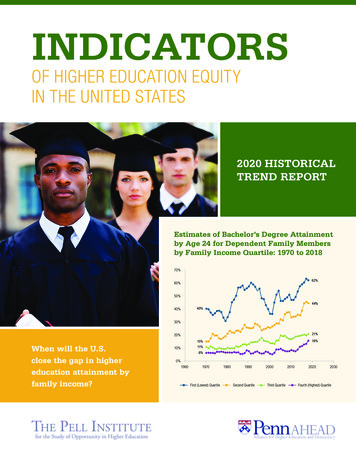
1 FUNDING AND UNIVERSITY FINANCES1.1 AUSTRALIAN GOVERNMENT FUNDINGThe Australian Government provides funding to universities through several main fundingprograms: The Commonwealth Grant Scheme (CGS) that provides funding to support a rangeof university activities, principally teaching and learning for Australian domesticstudents. Research funding through the National Competitive Grant Program and researchblock grants that support research and research training. Other grants made under the Higher Education Support Act 2003 to support equityand participation in higher education. Higher Education Loan Program (HELP) payments. Under the HELP scheme, theAustralian Government pays student fees to higher education providers, which areincome-contingent loans repaid by students through the taxation system.1.1.1 AUSTRALIAN GOVERNMENT HIGHER EDUCATION OUTLAYSTotal Australian Government outlays in higher education spending (including research) hasalmost tripled over the past three decades, from 6.7 billion in 1989 to 18.4 billion in 2018–19 (in2018 dollars). However, most of the growth is due to the growth in HELP loans – of which 80 percent are expected to be repaid in the future. Direct teaching and learning grants increased by only31 per cent over the same period (Figure 1).HELP loans as a share of total higher education outlays increased from less than 16 per cent in1989 to 35 per cent in 2018–19. Excluding HELP loans, higher education (HE) spending hasdoubled, from 5.6 billion to 12 billion, over the same period.Despite the growth in funding, Australian Government total higher education spending as apercentage of GDP only increased from 0.88 per cent in 1989 to just under one per cent in2018–19. Excluding HELP loans, higher education grants for teaching and learning and researchhave declined from 0.74 per cent of GDP in 1989 to 0.65 per cent in 2018–19 (Figure 2).UNIVERSITIES AUSTRALIA HIGHER EDUCATION FACTS AND FIGURES12
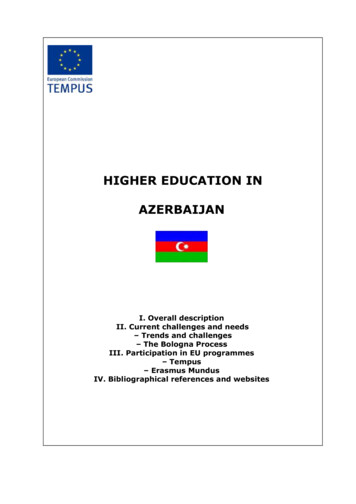
Figure 1: Australian Government higher education spending, in 2018 dollarsSource: Data from 1989 to 2014 are from Department of Education and Training 2015, Higher Education in Australia: AReview of reviews from Dawkins to today. 2018–19 data are from Australian Government 2019, Portfolio BudgetStatement 2019–20: Education and Training Portfolio.Note: Total higher education funding includes CGS or operating grants, HELP, research grants, other appropriations forhigher education support and Australian Research Council funding.Figure 2: Australian Government higher education spending as a percentage of GDPSource: See Figure 1.UNIVERSITIES AUSTRALIA HIGHER EDUCATION FACTS AND FIGURES13
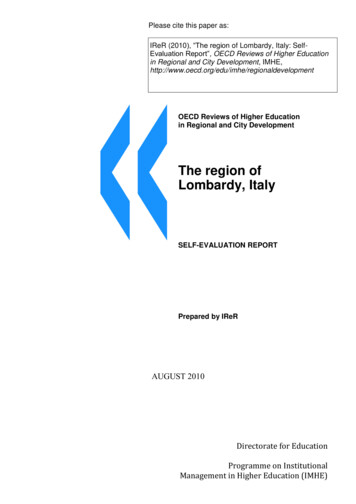
Table 1 shows the Australian Government’s top 20 expenditure programs in 2019–20. TheCommonwealth Grant Scheme (CGS) features in the top 20 at around 7.2 billion, or 1.4 per centof total government expenses.Table 1: Top 20 Australian Government programs by expenses in 2019–20Source: Australian Government 2019, Budget 2019–20: Budget Strategy and Outlook Budget Paper No.1, p.5-10.1.1.2 FUNDING PER COMMONWEALTH SUPPORTED PLACETotal funding received by universities for an average Commonwealth supported place (CSP) hasincreased by 26 per cent in real terms since 1989 to an estimated 19,340 per place in 2018. Itdeclined after 1994 to a low point in 2002 but has since recovered to a
Figure 63: Employer satisfaction with graduate attributes and overall satisfaction, per cent . 62 Figure 64: Proportion of people aged 25-34 years old with a Bachelor degree or higher . 62 Figure 65: Proportion of people aged 25-34 years old with a Bachelor degree or higher, by