Transcription
How to use and interpretDoppler weather radarA novice guide to understanding the principles of radar andhow to use base reflectivity and base velocity to show thatmore than rain and wind is occurringJeff Duda1
This page is intentionally left blank.2
IntroductionThis guide is intended for those who have very little or no experience using Dopplerweather radar. A glossary is provided to define basic terms or terms that are frequentlyused in this guide. Words that appear in bold type are words that can be found in theglossary in the back of this guide. They will only be highlighted the first time they appear.More advanced topics are included for those who have more experience with radar and stillwish to learn more. The base reflectivity and base velocity topics are the most importanttopics to learn.This guide is organized using the color bars that highlight the titles and headings.The yellow color refers to headings for major topics. The green color highlights subtopicheadings within the major topics. Light red color indicates subtopics within othersubtopics.Table of contentsFundamentals of radar ------------------------------Radar resources --------------------------------------Basic terms for viewing radar ---------------------Characteristics of Doppler radar ------------------Beam spreading -----------------------------------Base reflectivity ---------------------------------------Interesting things that can be seen with base reflectivity ----------------------------------Three-body scatter spikes -------------------Bright banding ---------------------------------Base velocity ing things you can see with base velocity --------------------------------------------Purple haze and the Doppler Dilemma -------Range folding -----------------------------------The Doppler Dilemma ------------------------Volume coverage patterns --------------------------The cone of silence --------------------------------Anomalous propagation ----------------------------Ground clutter on ------------------------------------Summary and conclusions --------------------------Glossary 46791011121416181923232325272828313334
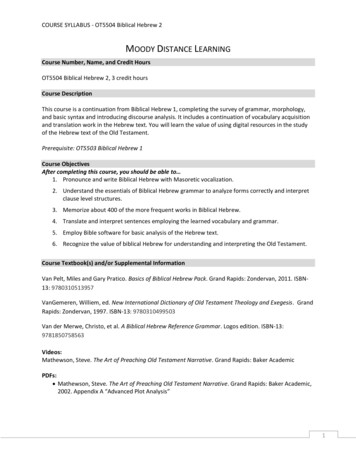
Fundamentals of radarThe weather radar you see on your local TV news program, The Weather Channel,or other news channel is Doppler radar. Doppler radar emits beams (pulses) ofmicrowave energy from a transmitter into the atmosphere (see the figure below for adiagram of the electromagnetic spectrum). When these beams collide with objects in theatmosphere such as raindrops, hail stones, snowflakes, cloud droplets, birds, insects, dustparticles, trees, and even the ground, some of the energy bounces back towards the radar.A receiver on the radar then collects the reflected energy and displays it in different ways.The electromagnetic spectrum. The microwave region of the spectrum istowards the left, where wavelengths are relatively longer and frequencies lower.Image courtesy of Wikipedia – the electromagnetic spectrum4
Doppler radar has not always been used for weather radar. Doppler radar cameinto common use when the Weather Surveillance Radar – 1988 Doppler radar (WSR-88D)was installed in place of the Weather Surveillance Radar – 1974 (WSR-74) and WeatherSurveillance Radar – 1957 (WSR-57) radars that were in place until the early 1990s.Currently, there are 158 such WSR-88Ds that operate around the United States and otherU.S. territories. They are part of a network of Doppler radars called NEXRAD, which standsfor NEXt generation RADar. There are two radar sites in Iowa: one near Des Moines andone near Davenport. All radar sites in the lower 48 U.S. states are given a four-letter callnumber that starts with “K.” The Des Moines radar is KDMX. The Davenport radar isKDVN. Other neighborhing radar sites include Sioux Falls, SD (KFSD), Omaha, NE (KOAX),Kansas City, MO (KEAX), St. Louis, MO (KLSX), Lincoln, IL (KILX), La Crosse, WI (KARX), andMinneapolis, MN (KMPX). See the figure below for a map of all radar locations in the U.S.and other territories.When you see a radar image on TV, it is likely a combination of individual Dopplerradars or a section of the NEXRAD network that you are looking at. Why is this? Anindividual radar sits inside a dome that rests on a tower about 100 feet tall. As thetransmitter on the radar emits beams of microwave energy, it also rotates in all horizontaldirections to send energy to every part of the lower atmosphere. Radar beams can onlytravel out so far before they become useless. Therefore, the effective range of a Dopplerradar is a filled circle with a radius of about 217 miles (250 nautical miles, a frequentlyused unit in measuring distance for radar), centered at the radar apparatus itself. If you seea radar image that has acircular boundary, thenyou are looking at theradar image from just oneradar. If not, then datafrom multiple radars arebeing displayed.The NEXRAD network.Shown are the 158 radar sitesthat compose the NEXRADnetwork. Note the two sites inIowa (KDMX and KDVN).Image courtesty of theNational Climatic Data Center5
Radar resourcesThere are many resources you can use to view Doppler radar images. Here are theinternet links to some preferred sites. Note that you may have to follow other links onceyou get to these sites to view actual radar images. These other links should be easy to findand to follow: rweather.cod.edu/analysiswww.wunderground.comNote that you can only view current radar data on these sites (or data that is lessthan a few hours old). Radar products are discarded after a certain amount of time to savestorage space on computers. However, a few organizations save radar data, archive it, andmake it available for people to download and view, free of charge! Anyone interested inlooking at old radar imagery can do so by following these steps:1) Know the year, month, date, approximate time during the day, and nearest radarsite to the event that occurred. Note that you need to know the time in Greenich MeanTime, also called Universal Time Coordinates (UTC) in most meteorological publications.The Central Time Zone is six hours behind UTC, so when it is midnight in the Central TimeZone, it is 6:00 AM UTC.2) Go to www.ncdc.noaa.gov/nexradinv.3) Select the site, the time of the event, and a product to view. There are tons ofproducts. The most common ones to use are labeled as SHORT RANGE BASEREFLECTIVITY and BASE VELOCITY and should be found near the top of the pull-downmenu.4) Select the range of time (in hours UTC) for which you want to get data.5) Enter an email address to where you want the data sent.6) When your application goes through, a HAS number will be shown to you. This isthe code number for your product. When the data arrives in your email inbox it will be incode. You will need to open a program from this URL:www.ncdc.noaa.gov/oa/radar/jnx/jnt-install.php (and click on the link that says Launchthe STABLE Version 1.9.11 Java NEXRAD Viewer) to view the data. When that programopens, simply enter the HAS number in the input box that opens with the program and click“submit.” The data should then show up and you can begin to view the data.6
Basic terms for viewing radarSince radars have a certain spatial resolution, the radar patterns you see will lookgridded and blocky, especially if you zoom in far enough on a radar image. Note that manyradar programs (especially the ones you see on TV) use smoothing algorithms whichsmooth the blocks of data and make the data look less gridded and more natural. All of thewebsites mentioned in the previous section as sources for radar do not use smoothingalgorithms. The view of radar looking blocky and gridded is how radar is truly displayed.Therefore, the terms about to be described only apply to radar images that are in their trueform and that have not been smoothed.Each individual block, box, or square of data you see on radar is called a pixel, bin,or gate.As you move outward from a radar site along a straight line (think of movingtowards the edge of the circle along a radius of it), the bins that form a connected line asyou move out are called a radial.Sample image of internet radar. A basic free source of radar via the internet is shownwith radials, range circles, and the scale of the reflectivity product shown. Image courtesyof the National Weather Service7
Basic radar vocabulary. A sample image of base reflectivity is shown with example radials, range circles,and bins marked. This image was made using a radar program called Gibson Ridge, which is,unfortunately, not free. However, it is showing the same radar product that you can find from the onlineradar resources. Although smoothing is an option with this radar software, it has not been applied here.Radar does not use Rectangular or Cartesian (i.e., x-coordinate, y-coordinate) axesfor measuring location on a radar. Instead, the range – or distance in nautical miles (onenautical mile is 1.15 regular miles) from the radar site – and azimuth – or angle madebetween the radial that points to true north and the radial that points to the bin of interest– are used to determine location on a radar. This is actually an example of Polarcoordinates, where instead of using an x-coordinate and y-coordinate, distance from centerand angle from some given reference line is used instead.If the radar is detecting something (anything that reflected the energy the radarsent) then that data is represented by a bin colored a certain color to correspond with avalue of a given unit for whatever product you are viewing. This colored bin is called anecho or return, which makes sense nominally, since an echo is repetition of a sound orwave that was emitted. The energy from the wave emitted by the radar was returned orechoed back to the radar. Echo and return also apply to a large group of bins, not just asingle one.8
Characteristics of Doppler radarAll Doppler radars share some common components and characteristics thatdescribe how they scan the atmosphere. All radars have a transmitter, a receiver, and anantenna. The transmitter emits pulses of microwave energy. The reciever recievesreflected energy. The antenna sends the information to another source to be processedand displayed to meteorologists and the general public. All Doppler radars rotatehorizontally as they transmit energy. Not only do radars rotate horizontally, but they alsocan tilt vertically. In fact, depending on the volume coverage pattern, which will bedescribed later, a radar may scan horizontally 360 at anywhere from four to fourteendifferent vertical angles. The standard elevation angle is 0.5 above the horizontal, which isreferred to as a base angle. This elevation gives the name “base X” to many radar products,where X is one of many products, such as reflectivity or velocity. When radar finishesscanning in 360 degrees at one elevation angle, it tilts up to the next elevation angle andscans 360 degrees at that angle, too. It does this until it has scanned at all elevation angles.For this reason, with some software, it is possible to visualize radar data in 3D. However,none of the products at the links provided will allow you to see that. Unfortunately, youmust purchase software that can cost upward of 250 to view radar in 3D. Therefore, thismanual will not focus on methods of observing 3D radar. However, it will show some coolthings that can be seen with higher than 0.5 tilts.Radar can only detect reflected energy when it is listening for it. Like a schoolteacher of mine used to say, “speaking and listening are mutually exclusive activities.” Thisis true for radar, also. While radar is transmitting energy, it cannot detect reflected energy.This will be visually apparent as a very small circle surrounding a radar site, inside ofwhich no data is displayed. Curiously, you can even determine for how long the radar istransmitting a pulse by measuring the radius of that circle. The larger the circle, the longerthe radar is transmitting. Since radar alternates between transmitting and receivingenergy, a term called the pulse repetition frequency (PRF) – defined as the rate at whichthe radar sends pulses – is used to characterize a radar. For example, a PRF of 1000 Hzmeans that the radar is transmitting 1000 pulses per second, or one pulse everythousdandth (0.001) of a second. The PRF has mathematical significance to reflectivity andvelocity products, and will be discussed more fully later.One must remember (or realize) that the microwave energy emitted by radar is, infact, a wave. Since it is a wave, it has all the characteristics of waves. One of them iswavelength, defined as the distance between successive peaks or valleys in a wave. In themicrowave portion of the electromagnetic spectrum, wavelengths vary between 1millimeter and 1 meter. For Doppler radar, different wavelengths are used, including 10centimeter (C-band), 5 centimeter (S-band), and 2 centimeter (X-band). The NEXRADnetwork’s 158 radars are predominantly C-band radars. TV news stations that own theirown radars commonly use S-band radars. Much research is done using X-band radar. Thewavelength used for radar has three major effects:1) How small of particles the radar can detect2) How much the beam is attenuated as it bounces off of reflectors3) How large a value of velocity can be measured9
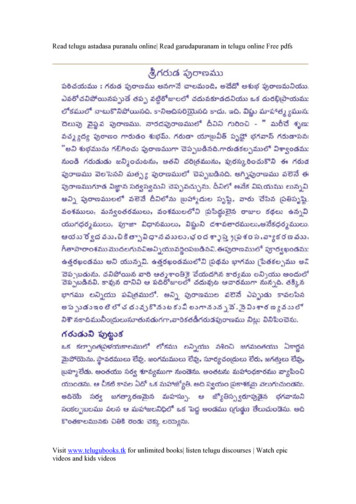
The shorter the wavelength, the smaller the particles the radar can detect.Attenuation means weakening of the beam due to energy being deflected away or absorbedby particles as the beam travels away from the radar. Imagine throwing a baseball into agrove of trees. The thicker the grove (i.e., the more trees), the slower the ball will betraveling when it emerges from the grove (if it emerges at all). Attenuation of the path ofthe baseball has occurred here. A practical application of this effect is when a radar beamhas to travel through several intense thunderstorms, or along a line of intensethunderstorms. The beam will encounter a very large number of raindrops as it passesthrough the thunderstorms. The more raindrops the beam bounces off of, the less energy isleft to travel farther to more distant storms. The product called base reflectivity displaysthe amount of energy that has returned to the radar. If there is less energy emitted toreflect from particles, there will be less reflected back to the radar. This will make it seemlike the thunderstorms that are farther out are less intense, when in fact they may be asintense as or more intense than the storms closer to the radar.Beam spreadingRadars have a certain resolution ofdata (both by radial and by azimuth). Theradial resolution of a radar is the number ofbins for a given distance that the beam travels.For example, current advances in some typesof radar have one bin for every 250 meters oftravel away from the radar. Thus, these kindsof radars have 250 meter radial resolution.The radar products you will usually see on thewebsites given have radial resolution of 1000meters. The azimuthal resolution (alsocalled beamwidth or beam separation) of aradar is the number of radials that the radarcan depict in terms of degrees of a circle. Forexample, if there are 360 radials that can beshown by radar, then that radar has one radialfor every degree in azimuth. Therefore, theazimuthal resolution for that radar is 1 .The concept of beam spreading. The fat outerAnother way to think of it is how far apartcircle corresponds to the effective radar range.(in azimuth degrees) two adjacent radialsAdjacent radials and range cirlces are markedare. The radar products you will mostalong with a sample bin determined by each paircommonly see have 1 azimuthal resolution,of radials and range circles. Notice that the outerbut some advanced radars have 0.5 bin is much larger than the inner bin,azimuthal resolution.demonstrating the idea of beam spreading.Beam spreading is a term thatdescribes the change in the size of a bin as distance from the radar site increases due to thespreading of radar beams at adjacent radials as they move away from the radar site.Consider the figure shown. Assuming the distance between the range circles are the same10
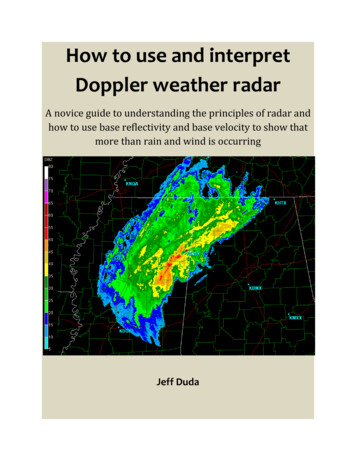
An example of beam spreading. Base reflectivity imagery from the Davenport, IA radar (KDVN) late onApril 13, 2006. Notice how the storms that are very close to the radar (near the center of the image)appear much finer and less blocky than the storms in southern Wisconsin, far from the radar. This imagewas obtained using the Java NEXRAD Viewer program from www.ncdc.noaa.gov.for both pairs of adjacent range circles, the two bins colored in red have the sameazimuthal and radial size (one unit of radial resolution by one unit of azimuthal resolution),but you can clearly see that the outer bin is larger than the inner bin. As an example, with aradar that has radial and azimuthal resolutions of 1000 meters and 1 , respectively, theareal size of one bin ranges from around 0.02 square miles very close to the radar toaround 1.5 square miles near the end of the radar’s effective range, a size difference of afactor of about 70! Thus, it is clear that since a single bin only represents one point of data,then the radar data is at a seemingly lower resolution farther from the radar than it iscloser to the radar. This causes differences in appearance of radar returns far from andclose to the radar site. This is one way that radar data is naturally distorted, and beamspreading must be taken into consideration when observing radar data.11
Base reflectivityBase reflectivity is a radar product that displays the amount of power returned tothe radar after it has reflected off particles in the atmosphere. The actual amount of energyreturned is not displayed. What is displayed is a term called reflectivity (hence why thisproduct is named base reflectivity), and is measured in decibels (dBZ). A decibel is ameasure of the energy transmitted by a wave, or a measure of the amplitude of a wave. ForBase reflectivity. An example base reflectivity image from the Little Rock, AK (KLZK) is shown. Note theinformation that is given in the title above the image. Also note the scale on the right, indicating thestrength of returns to the radar, measured in decibels (dBZ). The orange and red colors indicate a line ofthunderstorms is currently moving across Arkansas. Image courtesy of UCAR:www.rap.ucar.edu/weather/radar12
reference, sound waves are also measured in decibels. The usual range of reflectivity thatis displayed by this product is between 0 dBZ and 80 dBZ, with 0 dBZ indicating very littlereturn of energy and 80 dBZ indicating extremely intense returned energy, usually a valuenever reached in meteorological scenarios. Note that reflectivity values can be negativesince the reflectivity scale is actually a logarithmic scale, which means the numbers on thescale are actually powers of 10. 0 dBZ actually means 100, or 1 of some other measurementin the processing of returned energy. Although radar scans 360 of the atmosphere atmany tilts, only the lowest one (which is usually 0.5 above horizontal) is displayed. Thisgives the product name the “base” prefix, and means the same thing in all other products.Also note that the value of reflectivity in a bin of data is actually the average of all thereflectivity values detected within that bin (there will almost always be multiple targetsthat reflected the energy within the areal space of one bin, and they won’t all reflect thesame amount of energy). This is most useful to know when dealing with a tight reflectivitygradient, or large change of reflectivity over a distance of a few bins, and is most obviousat large distances from the radar site.Interesting things that can be seen with base reflectivityBase reflecitivity is interesting in the sense that it will show echoes wheneverenergy from the radar beam bounces back to it. Anything in the atmosphere that can reflectmicrowave energy will cause echoes to appear on a radar display. Many times, theseechoes are not precipitation, but are meteorological in nature. If base reflectivity showsechoes that are not meteorological in nature, the echoes are called anomalous propagation,which is discussed later.Frequently, a boundary between warm, moist air, and cool, dry air causes reflectionof a wave. This boundary will be seen as a very narrow line of light reflectivity. Thisboundary can be a warm or cold front, a dryline, or outflow boundary from thunderstorms.When the atmosphere is unstable and thunderstorms are likely to form, it is common to seestorms form directly on boundaries.13
Three-body scatter spike (TBSS)A TBSS is an anomalous echo caused by very large hail in a storm bending the radarbeam. When the radar beam moves through a storm containing large hail, the beam maydeflect off of the large hail and move towards the ground. When hitting the ground, theenergy then reflects off the ground, back up to the hail, and back to the radar. There will bea noticeable time delay between the arrival to the radar site of the energy reflected fromthe contact of the beam and hail and the energy reflected from the ground after thecollision. The radar will interpret this delay as echoes farther from the radar site.Therefore, a TBSS will appear on radar as a “spike,” or long, narrow extension of lightreflectivity on the backside of the storm. Note: by the nature of the scenario that producesthem, this spike must occur directly along a radial. A TBSS does not exist going across radials.There are other ways to identify TBSSs, but they involve using products that are notdiscussed in this manual. Any curious readers are invited to learn about the radar productcalled “spectrum width” if they would like to know more about TBSSs and radar productsin general.Three-body scatter spike. A schematic for the cause of a three-body scatter spike is shown. The red ovalindicates a region in the atmosphere that contains rain and hail (which would typically be colored red on basereflectivity anyway). The blue arrows show the path of the radar beam as it deflects off the hail, bounces tothe ground, and then reflects off the ground to the radar or back to the hail and then to the radar. The threebody scatter spike is named due to the three reflections of the radar beam that occur to give this reflectivitypattern. Image courtesy of Wikipedia – three-body scatter spike14
A three-body scatter spike. An example of a three-body scatter spike is shown from the Green Bay, WI(KGRB) radar using the Gibson Ridge software. The TBSS is evident as the streak of low reflectivityextending past the storm in the image along five radials. The white bins in the storm show reflectivityvalues of over 70 dBZ, a strong indication of large hail in the storm. The TBSS is an even strongerindicator that large hail is present. Although this particular scan is at 8.0 , TBSSs can occur at anyelevation angle. The 8.0 scan showed this example the best.15
Bright bandingBright banding is a region of relatively intense reflectivity found in an area wherefrozen precipitation is likely occurring, or along a boundary between frozen and liquidprecipitation. The high reflectivity is not an indication of very heavy precipitation falling,but is rather an indication of liquid coating on frozen precipitation. Liquid water reflectsmicrowave energy much better than does frozen water. At the boundary between frozenand liquid precipitation, there will be a mix of both phases of water. The liquid coating onthe frozen particles will make the particles appear much larger to the radar due toreflecting much more energy. Therefore, the reflectivity will be much higher where this isoccurring. The difference in reflective abilities of liquid and frozen water enables anobserver of radar to determine where frozen and liquid precipitation are occurring. Frozenprecipitation will appear much smoother, with very small reflectivity gradients and overallBright banding. Shown is a base reflectivity image using the Gibson Ridge software from the Louisville,KY (KLVX) radar site. Note the reflectivity scale on the left, and note that smoothing has been applied tothis image. Bright banding is occurring just to the northeast of the radar site, indicated by the orange andred colored reflectivity. Close observation of this image would reveal that the frozen precipitation to thenorthwest of the bright banding region appears smoother (in a different sense than due to the smoothingalgorithm) in the image than the liquid precipitation to the southeast. It is unlikely that precipitationheavy enough to reflect that much energy is falling in the bright banding region. The high reflectivity isdue to bright banding.16
lower reflectivity than will liquid precipitation, which will appear more coarse with highergradients and higher reflectivity.This same principle is also used to explain why hail appears as very high values ofreflectivity on radar. In fact, reflectivity values above 60 dBZ are usually an indication thathail, or a mixture of heavy rain and hail, is being detected. Reflectivity values greater than70 dBZ likely indicate large hail is being detected. Hail grows by collecting liquid water onthe surface of an already existing hail stone. The liquid water then freezes and adds a layerto the stone. The liquid water coating the hail stone reflects a very large amount of energyemitted by radar and results in very high values of reflectivity showing up on radar.High reflectivity. Shown is a base reflectivity image from the Jackson, MS (KDGX) radar using theGibson Ridge software. Note the reflectivity scale on the left. The high reflectivity values ( 60 dBZ)shown in the pink color are likely indicators of hail, or a mixture of very heavy rain and hail. The liquidcoating on hailstones causes them to reflect more of the energy in the radar beam back to the radar,resulting in higher reflectivity values there.17
Base velocityBase velocity is a radar product that displays the average wind speed (and in somesense, the direction, hence velocity) of particles that are detected by the radar. The radarcan measure the speed due to a phenomenon called the Doppler Effect, in which thefrequency of a wave changes as it bounces off a particle that is moving (e.g., the particle inthe atmosphere) with respect to an object that is not moving (i.e., the radar). Since radaronly sends pulses of energy in one direction per pulse, the wind speed detected isnecessarily a speed in the direction of the beam. An individual Doppler radar cannotmeasure or calculate wind in more than one dimension. However, two Doppler radars thatare not in the same location can. It is important for you to know that when you are lookingat a display of base velocity, you are looking at the wind speed either directly towards ordirectly away from the radar. Since there are more than 360 different angles along whichyou can approach a radar, the wind velocity detected at one location may not be the samewind velocity detected at a different location, even if the product indicates the samemagnitude of wind at both locations.Base Velocity. An example of base velocity is shown from the Jackson, MS radar (KDGX) using theGibson Ridge software. Note the scale on the left, showing wind speed in knots (kts), which are nauticalmiles per hour. One knot equals 1.15 miles per hour. The green colors to the southwest of the radar sitealong with the red colors to the northeast of it indicate that winds are flowing towards the north and east.18
Positive values of velocity mean that there is a positive correlation between distanceand direction (i.e., if you’re moving away from the radar site, the wind is in the samedirection as the one in which you are traveling). This means the wind direction is awayfrom the radar when values are positive and towards the radar when values are negative.This is commonly marked with a green color for velocities towards the radar and red forvelocities away from the radar. Usually, the most interesting areas are those where red andgreen colors meet, especially if the values are large where they meet. Several examplesfollow.Interesting things you can see with base velocityBase velocity is a very useful radar product in many different situations and can tellyou a great deal about what is happening in the atmosphere. One thing you can determinewith base velocity is the amount, if any, wind shear that is occurring over the radar site.Wind shear is a change of velocity with height, so a change in wind speed or direction asyou ascend is wind shear. Look at the figure on page 20. It shows a base velocity imageover Wisconsin on a winter day. Careful observation of the “zero isodop” – the line wherevelocity is displayed as zero because the velocity vector is exactly perpendicular to a radialat that point, or the lin
the STABLE Version 1.9.11 Java NEXRAD Viewer) to view the data. When that program opens, simply enter the HAS number in the input box that opens with the program and click "submit." The data should then show up and you can begin to view the data.