Transcription
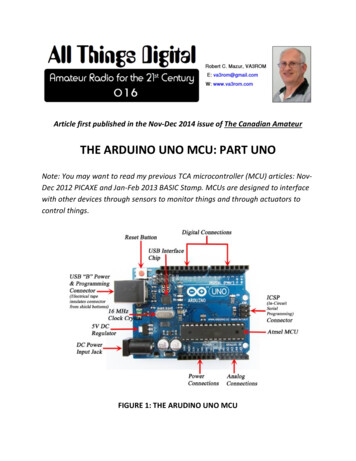
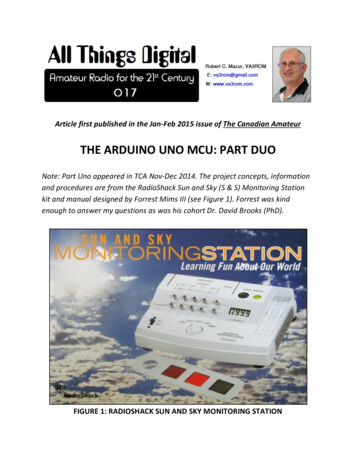
Article first published in the Jan-Feb 2015 issue of The Canadian AmateurTHE ARDUINO UNO MCU: PART DUONote: Part Uno appeared in TCA Nov-Dec 2014. The project concepts, informationand procedures are from the RadioShack Sun and Sky (S & S) Monitoring Stationkit and manual designed by Forrest Mims III (see Figure 1). Forrest was kindenough to answer my questions as was his cohort Dr. David Brooks (PhD).FIGURE 1: RADIOSHACK SUN AND SKY MONITORING STATION
THE PROBLEM WITH PROJECT UNOAstute readers probably noticed a problem with the green LED radiometer’ssunlight measurements. The no-load (non-proportional) voltage very quicklysettled at a constant level and varied very little unless clouds blocked the sun, andwhat was actually being indicated was the average percentage of the green lightspectrum, but we can’t determine this value without also measuring the red andblue spectra for comparison.When LEDs are used as light sensors, they produce a miniscule “leakage” currentdirectly proportional to the light intensity but it flows in the opposite direction of“normal” current so we need to “force” the current through a load resistor (220to 470 ohms works well) so we can measure the voltage and/or power produced(E IR and P I2R) to compare this against other atmospheric values defined interms of volts and watts, but this only produces very, very small voltages that theUno simply can’t measure with its 10-bit ADC (analog-to-digital conversion) and4.88 millivolts (mV) sensitivity so we need to “pump it up” using current-tovoltage (transimpedance) amplifiers and 16-bit with 76 microvolts (uV) sensitivity.COLOUR TO DIGITAL LIGHT SENSOR MODULESFortunately, many electronics companies have developed inexpensive, softwarecontrolled, self-contained surface mount technology (SMT), red, green, blue andclear [white or all-spectrum] ) RGBC 16-bit ADC colour to light sensor boardsallowing allow us to detect, measure and analyze any light source (sun, moon,planets, stars, LEDs, CF bulbs, etc.) and this is all possible because all visible[white] light is composed only of the three primary colours: red, green and blue!
FIGURE 2: TCS34725 RGBC SENSOR BOARDAdafruit makes a really neat module built around the AMS (formerly TAOS)TCS34725 RGBC chip (see Figure 2) with an IR-blocking filter so it “sees” light justlike we and digital cameras do plus the board has built-in inter-integrated circuit(IIC, I2C or I2C) support so we only need two analog pins to transfer data from thefour LED’s. The support code library does all the work to control the sensor, breakup light into its component RGB and Clear values, calculate the proportionalvoltages, correlated colour temperature (CCT) and photometric lux [light] levelfrom which we can calculate other things like the approximate radiometricinsolation.INSOLATION: THE NOT SO CONSTANT, SOLAR CONSTANTInsolation (Latin: insolare “to expose to the sun”) is the sunlight energy orirradiance (radiation) the earth receives from the sun. In just one hour, the earthabsorbs more free solar energy than all the world’s other energy resourcescombined can produce in one year, yet we globally “harvest” less than 0.1% ofthis totally “green” energy source!
But insolation isn’t quite a constant “constant” because there are seasonal andnorth/south hemisphere variations caused by the earth’s elliptical orbit and axistilt, as a result, the southern hemisphere is slightly closer to the sun during theirsummer (our winter) resulting in higher exposure to ultraviolet (UV) radiation andheating effect than experienced in the northern hemisphere. Recent satellite dataindicate insolation is also affected by the solar cycle and its cyclic variations of 11,88, 208 and 1000 years and the solar cycle (as of 2015) seems to be entering a“slowdown” possibly mimicking the Dalton Minimum [1790-1830].The solar constant [insolation] is defined at the top of the atmosphere as a meanvalue of 1361 watts per square metre (W/m2) based on the latest satellitetelemetry (reduced from 1366 W/m2). On the equator, using a standardatmospheric model with a clear sky at solar or local noon (when the sun is at itszenith or highest point in the sky), the mean surface insolation is defined as 1000W/m2 measured perpendicular to the earth’s surface (cosine function), but as youmove farther north/south of the equator the surface insolation decreasesbecause the sun doesn’t rise as high in the sky.FIGURE 3: INSOLATON AND THE GLOBAL ENERGY BALANCE
Amazingly (see Figure 3) all of the sun’s incoming daytime insolation is balancedby the earth emitting this absorbed energy as IR radiation at night (radiationcooling) with about a third reflected back by the “greenhouse” effect (the averagesurface temperature would be -18 degrees Celsius without this effect!). So someglobal warming is necessary for life to exist on the earth, but it’s a delicate seesawbalance scale that we are starting to unbalance by producing greenhouse gasesthat can’t be absorb by the atmosphere without heating things up and affectingglobal weather patterns. Insolation is also a very good number to know foranyone who uses/designs solar panel main/backup electrical power systems andespecially if used for Amateur Radio emergency communications (EmComm).Natural Resources Canada produces photovoltaic (PV) potential and solarresource maps with instructions on how to properly adjust/position solar panelsto maximize conversion of insolation to electrical energy.THE IMPORTANCE OF BEING EARNEST ABOUT COLOURThe sun’s visible light spectrum shaped the human eye’s evolution (see Figure 4)and its rods and cones are more sensitive to blue and green but less sensitive tored which explains why red light doesn’t affect our night adapted eyesight andwhy we don’t have IR vision, but we can and do use IR-based devices for shortrange remote control, optical communication, heating/cooking, non-contactthermometers, weapon systems and search and rescue (looking for/tracking heatsignatures), etc.Our eyes are very susceptible to the “blue light hazard” (photochemical oxidation)which is the process which darkens my Transition eyeglasses outdoors even whenit’s cloudy. Reflective surfaces like snow, water, ice and white sand are even moreproblematic because they reflect light at all angles at us and can nearly double theUV and blue light intensity! Our retinas have no pain receptors to let us know“Enough already!” and over-exposure can easily go unnoticed until sun and/orflash burn occurs so proper eye protection is just as important as skin protectionwhenever you go outside—even in the winter.
FIGURE 4: SOLAR/VISUAL SPECTRAL RESPONSE CURVESFlora (plants, flowers, trees, et al) and oceanic algae use the greenhouse gascarbon dioxide (CO2), water and sunlight (mainly the blue and red spectra) forphotosynthesis (conversion of light to chemical energy) producing and releasingoxygen into the atmosphere at just the right percentage (about 21%) for we airbreathers, but global warming is affecting this balance and it’s estimated thatoxygen (O2) levels have been dropping steadily and accelerating faster since 2003as a result of our greenhouse gas emissions so now the O2 level is decreasingfaster than the CO2 level is increasing which means that we’ll probably run out ofa breathable atmosphere well before global climate change adds final insult toinjury!
PROJECT DUOThis combination radio/photometer gadget (see Figure 5) breaks down any lightsource into primary colours and produces proportional voltages from which wecan calculate colour percentages, CCT, wavelength, lux and approximateinsolation, etc.FIGURE 5: PROJECT DUO GADGET WITH BATTERY PACKClouds, fog, precipitation, haze, smoke, smog, terrain, trees, buildings, time ofday/year and latitude all affect the sunlight reaching our sensor, and recordingweather and sunlight data over days, weeks, months and years builds a profileyou can use to detect any dramatic atmospheric and/or climatic changes in yourarea. An external TMP36 analog ambient air temperature sensor (optional) or anUV sensor (optional) can be added to the gadget (I opted for the ML8511 UVsensor in a later design). The Uno’s MCU internal 1024-byte electrically erasableprogrammable read-only-memory (EEPROM) is used as a simple data-logger sowe can disconnect our computer and put the gadget (with a battery pack) in aconvenient location where it can silently sit and do its job collecting data (justover 21 hours) which is later extracted and imported into a spreadsheet foranalysis (see Figure 6).
FIGURE 6: SAMPLE SENSOR RESULTS
Parts List1. Arduino Uno (USB B cable, computer and programming software).2. Arduino prototyping shield with solderless mini-breadboard andassorted #22 wires/jumpers.3. Adafruit TCS34725 RGBC colour to digital light sensor board.4. TMP36 analog temperature sensor (optional).5. Project Duo sketches and logging spreadsheet (from my website).The circuit is very easy to build on an Arduino prototyping shield (daughterboard)that mounts on top of the Uno MCU which supplies the power and control. Onceeverything’s working properly, you can remove the breadboard and build/solderthe circuit directly onto a copper PCB (printed circuit board) prototyping shieldusing whatever construction style you prefer (point-to-point, Manhattan, ugly[dead] bug, et al).The gadget is used indoors in the same way as the Project Uno gadget; foroutdoor use, you’ll need a weatherproof, clear container (plus diffuser) with somekind of level mounting attachment to secure it to a post and keep it in consistentsunlight conditions during daylight hours (as is practicable). Note: Detailedconstruction, schematic and operating instructions plus additional informationand support documents are available on my website.MY FINALFor Hams “into” meteorology and/or climatology, the use of simple LED-basedatmospheric measuring devices can enhance your knowledge and enjoyment,plus contribute useful data for others by sharing data through the Internet.In my next column we’ll build a simple Arduino Uno direct conversion receiver(DCR) whose output is processed by software to decode various digital datamodes.—73REFERENCES AND RESOURCES
ino.ccAtmospheric and Solar rl8cDavid Brooks, PhDhttp://www.instesre.orgForrest Mims ulko5Introduction to Arduino (PDF)http://www.introtoarduino.comMy NASA Datahttp://tinyurl.com/mxfohjpNatural Resources Canadahttp://tinyurl.com/or49pycVA3ROM: All Things Digitalhttp://tinyurl.com/og2acxq
THE ARDUINO UNO MCU: PART DUO Note: Part Uno appeared in TCA Nov-Dec 2014. The project concepts, information and procedures are from the RadioShack Sun and Sky (S & S) Monitoring Station kit and manual designed by Forrest Mims III (see Figure 1). Forrest was kind enough to answer my questions as was his cohort Dr. David Brooks (PhD).
