Transcription
Topical Fire Report SeriesDecember 2018 Volume 19, Issue 8Residential Building Electrical Fires(2014-2016)These topical reports aredesigned to explore facetsof the U.S. fire problemas depicted through datacollected in the U.S. FireAdministration’s NationalFire Incident ReportingSy s tem . E ach topic alreport briefly addresses thenature of the specific fire orfire-related topic, highlightsimportant findings fromthe data, and may suggestother resources to considerfor further information.Also included are recentexamples of fire incidentsthat demonstrate someof the issues addressed inthe report or that put thereport topic in ĵFrom 2014 to 2016, an estimated 24,000 residential building electrical fires werereported to United States fire departments each year. These fires caused an estimated310 deaths, 850 injuries and 871 million in property loss.Residential building electrical fires resulted in over twice the dollar loss per fire thanresidential building nonelectrical fires did.Residential building electrical fires occurred most often in one- and two-family dwellings(83 percent).Residential building electrical fires occurred most often in the winter month of January(12 percent).In only 17 percent of residential building electrical fires, the fire spread was limited tothe object where the fire started.Residential building electrical fires most often started in bedrooms (15 percent) andattics or vacant crawl spaces (13 percent).The leading specific items most often first ignited in residential building electrical fireswere electrical wire, cable insulation (31 percent) and structural member or framing(18 percent).The leading specific factors contributing to the ignition of residential building electricalfires were other electrical failure, malfunction (43 percent), unspecified short-circuitarc (23 percent), and short-circuit arc from defective, worn insulation (11 percent).Smoke alarms were present in 51 percent and automatic extinguishing systems (AESs)were present in 3 percent of electrical fires that occurred in occupied residential buildings.Electricity is a basic part of life in the U.S. It provides the energy for most powered items in a home, from lights toheating systems to televisions. Today it is hard to imagine a home without electricity. It is a part of our homes andour activities that most of us take for granted. Yet, using electricity can have dangerous consequences.Electrical fires occur frequently throughout the U.S., causing injury, claiming lives, and resulting in large losses of1property. From 2014 to 2016, an estimated 24,000 residential building electrical fires were reported by U.S. fire2,34,5departments annually. These fires caused an estimated 310 deaths, 850 injuries and 871 million in property loss.Residential building electrical fires continued to be a part of the residential fire problem and accounted for 6 percent6of all residential building fires. The term “electrical fires” is defined as those fires that include electrical distribution,wiring, transformers, meter boxes, power switching gear, outlets, cords, plugs, surge protectors, electric fences,7lighting fixtures, and electrical arcing as the source of heat.This topical report addresses the characteristics of electrical fires in residential buildings as reported to the National8Fire Incident Reporting System (NFIRS) from 2014 to 2016, the most recent data available at the time of the analysis.The NFIRS data are used for the analyses presented throughout the report. For the purpose of the report, theterms “residential fires,” “electrical fires,” and “nonelectrical fires” are synonymous with “residential building fires,”National Fire Data Center16825 S. Seton Ave.Emmitsburg, MD 21727https://www.usfa.fema.gov/data/statistics/
TFRS Volume 19, Issue 8 Residential Building Electrical Fires (2014-2016)“residential building electrical fires” and “residential building nonelectrical fires” respectively. “Electrical fires” is usedthroughout the body of this report; the findings, tables, charts, headings and endnotes reflect the full category,“residential building electrical fires.”The residential building electrical fire problem9Although electrical fires declined by 22 percent from 2007 to 2016, electrical malfunction was one of the top fourleading causes of residential fires during each of these ten years. It has also been a leading cause of residential fire10deaths, injuries and dollar loss during this time frame. Electrical fires involve the flow of electric current or static11electricity and are caused by electrical system failures, appliance defects, incorrectly installed wiring, misuse and12poor maintenance of electrical appliances, and overloaded circuits and extension cords. These electrical fires canbe unique. For example, electrical fires that start in walls can smolder for some time and cause smoke not to beseen immediately and detection to be delayed. By the time smoke is seen and fire is detected, the flames may have13already spread behind and within walls. As a result, electrical fires have the potential to spread farther and causemore damage and injuries. In addition, electrical fires can be particularly problematic to extinguish. Since they involveelectricity, and water conducts electricity, using water to put out the fire can cause electrocution unless power isreliably disconnected.Over the last 35 years, homes have been dramatically transformed by electrical devices. Today’s electrical demands14can overburden the electrical system in a home, putting it at a higher risk of an electrical fire. This may be particularlytrue for homes more than 40 years old that have older wiring, electrical systems, and devices. There is also thelikelihood that older homes may not comply with more modern electric code requirements, which puts them at an15elevated risk of hazardous conditions that could lead to an electrical fire. Eventually, given enough time, any homecan be at risk of an electrical fire as wire insulation ages, connections loosen, receptacles and switches come loose16or wear out, and oil and dirt cause electrical components to overheat.Type of fireBuilding fires are divided into two classes of severity in the NFIRS: “confined fires” and “nonconfined fires.” Confinedbuilding fires are small fire incidents that are limited in extent to specific types of equipment or objects, staying within17pots, fireplaces or certain other noncombustible containers. Confined fires rarely result in serious injury or large18content loss and are expected to have no significant accompanying property loss due to flame damage. Nonconfinedfires extend beyond certain types of equipment or objects. They are generally larger fires resulting in more seriousinjury and larger losses of property and content.Of the two classes of severity, nonconfined fires accounted for almost all of the electrical fires (Table 1). Becausethere were so few confined electrical fires, the subsequent analyses in this report include all electrical fires and donot distinguish between confined and nonconfined fires.Table 1. Residential building electrical fires by type of incident (2014-2016)Incident typeNonconfined firesConfined firesTrash or rubbish, containedIncinerator overload or malfunction, fire confinedTotalPercent99.70.30.20.1100.0Source: NFIRS 5.0.2
TFRS Volume 19, Issue 8 Residential Building Electrical Fires (2014-2016)Loss measuresTable 2 presents losses of reported electrical and nonelectrical fires, averaged over the three-year period of 2014 to192016. Electrical fires resulted in a higher number of injuries per thousand fires than nonelectrical fires (Table 2). Inaddition, electrical fires resulted in almost twice as many fatalities per thousand fires and over twice as much dollarloss per fire than nonelectrical fires. This may ultimately be due to challenges in the detection and location of someelectrical fires that can be hidden inside walls.Table 2. Loss measures for residential building electrical and nonelectrical fires(three-year average, 2014-2016)MeasureAverage loss:Fatalities/1,000 firesInjuries/1,000 firesDollar loss/fireResidential buildingelectrical firesResidential buildingnonelectrical fires6.326.6 27,5003.422.8 12,510Source: NFIRS 5.0.Notes: 1. Average loss for fatalities and injuries is computed per 1,000 fires. Average dollar loss is computed per fire and is rounded to the nearest 10.2. The 2014 and 2015 dollar-loss values were adjusted to 2016 dollars.3. The “Residential building nonelectrical fires” category does not include fires of unknown cause.Property useResidential buildings are divided into three major property use categories: one- and two-family residential buildings,multifamily residential buildings, and other residential buildings. One- and two-family residential buildings includedetached single-family residences, manufactured homes, mobile homes not in transit, and duplexes. Multifamilyresidential buildings include apartments, condominiums and town houses. Other residential buildings include all othertypes of residences, such as hotels or motels, long-term care facilities, dormitories and sorority or fraternity housing.One- and two-family dwellings accounted for 83 percent of residential building electrical fires reported to NFIRS(Table 3). By comparison, one- and two-family residential buildings accounted for 60 percent of nonelectrical fires,20more in line with the occurrence of one- and two-family residential building fires overall (64 percent). Multifamilyresidential buildings accounted for only 12 percent of electrical fires while they accounted for 33 percent ofnonelectrical fires. Finally, all other residential buildings accounted for 6 percent of electrical fires while they accounted21for 7 percent of nonelectrical fires. One explanation for the lower percentage of electrical fires in multifamily andother dwellings may be that more stringent building and fire codes requiring regular fire and safety inspections (whichinclude the inspection of wiring and electrical components) are often imposed on these types of residential buildings.In addition, multifamily dwellings and other residential buildings may more often be professionally maintained.Table 3. Residential building electrical and nonelectrical fires by property use (2014-2016)Property useOne- and two-familyMultifamilyOtherTotalPercent of residential buildingelectrical firesPercent of residential buildingnonelectrical fires82.911.75.5100.060.032.77.4100.0Source: NFIRS 5.0.Notes: 1. Total percentages of residential building electrical fires and residential building nonelectrical fires do not add up to 100 percent due to rounding.2. The “Percent of residential building nonelectrical fires” category does not include fires of unknown cause.3
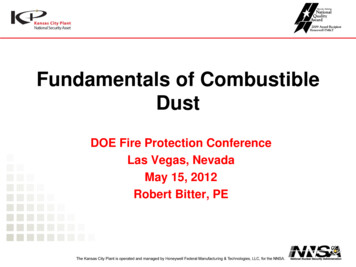
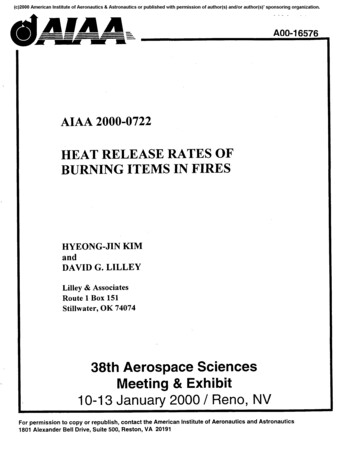
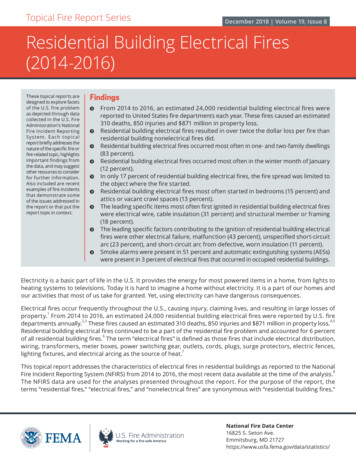
TFRS Volume 19, Issue 8 Residential Building Electrical Fires (2014-2016)When residential building electrical fires occur22As shown in Figure 1, electrical fires occurred most frequently in the late afternoon to early evening hours. Theygradually declined throughout the late evening and early morning hours reaching the lowest point from 5 to 6 a.m.Beginning at 6 a.m., fire incidence started to increase until the peak hours were reached.Figure 1. Residential building electrical fires by time of alarm (2014-2016)Percent of residentialbuilding electrical fires6.05.04.03.43.03.22.9 2.92.7 2.63.03.33.64.04.34.54.85.0 5.05.3 5.2 5.3 5.2 5.2 5.24.94.33.92.01.011 p.m. - Mid10 - 11 p.m.9 - 10 p.m.8 - 9 p.m.7 - 8 p.m.6 - 7 p.m.5 - 6 p.m.4 - 5 p.m.3 - 4 p.m.2 - 3 p.m.1 - 2 p.m.12 - 1 p.m.11 a.m. - 12 p.m.10 - 11 a.m.9 - 10 a.m.8 - 9 a.m.7 - 8 a.m.6 - 7 a.m.5 - 6 a.m.4 - 5 a.m.3 - 4 a.m.2 - 3 a.m.1 - 2 a.m.Mid - 1 a.m.0.0Time of alarmSource: NFIRS 5.0.Note:Total does not add up to 100 percent due to rounding.Figure 2 illustrates that electrical fire incidence was highest during the winter month of January at 12 percent. This isnot surprising, as cooler weather in this month and surrounding months typically results in more indoor activities thatlead to an increase in lighting, heating and appliance use. In addition, during the winter months, cold temperatures23and heaters may lead to dry air with low humidity, which could result in wood studs and framing drying out andbeing somewhat more easily ignited by an arcing current or electrical overheating. The lowest incidence of electricalfires occurred in September at 6 percent.4
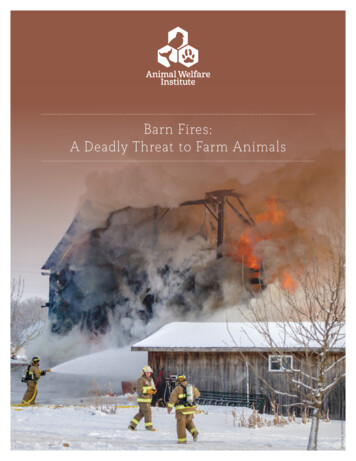
TFRS Volume 19, Issue 8 Residential Building Electrical Fires (2014-2016)Figure 2. Residential building electrical fires by month 16.06.36.6October12.0SeptemberPercent of residentialbuilding electrical fires14.04.02.0DecemberNovemberMonth of ource: NFIRS 5.0.Note:Total does not add up to 100 percent due to rounding.Fire spread in residential building electrical firesWhile 64 percent of nonelectrical fires were limited to the object of origin, only 17 percent of electrical fires werelimited to the object of origin (Figure 3). Of the remaining electrical fires that spread beyond the object of origin,43 percent were limited to the room of origin, 11 percent were limited to the floor of origin, and 27 percent were24limited to the building of origin. An additional 3 percent of electrical fires spread beyond the building of origin. Thelarger fire spread may be partly due to challenges in the detection of some electrical fires (i.e., fires within walls) aspreviously discussed.5
TFRS Volume 19, Issue 8 Residential Building Electrical Fires (2014-2016)Figure 3. Extent of fire spread in residential building electrical and nonelectrical fires (2014-2016)16.5Limited to object of origin64.043.0Fire spreadLimited to room of originLimited to floor of origin18.210.73.727.2Limited to building of originBeyond building of origin0.011.7Residential building electrical fires2.6Residential building nonelectrical fires2.510.020.030.040.050.0Percent of residential building fires60.070.0Source: NFIRS 5.0.Notes: 1. Total percent of residential building nonelectrical fires does not add up to 100 percent due to rounding.2. The “Residential building nonelectrical fires” category does not include fires of unknown cause.Where residential building electrical fires start (area of fire origin)Five areas in the home — bedrooms (15 percent); attics or vacant crawl spaces (13 percent); walls or concealedwall spaces (9 percent); cooking areas and kitchens (7 percent); and common rooms or lounge areas (7 percent) —accounted for 51 percent of electrical fires (Table 4).Table 4. Leading areas of fire origin in residential building electrical fires (2014-2016)Area of originBedroomsAttic: vacant, crawl space above top storyWall assembly, concealed wall spaceCooking area, kitchenCommon room, den, family room, living room, loungePercent of residential building electrical fires(unknowns apportioned)15.413.08.77.46.7Source: NFIRS 5.0.How residential building electrical fires start (heat source)The “heat from powered equipment” category accounted for the majority (88 percent) of electrical fires (Table 5).Within this category, electrical arcing accounted for 74 percent; heat from other powered equipment accounted for7 percent; radiated or conducted heat from operating equipment accounted for 5 percent; and sparks, embers orflames from operating equipment accounted for 2 percent of these electrical fires. The “hot or smoldering object”category accounted for an additional 6 percent of electrical fires, while the heat source for the remaining 6 percentof electrical fires fell into other categories.6
TFRS Volume 19, Issue 8 Residential Building Electrical Fires (2014-2016)Table 5. Sources of heat in residential building electrical fires by major category (2014-2016)Heat source categoryHeat from powered equipmentHot or smoldering objectAll other heat source categoriesTotalPercent of residential building electrical fires(unknowns apportioned)87.86.35.8100.0Source: NFIRS 5.0.Note:Total does not add up to 100 percent due to rounding.What ignites first in residential building electrical firesElectrical wire, cable insulation (31 percent) and structural member or framing (18 percent) were the specific itemsmost often first ignited in electrical fires (Table 6). Although less prominent, thermal, acoustical insulation (7 percent);exterior sidewall covering, surface, finish (6 percent); interior wall covering (6 percent); and other structural componentor finish (5 percent) were also leading items first ignited.Table 6. Leading specific items first ignited in residential building electrical fires (2014-2016)Item first ignitedElectrical wire, cable insulationStructural member or framingThermal, acoustical insulation within wall, partition, orfloor/ceilingExterior sidewall covering, surface, finishInterior wall coveringOther structural component or finishPercent of residential building electrical fires(unknowns apportioned)30.917.87.26.25.54.7Source: NFIRS 5.0.Factors contributing to ignition in residential building electrical firesTable 7 shows the categories of factors contributing to ignition in electrical fires. As expected, the leading category byfar was “electrical failure, malfunction” (88 percent). In this category, other electrical failure, malfunction (43 percent);unspecified short-circuit arc (23 percent); and short-circuit arc from defective, worn insulation (11 percent) werethe specific factors that accounted for 77 percent of electrical fires. The “misuse of material or product” (6 percent)and “mechanical failure, malfunction” (5 percent) categories combined were a contributing factor in 11 percent ofelectrical fires.7
TFRS Volume 19, Issue 8 Residential Building Electrical Fires (2014-2016)Table 7. Factors contributing to ignition of residential building electrical fires by major category(where factors contributing to ignition were specified, 2014-2016)Factors contributing to ignition categoryElectrical failure, malfunctionMisuse of material or productMechanical failure, malfunctionOperational deficiencyDesign, manufacture, installation deficiencyNatural conditionOther factors contributing to ignitionFire spread or controlPercent of residential building electrical fires87.85.55.14.01.21.11.00.2Source: NFIRS 5.0.Notes: 1. Only includes incidents where factors that contributed to the ignition of the fire were specified. At least one factor contributing to the ignition was specifiedin 80 percent of reported residential building electrical fires.2. Multiple factors contributing to fire ignition may be noted for each incident; total will exceed 100 percent.Equipment involved in ignition in residential building electrical firesThree specific types of equipment played a leading role in the ignition of half of all residential electrical fires. Theseleading types of equipment involved in ignition, as shown in Table 8, were other electrical wiring (31 percent), outlets and25receptacles (12 percent), and electrical branch circuits (8 percent). Of interest, extension cords (5 percent), panel (fuse)boards (4 percent), and other lamps and lighting (4 percent) were also leading types of equipment involved in ignition.Table 8. Leading specific type of equipment involved in ignition of residential building electrical fires(2014-2016)Equipment involved in ignitionElectrical wiring, otherOutlet, receptacleElectrical branch circuitPercent of residential building electrical fires30.512.07.6Source: NFIRS 5.0.Alerting/Suppression systems in residential building electrical firesFire fatalities and injuries have declined over the last 35 years, partly due to new technologies to detect and extinguishfires. Smoke alarms are present in most homes. In addition, the use of residential sprinklers is widely supported bythe fire service and is gaining support within residential communities.Smoke alarm data presented in Tables 9 and 10 are the raw counts from the NFIRS dataset and are not scaled tonational estimates of smoke alarms in residential buildings where electrical fires occurred. In addition, the NFIRS doesnot allow for the determination of the type of smoke alarm (i.e., photoelectric or ionization) or the location of thesmoke alarm with respect to the area of fire origin. The data presented in Table 11 are also the raw counts from theNFIRS dataset and are not scaled to national estimates of AESs in residential buildings where electrical fires occurred.Smoke alarms in residential building electrical firesSmoke alarms were reported as present in 50 percent of residences where electrical fires occurred. In 25 percentof electrical fires, no smoke alarms were present. In another 25 percent of these fires, firefighters were unable todetermine if a smoke alarm was present (Table 9).8
TFRS Volume 19, Issue 8 Residential Building Electrical Fires (2014-2016)Table 9. NFIRS smoke alarm presence in residential building electrical fires (2014-2016)Presence of smoke alarmsPresentNone presentUndeterminedNull/BlankTotal 725.424.70.2100.0Source: NFIRS 5.0.While 7 percent of electrical fires occurred in residential buildings that are not currently or routinely occupied, thesebuildings — which are under construction, undergoing major renovations, vacant and the like — are unlikely to havealerting and suppression systems that are in place and, if in place, that are operational. In fact, only 15 percent of allelectrical fires in unoccupied residential buildings were reported as having smoke alarms that operated. In addition,AESs were reported as present in only 2 percent of electrical fires in residential buildings that were not routinelyoccupied. As a result, the detailed analyses in the following sections focus on electrical fires in occupied residential26buildings only.Smoke alarms in occupied residential building electrical firesSmoke alarms were reported as present in 51 percent of electrical fires in occupied residential buildings. In 24 percentof electrical fires in occupied residential buildings, there were no smoke alarms present. Lastly, in 25 percent ofelectrical fires in occupied residential buildings, firefighters were unable to determine if a smoke alarm was present(Table 10).When smoke alarms were present (51 percent) and the alarm’s operational status was considered, the percentageof smoke alarms reported as present consisted of:ĵĵĵĵĵĵPresent and operated — 26 percent.27Present but did not operate — 17 percent (fire too small, 11 percent; alarm failed to operate, 7 percent).Present but operational status unknown — 8 percent.When the subset of incidents where smoke alarms were reported as present was analyzed separately as a whole,smoke alarms were reported to have operated in 51 percent of the incidents and failed to operate in 13 percent.In 21 percent of the subset, the fire was too small to activate the alarm. The operational status of the alarm was28undetermined in an additional 16 percent of these incidents.9
TFRS Volume 19, Issue 8 Residential Building Electrical Fires (2014-2016)Table 10. NFIRS smoke alarm data for occupied residential building electrical fires (2014-2016)Presence ofsmoke alarmsSmoke alarm operational statusSmoke alarm effectivenessFire too small to activate smoke alarmPresentCount Percent4,18210.6Smoke alarm alerted occupants,occupants responded7,23218.3Smoke alarm alerted occupants,occupants failed to respond2580.71,4073.6Smoke alarm failed to alert occupants3190.8Undetermined9872.5Smoke alarm failed to operate2,6446.7Undetermined3,1618.09,57624.3Smoke alarm operatedNo occupantsNone presentUndetermined9,68324.5Total incidents39,449100.0Source: NFIRS 5.0.Note:The data presented in this table are raw data counts from the NFIRS dataset summed (not averaged) from 2014 to 2016. They do not represent national estimatesof smoke alarms in electrical fires in occupied residential buildings. They are presented for informational purposes.If a fire occurs, properly installed and maintained smoke alarms provide an early warning signal to everyone in ahome. Smoke alarms help save lives and property. The U.S. Fire Administration (USFA) continues to partner with othergovernment agencies and fire service organizations to improve and develop new smoke alarm technologies. Moreinformation on smoke alarm technologies, performance, disposal and storage, training bulletins, and public educationand outreach materials can be found at oke fire alarms.html. Additionally, the USFA’s position statement on smoke alarms is available at https://www.usfa.fema.gov/about/smoke alarms position.html.Automatic extinguishing systems in residential building electrical firesOverall, full or partial AESs — mainly sprinklers — were present in just 3 percent of occupied residential buildingswhere electrical fires occurred (Table 11). Residential sprinkler systems help to reduce the risk of deaths and injuries,homeowner insurance premiums, and uninsured property losses. Despite these advantages, many homes do nothave AESs, although they are often found in hotels and businesses. Sprinklers are required by code in hotels andmany multifamily residences. There are major movements in the U.S. fire service to require sprinklers in all new29homes. At present, however, they are largely absent in residences nationwide.Table 11. NFIRS automatic extinguishing system data for occupied residential building electrical fires(2014-2016)Presence of automatic extinguishing systemsAES presentPartial system presentAES not presentUnknownTotal 192.25.2100.0Source: NFIRS 5.0.Notes: 1. The data presented in this table are raw data counts from the NFIRS dataset summed (not averaged) from 2014 to 2016. They do not represent nationalestimates of AESs in electrical fires in occupied residential buildings. They are presented for informational purposes.2. Total does not add up to 100 percent due to rounding.10
TFRS Volume 19, Issue 8 Residential Building Electrical Fires (2014-2016)USFA and fire service officials across the nation are working to promote and advance residential fire sprinklers. Moreinformation on costs and benefits, performance, training bulletins, and public education and outreach materialsregarding residential sprinklers is available at e fire sprinklers.html. Additionally, the USFA’s position statement on residential sprinklers is available at https://www.usfa.fema.gov/about/sprinklers position.html.ExamplesThe following are recent examples of electrical fires reported by the media:ĵĵAugust 2018: An overheated electrical cord caused a fire in a bedroom of an apartment in Holyoke, Massachusetts.A neighbor in the apartment downstairs smelled smoke and called 911 around 6 p.m. Upon arrival, firefightersfound heavy smoke and a small fire in the third-floor apartment bedroom, but were able to extinguish the fire30quickly. No one was injured.ĵĵJuly 2018: Several residents of an apartment building in Austin, Minnesota, were displaced after an electrical firedamaged two units. Upon arrival to the early evening fire, firefighters extinguished the blaze, which appeared tohave started as an electrical fire in the ceiling of the building’s laundry room. Further investigation revealed thata resident felt warmth coming from the floor of her apartment and smelled burning over two hours prior to theemergency call. The resident then went to the laundry room beneath her apartment, but said the smell stopped.She later noticed the smell again and saw smoke, prompting her to make an emergency call. While no injuries were31reported, the fire caused an estimated 10,000 in damage to the building and 2,500 in damage to contents.ĵĵApril 2018: A fault in a duplex electrical receptacle caused a late-night fire at a group home in Severn, Maryland,which killed three people. Upon arrival, it took firefighters more than an hour to put out the blaze in the singlefamily dwelling. Two of the victims killed were male residents of the home, while the third victim was a femaleworker in the home. Investigators determined that the faulty receptacle was located in a rear bedroom of thehome. All of the victims, however, were found at the front of the house. Investigators believe the worker wastrying to save one of the residents as both were found dead inside the same room in the house. Paramedics triedto save the other resident when they found him inside the home, but were unsuccessful and declared him deadat the scene. The Office of the Chief Medical Examiner in Baltimore determined that the two victims who werefound together both died of smoke inhalation and burns. The third victim died of smoke inhalation. The home32was completely destroyed.Electrical fire safetyTo help keep your home fire safe, make sure all electrical work in your home is done by a qualified electrician andfollow these electrical safety tips:ĵĵAppliances:ÝÝ Always plug major appliances, such as refrigerators, stoves, washers and dryers, directly into a wall outlet.ÝÝ Never use an extension cord with a major appliance — it can easily overheat and start a fire.ÝÝ Always plug small appliances directly into a wall outlet.ÝÝ Unplug small appliances when you are not using them.ÝÝ Keep lamps, light fixtures and light bulbs away from anything that can burn.ÝÝ Use light bulbs that match the recommended wattage on the lamp or fixture.ÝÝ Check electrical cords on appliances often. Replace cracked, damaged and loose electrical cords. Do not tryto repair them.ĵĵOutlets:ÝÝ Do not overload wall outlets.ÝÝ Insert plugs fully into sockets.ÝÝ Never force a three-prong cord into a two-slot outlet.ÝÝ Install tamper-resistant electrical outlets if you have young children.11
TFRS Volume 19, Issue 8 Residential Building Electrical Fires (
Residential building electrical fires occurred most often in one- and two-family dwellings (83 percent). ĵ. Residential building electrical fires occurred most often in the winter month of January (12 percent). ĵ. In only 17 percent of residential building electrical fires, the fire spread was limited to the object where the fire started. ĵ