Transcription
ANNUAL REPORT ON EXECUTIVE COMPENSATION FOR CALENDAR YEAR2016: INCUMBENTS IN CERTAIN SENIOR MANAGEMENT POSITIONSEXECUTIVE SUMMARYThe University of California is committed to transparency and accountability in reporting thecompensation of its employees. As part of this commitment, this report provides detailedinformation on compensation paid to the University’s highest level administrators, the SeniorManagement Group (SMG) and officers of the University, regardless of compensation amount.This report also includes certain highly compensated non-SMG employees who met the reportcriteria. The report is posted on UC’s compensation .edu/reports.html) to ensure public access to theinformation. The report adheres to a broad definition of compensation adopted by the Board ofRegents.Specifically, this report provides compensation information for calendar year 2016 for thefollowing employees who were active employees as of December 31, 2016: (1) all incumbents inthe SMG personnel program and incumbents in an acting or interim SMG role, regardless oftheir total cash compensation, (2) all officers of the University, regardless of their total cashcompensation, (3) all incumbents in administrator positions who are non-academic, nonrepresented, exempt employees whose total cash compensation exceeds the current IndexedCompensation Level (ICL), and (4) incumbents in “Other Specified Employees” (OSE)positions, such as athletic directors and coaches, whose total cash compensation exceeds the ICL.The ICL during calendar year 2016 was 304,000.OBSERVATIONS Executive compensation remains a small percentage of payroll: Compensation forincumbents in senior management positions included in this report represents less than 1percent of UC’s total payroll of 14.2 billion. UC health sciences personnel and coaches remain the highest paid employees: As inprevious years, athletic coaches and medical center senior administrators – who are includedin this report – were among the top-earning employees at UC in 2016. They are paid fromnon-State funds. Top UC earners also include world-renowned faculty physicians paidpredominantly from their clinical practice income. These academic appointees are notincluded in this report; however, they are included in the Annual Report on EmployeeCompensation. This report is also posted on UC’s compensation .edu/reports.html). A lack of consistent annual merit increases has impacted competitiveness: For manyyears, budgetary challenges have meant that UC employees have not received regular salaryincreases. Level One Senior Management Group members (President of the University, allChancellors, medical center Chief Executive Officers, and SMGs who report directly to thePresident and/or the Board of Regents) did not receive general salary increases from 2007 to2014. Over this period, wages within the general labor market increased. The lack of general
-2-salary increases over this multi-year period impacted the University’s competitive positionfor talent. The lack of a regular salary program for SMG members at UC made it difficult torecruit and retain people for senior leadership positions.In 2011, after several years without merit increases for non-represented staff – including oneyear when salaries were reduced through a furlough/salary reduction program – theUniversity was able to fund such increases. However, SMG members were excluded fromthis program. In addition, many employees, including SMG members, have seen their takehome pay decrease as their contributions to health and pension plans increase.In 2013, UC implemented a salary program for policy-covered (non-union represented) staff;however, the program excluded the following employees: Level One SMGs (the President of the University, all Chancellors, medical centerChief Executive Officers, and SMGs who report directly to the President and/or theRegents)Athletic coaches and other athletic personnel whose salaries are covered by multiyear contractsLevel Two SMGs whose proposed base salary fell at or above the 75th percentile oftheir Market Reference Zone (MRZ)In 2014, UC implemented another salary program for policy-covered (non-unionrepresented) staff. This time the program excluded athletic coaches and other athleticpersonnel whose salaries are covered by multi-year contracts and student employees. SMGswere included in the program. They received modest salary increases averaging 3 percent, asdid those in the Management and Senior Professional (MSP) categories whose total cashcompensation exceeded the ICL. The President of the University was eligible to participate,but chose not to.In 2016, consistent with the 2016-2017 salary program for non-represented staff at all levels,the President recommended approval of base salary increases for certain SMG members.The increases included Level One SMG members who were in their current role for at least ayear and had not received a salary increase the previous year.The lack of salary increases over a multi-year period poses talent retention issues and hiringchallenges at UC. These challenges are expected to grow, particularly as the economyrecovers and more institutions are in a position to recruit UC’s top performers. UC Chancellors’ compensation relative to market: In 2016, UC Chancellors’ averagesalaries were 22 percent below the 50th percentile of the Market Reference Zone (MRZ). AnMRZ is a unique range of market competitors’ salary data that the University has establishedfor each functional position in the Senior Management Group. The MRZ displays the 25th,50th, 60th, 75th and 90th percentile base salary in the defined competitive market for eachfunctional position. MRZs are intended to reflect the dynamic labor market in which theUniversity competes for talent.
-3-The salaries of most UC Chancellors fall in the bottom third as compared to other AmericanAssociation of Universities (AAU) institutions. Many institutions, particularly private ones,offer much higher cash compensation and additional forms of compensation that UC does notoffer, which further exacerbates the disparity. Incentive compensation is used to motivate excellent performance in support ofUniversity priorities: Like many public institutions nationwide, UC uses incentivecompensation plans to encourage and reward sustained individual and group performance insupport of key University objectives in the following areas:o Medical Centers: Incentive compensation plans for UC medical centers includeemployees at all levels – from clerical and custodial staff to senior leadership – andreward individual as well as group efforts that accomplish key priorities, such asimproving patient care and safety, enhancing operational efficiency and maintainingsound financial management.o Office of the Chief Investment Officer: Consistent with industry standards, theOffice of the Chief Investment Officer (CIO) has an annual incentive compensationplan that motivates and rewards employees responsible for maximizing long-termtotal investment returns while assuming appropriate levels of risk and promotingteamwork.o Athletic Directors, Coaches and Other Athletic Positions: For athletic directors,coaches and other incumbents in athletic positions included in this report, incentivecompensation is funded by athletic department revenue or other non-State sources,including revenue generated from television and radio contracts, marketingarrangements with equipment and clothing manufacturers, and summer sports camps.The incentive compensation for athletic directors, coaches and other athletic positionsis typically tied to the attainment of specific goals, such as winning a nationalchampionship, and is paid only if those goals are met. As teams improve theirwinning records, national attention brings outside employment opportunities, whichmay require adjusting compensation terms to retain successful coaches. When hiringa new coach or retaining an existing coach, the market demand for their servicesnecessarily plays a role in determining the compensation offered by the University.The compensation offered to UC coaches is also aligned with that of other coaches inthe PAC-12 with comparable win/loss records. No State funds used for incentives: State funds were not used to fund incentive awardpayments for clinical and health sciences personnel, CIO personnel, or coaches and otherathletic personnel included in this report.
-4- Funding source for recognition awards: By policy, only non-SMG staff were eligible toreceive recognition awards. Recognition awards may be funded within existing division anddepartment budgets. Unrestricted fund sources (mainly general and common funds) may beused for recognition awards. The use of restricted funds is subject to any restrictions onthose funds. Incentive and recognition award pay by the numbers: Of the 293 employees included inthis report, 110 received incentive or recognition award pay, which collectively totaledapproximately 9.2 million, or approximately 0.06 percent of UC’s 14.2 billion annualpayroll. Of this 9.2 million, 5.2 million, or 57.8 percent, consisted of payments from themedical enterprise’s Clinical Enterprise Management Recognition Plan (CEMRP) and otherclinical incentive plans. Approximately 2.2 million, or 24.9 percent of the total incentiveand recognition pay, consisted of payments under the CIO Annual Incentive Plan (AIP).Incentive awards for athletic directors, coaches, and incumbents in other athletic positionstotaled approximately 1.5 million, or 17.1 percent. Recognition award program paymentsof approximately 25,500 made up the remainder.REPORT FORMAT AND CONTENTThe report includes compensation information for 293 University employees who wereemployed in a position that met the reportable population criteria on December 31, 2016. Thereport does not include employees who separated from the University prior to December 31,2016.The report consists of two sections: (1) a list of the employees and the compensation elementsfor each employee that make up their total cash compensation during the calendar year, and (2)an addendum with footnotes that provides additional information regarding some of thecompensation elements listed for particular employees.The following information provides a description of the data in each column of the report:Annualized Base Salary as of December 31: This column reports the annualized base salary ratefor the employee and includes any changes to the employee’s base salary as of December 31,2016 such as market, equity, merit, and other salary adjustments.Actual Base Salary Received: This column reports the actual base salary received by theemployee during the calendar year.Actual Bonuses/Incentives Received: This column reports the total incentive awards and/orrecognition awards received by the employee during the calendar year. Such compensation fallsinto one of the following categories: (a) incentive and/or recognition award compensationreceived by coaches, (b) incentive awards from the clinical incentive plans, CEMRP andCEMRP2, (c) incentive awards from the CIO’s AIP, and (d) awards from recognition awardplans.
-5-Actual Amount Received from the Health Sciences Compensation Plan: This column reports thetotal compensation received by the employee during the calendar year from the Health SciencesCompensation Plan (HSCP), per policy, from qualified outside activities such as clinicalservices, research and other professional activities. Because an employee’s outside activitiesfluctuate from year to year, the HSCP payments will fluctuate accordingly. UC policy stipulatesthat the funds distributed from the HSCP not be derived from State sources.Actual Stipend Received: This column reports the actual stipend total the employee receivedduring the calendar year.Actual Auto Allowance Paid: This column represents the actual auto allowance the employeereceived during the calendar year.Other Cash Compensation/Payments Received: This column reports the total of any othercompensation or payments that the employee received from the University during the calendaryear.Actual Temporary Housing/Relocation Allowances Paid to Employee: This column reports theactual temporary housing allowance and/or relocation allowances that were paid to an employeeduring the calendar year.Total Cash Compensation: This column reports the sum of the actual amounts received by theemployee in the following categories during the calendar year: base salary, incentive orrecognition awards, health sciences compensation, stipend, auto allowance, other cashcompensation/payments, and actual temporary housing/relocation allowances. The total cashcompensation may not correspond with the employee’s W-2 earnings because there are elementsincluded in W-2 earnings that are not included in the University’s definition of total cashcompensation, such as imputed income.Senior Management Benefits: A “Y” in this column indicates that the employee received one orboth of the following benefits during the calendar year: Senior Manager Life Insurance and/orExecutive Salary Continuation for Disability.University-Provided Housing: A “Y” in this column indicates that the employee receivedUniversity housing, which is provided to the President of the University and the Chancellors.Severance Benefits: A “Y” in this column indicates that an individual received pay pursuant to aseverance or separation agreement.Senior Management Supplemental Benefit: This column reports the percentage of theemployee’s total eligible salary that the University contributed on the employee’s behalf to theSenior Management Supplemental Benefit Program during the calendar year if the employee isan SMG member eligible for this benefit. SMG members with underlying tenured facultyappointments are not eligible to receive this benefit unless it has been approved as an exceptionto policy.
-6-Additional Post-Retirement Benefits: A “Y’ in this column indicates that the employee receivedpost-retirement benefits such as retiree medical coverage, enhanced retirement income benefits,and enhanced retirement vesting schedules. This may occur with rehired retirees.Reimbursed Moving Costs: This column reports the total amount the employee received duringthe calendar year in connection with moving, such as a temporary housing and reimbursementfor house-hunting trip expenses, travel expenses, and payments to outside vendors for theshipment of household goods, storage fees, or other moving expenses consistent with policy.University-Provided Home Mortgage: This column reports the original loan amount if anemployee is participating in one of the University’s home loan programs.DATA COLLECTION, REVIEW, AND CERTIFICATION PROCESSThe Annual Report on Executive Compensation was produced from data collected by eachcampus, medical center and laboratory using a variety of sources, such as payroll, accountspayable and personnel records, to populate a data warehouse, the Senior Leadership InformationSystem (SLIS). Multiple data quality reviews were conducted by the Office of the President(OP) and local entities. The first certification occurred at the individual level when each personreceived a report from SLIS displaying his or her data and was asked to certify that theinformation was accurate and complete. In addition, campus and OP staff reviewed thepopulation and data to validate the accuracy and completeness of the data. Each Chancellor,Laboratory Director, and Executive Vice President reviewed his or her location’s data andcertified it to be accurate and complete. Thereafter, the President of the University reviewed thecontents of the report.(Attachments)
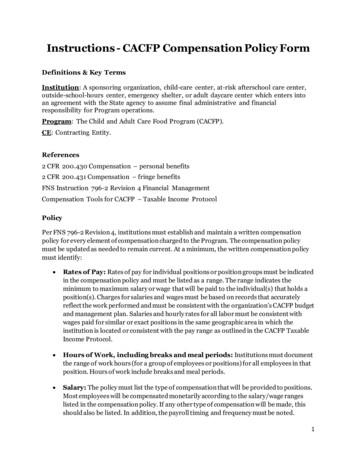
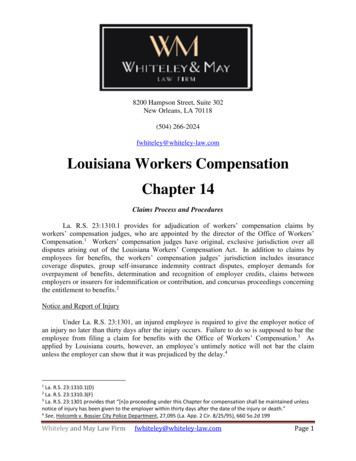
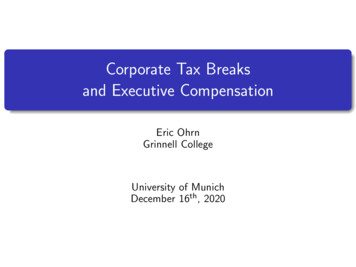
Annual Report On Executive Compensation for Calendar Year 2016NameARMAND P ALIVISATOSWorking TitleEXECUTIVE VICE PRESIDENT‐PHYSICIAN SERVICES/VICEDEAN‐CLINICAL AFFAIRS,UCSF HEALTHINTERIM AVP ‐ BUDGET ANDANALYSISHEAD COACH, MEN'SBASKETBALL,INTERCOLLEGIATE ATHLETICSVICE CHANCELLOR FORRESEARCHSAL PETER ALOSIHEAD FOOTBALL STRENGTH& CONDITIONING COACHJOSHUA S ADLERDAVID ALCOCERSTEPHEN TODD ALFORDSHEILA E ANTRUMDIRECTOR, FIXED INCOMEINVESTMENTSSENIOR VICE PRESIDENT‐CHILDREN'SSERVICES/PRESIDENT‐BENIOFF CHILDREN'SHOSPITAL, UCSF HEALTHVICE PRESIDENT AND CHIEFINFORMATION OFFICERVICE CHANCELLOR ‐‐PLANNING AND BUDGETSENIOR VICE PRESIDENT‐ADULT SERVICES, UCSFHEALTH/PRESIDENT‐UCSFMEDICAL CENTERJACOB A APPELSMITHCHIEF CAMPUS COUNSELSATISH ANANTHASWAMYMICHAEL R ANDERSONTHOMAS ANDRIOLAMARIA RAMOS ANGUIANOASSOCIATE VICE CHANCELLOR‐ UNIVERSITY DEVELOPMENTAND ALUMNI RELATIONSCHIEF FINANCIAL OFFICER,JONATHON DUANEFACULTY PRACTICE GROUP,ARRINGTONUCLA HEALTHASSOCIATE VICE PRESIDENT ‐PEGGY MCNAMARA ARRIVAS SYSTEMWIDE CONTROLLEREXECUTIVE DIRECTOR,GENERAL SERVICES, UCLARICHARD F AZARHOSPITAL SYSTEMJENNIFER P. ARNETTJAGDEEP SINGH BACHHERLocAnnualizedBaseSalaryMRZ/Salary Range as ofMRZ/Salary RangeCommentsDec. 31UCSFMRZUCOPMRZUCLASalary RangeUCBMRZUCLASalary RangeUCOPSalary RangeUCSFMRZUCOPMRZUCRMRZUCSFMRZUCDMRZUCSFSalary RangeUCLASalary RangeUCOPMRZUCLASalary RangeMARGARITA M BAGGETTCHIEF INVESTMENT OFFICER UCOPCHIEF CLINICAL ANDSUPPORT SERVICES OFFICER UCSDMRZROSEMARIE A BALLAAVC AND CFOSalary RangeUCBMRZBelow the 60thPercentileBelow the 50thPercentileNo independentsurvey dataavailableBelow the 75thPercentileNo independentsurvey dataavailableBelow theMaximum ncentivesReceived 630,000 612,643 83,903 189,668 160,356 5,000 300,000 300,000 10,000 430,540 434,858 250,000 250,000 304,808 297,388Actual AmountReceivedfrom theHealth lAutoAllowancePaidOther ousing/RelocationAllowancesPd to Empl 9,977 2,370,000 2,229 130,833 191,043Total CashCompensationSr MgmtBenefitsSr MgmtUniversitySupple‐Provided Severance ‐Post‐Reimburse ProvidedRetirement MovingHomeBenefitsCostsMortgage 696,546YNN 175,333NNNN 2,680,000NNNN 437,087YNNN 380,833NNNN 488,431NNNNNBelow the 90thPercentileBelow the 75thPercentileBelow the 90thPercentile 925,000 17,720 17,720YNN5%N 366,064 359,845 359,845YNN5%N 269,100 263,792 269,000YNN5%NBelow the 50thPercentileBelow the 60thPercentile 625,000 536,068 611,321YNN5%N 266,086 260,837 260,837YNN5%N 400,000 383,407 383,407NNN 319,300 313,446 327,049 318,834Below the 50thPercentileBelow theMaximum SalaryRangeBelow the 90thPercentileBelow theMaximum SalaryRangeBelow the 90thPercentileBelow the 25thPercentileBelow theMaximum SalaryRange 5,208 75,253 46,501 270,417 265,460 38,069 652,454 641,368 680,127 377,260 369,637 274,456 267,103 23,250 19,925 8,916 30,420Page 1 of 14 14,625 383,197NNN 318,834YNN 1,330,000NN5%N 323,454NNN 1,330,411YNN5%NN 369,637YNN5%N 312,148NNNN 1,800,000
Annual Report On Executive Compensation for Calendar Year 2016MICHAEL JOHN BECKADMINISTRATIVE VICECHANCELLORUCLAMRZJAMES BENNANSENIOR VICE PRESIDENT‐INFORMATION TECHNOLOGY,CAMPUS/UCSF HEALTHUCSFVICE PRESIDENT‐FINANCIALPLANNING AND BUDGETING,UCSF HEALTHUCSFSalary RangeDAVID ERIK BERGQUISTCHIEF CAMPUS COUNSELUCRMRZFRANKLIN SCOTT BIDDYVICE CHANCELLORUCBMRZJEFFREY A BLAIRLABORATORY COUNSELLBNLMRZJOSEPH BENGFORTSalary RangeGENE D. BLOCKCHANCELLORUCLAMRZGEORGE R BLUMENTHALCHANCELLORUCSCMRZRICHARD M. BOOKSTABERMANAGING DIRECTOR ‐INVESTMENTSUCOPSalary RangeUCLASalary RangeJANE ESTHER BOUBELIKTHOMAS M. BRADLEYSCOTT A BRANDTKEITH EDWARD BRANTWENDELL C BRASEDAVID ALLEN BRENNERNATHAN ERIC BROSTROMPAMELA HOPE BROWNSANDRA A BROWNBRAD BUCHMANKIMBERLY SUSAN BUDILKENNETH C BURTISJOHN DUNCAN CAMPBELLSUSAN L. CARLSONCHIEF LEGAL COUNSEL, UCLAHEALTHDEFENSIVECOORDINATOR/ASSISTANTFOOTBALL COACHVICE CHANCELLOR ‐RESEARCHVICE CHANCELLOR,UNIVERSITY RELATIONSVICE CHANCELLOR ‐ADMINISTRATIVE ANDBUSINESS SERVICESVICE CHANCELLOR ‐ HEALTHSCIENCES AND DEAN,SCHOOL OF MEDICINECHIEF FINANCIAL OFFICERVICE PRESIDENT ‐INSTITUTIONAL RESEARCHAND ACADEMIC PLANNINGVICE CHANCELLOR ‐RESEARCHMEDICAL DIRECTOR ‐STUDENT HEALTH &COUNSELINGVICE PRESIDENT NATIONALLABORATORIESBelow the 75thPercentileBelow the MidpointSalary RangeBelow theMaximum SalaryRangeBelow the 50thPercentileBelow the 50thPercentileBelow the 75thPercentileBelow the 50thPercentileBelow the 25thPercentile 360,000 270,000 459,193 450,767 67,617 283,279 272,813 39,670 243,483 240,019 410,046 403,079 317,424 307,254 36,000 6,048 9,782 8,916 312,048YNN 518,384NNN 322,265NNN 240,019YNN5%NN5%N 411,995YNN5%N 307,254YNN5%N 454,574 446,851 8,916 455,767YYNN 387,950 8,916 396,866YYNN 309,000 303,750 49,500 353,250NNNN 264,507 263,380 52,324 318,988NNNNUCLASalary RangeUCSCMRZUCSCMRZBelow the MidpointSalary RangeBelow theMaximum SalaryRangeNo independentsurvey dataavailableBelow the 50thPercentileBelow the 25thPercentileUCIMRZBelow the 75thPercentile 327,818Below the 50thPercentileBelow the 60thPercentile 586,390 576,427 424,360 417,150Below the 75thPercentileBelow the 50thPercentile 285,725 260,585 260,585Y 327,665 321,380 321,380Y 375,000 125,000 125,000YNN5%N 376,619 370,221 ZUCOPMRZINTERIM PROVOST ANDEXECUTIVE VICE CHANCELLOR UCDMEDICAL GROUP EXECUTIVEDIRECTORUCSDVICE PROVOST ‐ ACADEMICPERSONNELUCOPMRZMRZMRZBelow the 25thPercentileBelow the 75thPercentileBelow the 25thPercentileBelow the 90thPercentileBelow the 50thPercentile 250,000 250,000 315,353 310,866 304,478 300,146 322,248 290,863 254,289 298,918 292,874 282,743 277,166 3,600 8,916 220,000 8,916 8,916 12,395 45,892Page 2 of 14 245,417 14,000 1,015,000N 394,655 3,284 9,648 499,017NNNN 310,866YNNN 323,062YNN5%N 322,248YNN5%N 300,000 796,427YNNN 2,660,000 426,066YNN5%NN5%NN 266,684NNN 338,766YNN 277,166YNNNNNNN 571,500
Annual Report On Executive Compensation for Calendar Year 2016KATHRYN A CARRICOCAMERON S CARTERSCOTT CHANCYNTHIA L. CHIARAPPAMAYE C. CHRISMANCAROL T CHRISTASSOCIATE VICECHANCELLOR, HEALTHSCIENCES DEVELOPMENTINTERIM VICE CHANCELLOR ‐RESEARCHSENIOR MANAGINGDIRECTOR, PUBLIC EQUITYINVESTMENTSVICE PRESIDENT‐MEDICALCENTER ADMINISTRATION,UCSF HEALTHVICE DEAN‐FINANCE ANDADMINISTRATION, SCHOOLOF MEDICINEINTERIM EXECUTIVE VICECHANCELLOR AND PROVOSTUCLASalary RangeUCDMRZUCOPMRZUCSFSalary RangeUCSFSalary RangeUCBMRZRON T COLEYHEAD COACH, WOMEN'SBASKETBALLUCLAVICE CHANCELLOR, BUSINESSAND ADMINISTRATIVESERVICESUCRHEIDI MODEL COLLINSVICE PRESIDENT‐CLINICALSYSTEMS, UCSF HEALTHCORI RASHEL CLOSEMARGARET T CONKLARRY D CONRADJOHN K COOKWILLIAM MAURICE COOPERTERESA A COSTANTINIDISM ELIZABETH COWELLPETER F. COWHEYJULIE ELIZABETH CRONERMARY SHANNA CROUGHANMICHELE ELISE CUCULLUPAUL D'ANIERICHIEF STRATEGY OFFICERASSOCIATE VICE CHANCELLORAND CHIEF INFORMATIONOFFICERINTERIM CHIEFINFORMATION OFFICERASSOCIATE VICE PRESIDENT ‐CHIEF PROCUREMENTOFFICERVICE CHANCELLOR/CHIEFFINANCIAL OFFICERUNIVERSITY LIBRARIANINTERIM EXECUTIVE VICECHANCELLORCHIEF ADMINISTRATIVEOFFICEREXECUTIVE DIRECTOR,RESEARCH GRANTSPROGRAM OFFICEDIRECTOR ‐ PRIVATE EQUITYINVESTMENTSPROVOST AND EXECUTIVEVICE CHANCELLORUCSFSalary RangeMRZSalary RangeUCISalary RangeUCBSalary RangeUCDMRZBelow theMaximum SalaryRangeBelow the 75thPercentileBelow the 60thPercentileBelow theMaximum SalaryRangeBelow the MidpointSalary RangeBelow the 25thPercentileNo independentsurvey dataavailableBelow the 60thPercentileBelow theMaximum SalaryRangeBelow the MidpointSalary RangeBelow theMaximum SalaryRangeBelow the ry RangeBelow the 75thPercentileBelow the 75thPercentileBelow the 50thPercentileBelow the 50thPercentileAbove theMaximum SalaryRangeMRZBelow the 25thPercentileUCOPUCOPSalary RangeUCRMRZGRADY PATRICK DANIELCHIEF ADMIN OFFICERUCSDSalary RangeRONALD ANTHONY DAVISCHIEF FINANCIAL OFFICER,UCLA HOSPITAL SYSTEMUCLASalary RangeBelow the MidpointSalary RangeBelow the 50thPercentileBelow theMaximum SalaryRangeBelow theMaximum SalaryRange 350,893 344,931 442,928 347,744 321,360 314,150 97,335 293,865 285,194 41,071 32,793 366,919 359,681 231,750 97,959 250,000 250,000 317,538 311,274 315,706 302,650 364,976 357,266 337,890 334,977 318,723 312,064 16,410 105,271 7,292 6,782 361,341NNNN 460,307NNNN 411,485YNN 333,047NNN5%NN 392,474NNNN 97,959NNNN 474,055NNNN 329,711YNN 44,623 347,273NNNN 62,844 420,110NNNN 334,977NNNN 374,379NNNN 331,664YNN 322,431YNN5%N5%N 60,000 5,400 158,655 18,437 44,344 17,9715%N 342,989 331,664 327,364 283,716 223,871 219,454 219,454YNN 373,000 324,000 324,000NNNN 291,756 290,638 338,078NNNN 203,718 200,256 200,256YNN 241,413 236,651 421,364NNNN 349,830 342,929 375,543YNNN 273,862 273,426 38,567 311,993NNNN 391,400 368,026 85,025 456,339NNNN 38,715 38,687 8,753 184,713 8,916 23,698 3,288Page 3 of 14N5% 710,000N 408,900
Annual Report On Executive Compensation for Calendar Year 2016ADELA DE LA TORRERICHARD D. DECARLOSHELBY K. DECOSTAMARGARET L DELANEYNICHOLAS DIRKSDAVID O. DOBBSLORI R DONALDSONAIMEE DORRMARY M DOYLEDWAINE BRIAN DUCKETTVICE CHANCELLOR ‐ STUDENTAFFAIRS AND CAMPUSDIVERSITYUCDVICE PRESIDENT/CHIEFOPERATING OFFICER,CHILDREN'S SERVICES, UCSFHEALTHUCSFSVP‐STRATEGY AND BUSINESSDEVELOPMENT, UCSF HEALTH UCSFVICE CHANCELLOR ‐PLANNING AND BUDGETUCSCCHANCELLORUCBEXECUTIVE DIRECTOR‐NETWORKED DATAWAREHOUSE, UCSF HEALTH UCSFCHIEF FINANCIAL OFFICER ‐UCSD MEDICAL CENTERUCSDPROVOST AND EXECUTIVE VP ‐ACADEMIC AFFAIRSUCOPVICE CHANCELLOR ‐INFORMATION TECHNOLOGYVICE PRESIDENT,SYSTEMWIDE HUMANRESOURCESDEAN ‐ UNIVERSITYEXTENSIONVICE PRESIDENT/CHIEFMEDICAL OFFICER‐BENIOFFCHILDREN'S HOSPITALOAKLANDUCSCMRZ 327,818 327,818 225,101 221,277 412,500 410,925 62,221UCBSalary RangeUCSFSalary RangeROBIN EPSTEIN LUDEWIGHEAD COACH ‐ FOOTBALLVICE PRESIDENT‐MAJORCONSTRUCTION PROJECTS,UCSF HEALTHCHIEF ADMINISTRATIVEOFFICER, MEDICINE & CHIEFOPERATING OFFICER,FACULTY PRACTICE GROUPVICE PRESIDENT, RESEARCHAND GRADUATE STUDIESDIRECTOR, HUMANRESOURCES PLANNING &TALENT ACQUISITION, UCLAHEALTHUCLASalary RangeDAVID ESQUERHEAD COACH ‐ BASEBALLUCBSalary RangeROGER W FALCONEJOHN G. FALLEUCLASalary RangeUCOPMRZSCIENTIFIC DIVISIONDIRECTORLBNLASSOCIATE VICE PRESIDENT ‐FEDERAL GOVERMENTRELATIONSUCOP 38,554 282,730Salary RangeFARANAK K ELAHI 90,084Below the 60thPercentileBelow the 50thPercentileSalary RangeMRZUCSFARTHUR BARON ELLIS 583,534Below the 60thPercentileMRZMRZJ STUART ECKBLAD 596,562MRZSalary RangeMRZMRZDANIEL DYKES 313,875MRZSalary RangeUCOPDAVID J DURAND 319,300Below theMaximum SalaryRangeBelow theMaximum SalaryRangeBelow the 90thPercentileBelow the 50thPercentileBelow theMaximum SalaryRangeBelow the 25thPercentileBelow the 25thPercentileUCRSHARON A. DUFFYBelow the 90thPercentile 520,000 443,228 282,730 278,707 531,939 522,902 42,380 8,916 48,960 313,875YNNN 673,618NNNN 524,162NNNN 278,707YNNN 30,425 562,243YYNN 18,750 386,397NNN 356,755YNN 324,642 318,687 361,558 354,255 382,454 375,956 375,956YNN 278,707 278,707YNN5%5% 2,500 27,318Below theMaximum SalaryRangeNo independentsurvey dataavailableBelow theMaximum SalaryRange 350,000 341,667 40,000 296,934 291,491 31,590Below theMaximum SalaryRangeBelow the 25thPercentile 336,527 330,809 61,261 300,000 92,391 276,959 268,733 40,334 40,000 170,000 167,152Salary RangeBelow theMaximum SalaryRangeNo independentsurvey dataavailableBelow theMaximum SalaryRange 327,740 314,650MRZBelow the 75thPercentile 304,773 299,093 8,916 5,400N 945,000N 989,100YNNYNNN 17,413 490,559NNNN 2,504,166 2,891,233NNNN 323,081NNNN 392,070NNN 100,443YNN 320,783NNNN 422,852NNNN 314,650NNNN 302,093YNN 215,700 3,000Page 4 of 14NN 364,052 11,716 28,985N5% 221,277 8,052 359,300N5%5%NN
Annual Report On Executive Compensation for Calendar Year 2016VICE PRESIDENT‐HEALTHPLAN STRATEGY/MANAGEDREECE I FAWLEYCARE, UCSF HEALTHVICE CHANCELLOR ‐ HEALTHAFFAIRS AND CHIEFEXECUTIVE OFFICER ‐ UCHOWARD J FEDEROFFIRVINE HEALTH SYSTEMVICE CHANCELLOR PLANNINGDANIEL MARTIN FEITELBERG AND BUDGETVICE CHANCELLOR FORADMINISTRATIVESERVICES/CAMPUSMARC P FISHERARCHITECTINTERIM ASSOCIATE VICEPRESIDENT & DIRECTOR,STATE GOVERNMENTKIERAN FLAHERTYRELATIONSMARGARET G. FOLLETTEEDMOND FONGJEAN ELIZABETH FORDJOHN B FORDANN D FRANKELJULIE ANN FREISCHLAGBARBARA J. FRENCHJULIA MARY COMBSFRIEDLANDERCHIEF CONTRACTINGOFFICER, UCLA HEALTHMANAGING DIRECTOR,ABSOLUTE RETURNSASSOCIATE VICECHANCELLOR, HEALTHSCIENCES ADVANCEMENTVICE CHANCELLOR‐UNIVERSITYDEVELOPMENT/ALUMNIRELATIONS 371,288 303,016 297,868 207,500 177,260 287,777 282,495 295,949UCSFSalary RangeUCIMRZUCMMRZBelow the 25thPercentileBelow the 90thPercentileUCSBMRZBelow the 60thPercentileUCOPMRZUCLASalary RangeUCOPSalary RangeUCSDSalary RangeUCSFMRZDIRECTOR ‐ PATIENTACCOUNTS ADMINISTRATION UCDVICE CHANCELLOR‐HUMANHEALTH SCIENCES AND DEAN‐SCHOOL OF MEDICINEUCDVICE CHANCELLOR‐STRATEGICCOMMUNICATIONS/UNIVERSITY RELATIONSUCSFBelow the 25thPercentileBelow theMaximum SalaryRangeAbove theMaximum SalaryRangeAbove theMaximum SalaryRange 360,942 53,137 800,000 765,277 167,840 288,398 282,709 2,336NNNYNN 298,647YNN 297,868YNNN 179,517NNNN 41,909 324,404NNNN 289,309 208,190 497,499NNNN 340,000 340,000 49,019 400,239NNNN 475,475YNN 310,799NNNN 723,487YNNN 488,036 466,559Salary Range 269,468 264,152MRZBelow the 25thPercentile 537,138 528,012 7,678N 1,004,963Below the 75thPercentileBelow theMaximum SalaryRange 64,168 416,415 15,938 2,256 11,220 8,916 46,647 195,475N5%5%NUCOPMRZUCSFSalary Range 520,163 511,656MRZBelow the 50thPercentile 362,990 355,830Salary RangeBelow theMaximum SalaryRange 276,959 268,733Below the 75thPercentileBelow the 60thPercentile 287,005 282,129 282,129YNN5%N 265,740 261,225 261,225YNN5%NROBERT S. FRIESALISON GALLOWAYCAMPUS PROVOST ANDEXECUTIVE VICE CHANCELLOR UCSCSalary RangeDIANE FIELDS GEOCARISDIRECTOR, LABOR RELATIONS& COMPENSATION, UCLAHEALTHUCLACHIEF CAMPUS COUNSELAND ASSOCIATE GENERALCOUNSELUCIMRZGEOFFREY TAYLOR GIBBSDEPUTY GENERAL COUNSELMRZUCOP 332,748 319,387 319,387NNN 257,500 253,125 253,125YNN 606,099NNNN 355,830YNNN 330,925NNNN 43,537 50,906 40,334 11,716Page 5 of 14 10,142 2,981NBelow the MidpointSalary RangeBelow the 60thPercentileBelow theMaximum SalaryR
Compensation Level (ICL), and (4) incumbents in "Other Specified Employees" (OSE) positions, such as athletic directors and coaches, whose total cash compensation exceeds the ICL. The ICL during calendar year 2016 was 304,000. OBSERVATIONS Executive compensation remains a small percentage of payroll: Compensation for