Transcription
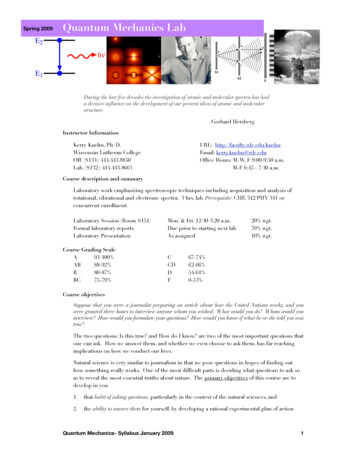
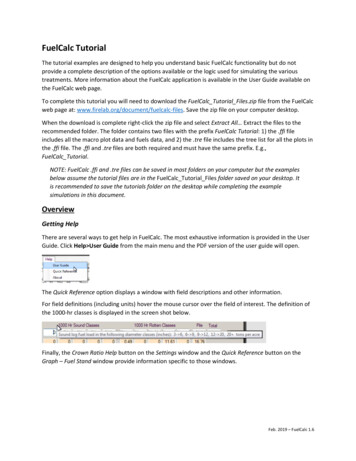
FuelCalc TutorialThe tutorial examples are designed to help you understand basic FuelCalc functionality but do notprovide a complete description of the options available or the logic used for simulating the varioustreatments. More information about the FuelCalc application is available in the User Guide available onthe FuelCalc web page.To complete this tutorial you will need to download the FuelCalc Tutorial Files.zip file from the FuelCalcweb page at: www.firelab.org/document/fuelcalc-files. Save the zip file on your computer desktop.When the download is complete right-click the zip file and select Extract All Extract the files to therecommended folder. The folder contains two files with the prefix FuelCalc Tutorial: 1) the .ffi fileincludes all the macro plot data and fuels data, and 2) the .tre file includes the tree list for all the plots inthe .ffi file. The .ffi and .tre files are both required and must have the same prefix. E.g.,FuelCalc Tutorial.NOTE: FuelCalc .ffi and .tre files can be saved in most folders on your computer but the examplesbelow assume the tutorial files are in the FuelCalc Tutorial Files folder saved on your desktop. Itis recommended to save the tutorials folder on the desktop while completing the examplesimulations in this document.OverviewGetting HelpThere are several ways to get help in FuelCalc. The most exhaustive information is provided in the UserGuide. Click Help User Guide from the main menu and the PDF version of the user guide will open.The Quick Reference option displays a window with field descriptions and other information.For field definitions (including units) hover the mouse cursor over the field of interest. The definition ofthe 1000-hr classes is displayed in the screen shot below.Finally, the Crown Ratio Help button on the Settings window and the Quick Reference button on theGraph – Fuel Stand window provide information specific to those windows.Feb. 2019 – FuelCalc 1.6
FuelCalc TutorialsInitial Setup1. Make sure the FuelCalc Tutorial Files folder is on your computer desktop.2. Run the FuelCalc application by double-clicking the FuelCalc icon on your desktop. FuelCalc willprobably open using default sample files but you will use different files to complete the exampleexercises.3. First, you will need to select a .ffi file. Select File Input FFI, navigate to the FuelCalc Tutorial Filesfolder on your computer desktop, select FuelCalc Tutorial.ffi and click Open.4. Next you will create a “Project File” file that provides links to the associated .ffi and .tre files andstores the treatment, retention priority and species group settings you will create. Click File SaveAsProject, navigate to the FuelCalc Tutorial Files folder on your computer desktop, name the project fileFuelCalc Tutorial.fcp and click Save.2
FuelCalc Tutorials5. Now open the project file you just saved. Click File Open Project, navigate to theFuelCalc Tutorial Files folder on your computer desktop and select FuelCalc Tutorial.fcp.6. The main screen is divided into several sections. At the top is the main menu and fields for the currentplot file (.ffi extension), the selected project (.fcp extension) and the current plot selection. Other plotsare available in the Plot field dropdown.7. The data grid or “treelist” displays the records in the .tre file with additional columns for RetentionPriority (RP), Thinned and Killed; values calculated based on simulation settings. Grayed rows are deadtrees that are not included in any simulation outputs. Data in white cells can be modified but thechanges will not be saved in the tree or project files. Permanent file changes will need to be made in the.tre file, which can be modified in a text editor or, if the extension is changed to .csv, in Excel.3
FuelCalc Tutorials8. The canopy bulk density graph shows a profile of available canopy fuel – all the foliage and half of the0 to ¼” branch material – of live, standing trees on the plot, by height. The blue area is the pretreatment canopy bulk density profile and the orange area is post-treatment profile. Double-click thegraph to see a larger version. Right-click the graph to see printing and saving options.9. In the Stand Measurements section the pre-treatment and post-treatment Canopy Fuel Load (CFL),Canopy Bulk Density (CBD), Canopy Base Height (CBH), Stand Height (SH), Tree Density (TD), StandDensity Index (SDI), Canopy Cover (CC), Basal Area (BA), Quadratic Mean Diameter (QMD) and 75thPercentile Diameter (Q75) values are displayed.10. Torching Index (TORI) and Crowning Index (CRNI) are calculated for pre-treatment and posttreatment conditions. Torching Index includes surface and crown fuels and is the minimum 20-foot windspeed needed to initiate passive crowning or torching of individual trees. Crowning Index includes onlycrown fuels and is the minimum 20-foot wind speed needed to sustain an active crown fire. Clicking theMoistures button displays the moistures used to calculate the indices.11. The middle section displays the fuel loading of various components. The .ffi file includes all pretreatment fuel information. Values in the Pre-treatment row can be modified in the user interface butthe changes will not be saved in the plot or project files. Permanent file changes will need to be made inthe .ffi file, which can be modified in a text editor or, if the extension is changed to .csv, in Excel.4
FuelCalc Tutorials12. The bottom section is dominated by options for setting the four available treatments: Thinning,Prune, Pile and Broadcast Burn treatments. Treatments are simulated in order from left to right.Example Thin and Burn TreatmentsAssume you want to thin a stand to: 1) reduce stand density to about 100 trees per acre, 2) reduce basalto about 50 square feet per acre, 3) provide some merchantable material, while leaving stock for afuture thin, and 4) reduce fire risk. You will use the Stand Measurements, Timber Volume and Torchingand Crowning indices sections of the user interface, respectively, to evaluate three alternativetreatments.Thin Treatment Simulation 1Run a basic simulation to reduce stand density to 100 trees per acre (TPA) with 90% efficiency and 10%yard loss. Assume merchantable trees have a 4” top.1. Make sure the FuelCalc Tutorial project file is open. If not, click File Open Project, navigate to theFuelCalc Tutorial Files folder on your computer desktop, select the FuelCalc Tutorial.fcp file and clickOpen.2. The Plot dropdown list includes all the plots in the .ffi. For the examples you will use the first plot:1 : Baseline.3. Set up a Thinning simulation. Check the box for Thinning treatment and enter the values shownbelow.5
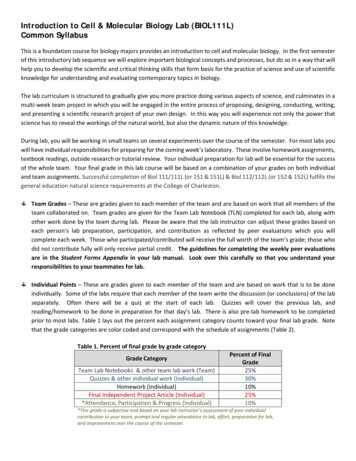
FuelCalc Tutorials4. Uncheck the boxes for the Prune, Pile and Broadcast Burn treatments, if they are checked.5. Save the treatment settings so it can be reused later. Type Thin 0 to 99 in the Treatment Name field(spaces are not allowed in Treatment Names) and click the Save Treatment button below the field. TheSettings window will open and the new treatment will be displayed. You can leave the Settings windowopen, minimize it or close it by clicking the “X” in the upper right of the window.NOTE: You may open the Settings window at any time by clicking Option Settings.6. Retention Priority Sets are used to set retention preferences for some species; they will beexplained more in the third example. For now, set the Retention Priority Set to None by selecting it inthe dropdown.7. Click File Save Project, select Fuelcalc Tutorial.fcp, click Save and click Yes to overwrite the file. If youdon’t save your project the new Treatment will be lost when FuelCalc is closed.8. Click the Calculate button to run the simulation. First, look at the treelist in the upper left. The threerightmost shaded columns display Retention Priority (RP), Thinned and Killed. Retention priority ranksthe tree records for thinning with higher priority trees more likely to be retained. The retention priorityfor each record in the tree list is the product of all retention priorities defined in the Retention Prioritiestable on the Settings window and those assigned to each species in the Species Group table. To see theSpecies Group retention priorities click open the Settings window (Options Settings) and click theSpecies Group button at the bottom of the window.6
FuelCalc TutorialsIn this example, all retention priorities for the None retention priority set equal 1 and in the SpeciesGroup all tree species ( Other) are set to 0.5. The product of those is 1 x 0.5 0.5, so all records areassigned that retention priority (dead trees do not get assigned retention priority). If tree records havethe same RP trees then they are thinned by Num, which is the tree record number, in ascending order.On this plot the trees were entered with descending DBH, so the largest trees are thinned first. Checkthe Thinned column as you scroll down in the treelist and note the last record with thinned trees is row23. No additional trees need to be thinned to meet the target of 100 TPA. Only 9 of the 10 trees perrecord were thinned because the Cut Efficiency is set to 90%. No trees were killed because a BroadcastBurn was not included in the simulation.Species CodesPIPO: ponderosa pineLAOC: western larchPSME: Douglas-firABGR: grand fir9. The Canopy Bulk Density (CBD) profile shows how available crown fuels (all of the foliage and half ofthe 0 to ¼” branch material) are distributed by height as an aggregate across the trees in the treelist.The blue area is CBD density before the thinning and orange shows CBD after thinning.10. Post-treatment tree density (TD) is the desired 100 TPA but the basal area (BA) and quadratic meandiameter (QMD) are quite low indicating mostly small diameter trees remain after thinning. Canopybase height (CBH) remains unchanged.NOTE: In FuelCalc, CBH is the lowest point where the 5-foot running mean canopy bulk density(CBD) is equal to the “Threshold” CBD. When maximum CBD is equal to or greater than 0.12kg/m3 then the Threshold CBD is 0.012 kg/m3. If the maximum CBD does not exceed 0.127
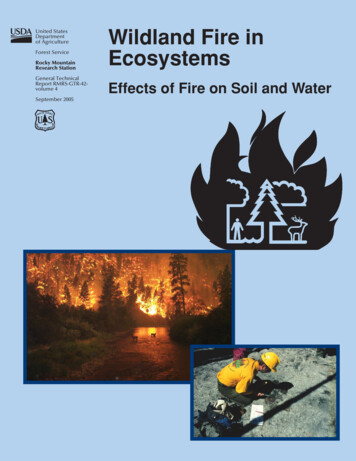
FuelCalc Tutorialskg/m3 then FuelCalc calculates the Threshold CBD as 10% of maximum CBD. Stand height (SH)is the highest point where CBD exceeds the Threshold CBD.11. The treatment removes approximately 90% of the standing volume, providing approximately 21,870merchantable board feet per acre (M B Ft). Other volume values are cubic feet (Cubic Ft) andmerchantable cubic feet (M C Ft)NOTE: Consider the Timber Volume values in FuelCalc as estimates. They are calculated withgeneral species specific volume equations and merchantable volume is not reduced to accountfor defects such as rot and checks.12. The thinning increased the minimum 20-foot wind speed needed to maintain an active crown fire(Crowning Index - CRNI) from 50 to 100 mph. This is because the maximum CBD was reduced by thethinning so it is more difficult to maintain an active crown fire in the treated stand. A 20-foot wind speedof 50 mph would be pretty unusual so the increase to 100 may not be considered important. Theminimum 20-foot wind speed needed to initiate passive crowning (Torching Index – TORI) remained at 0mph because: some surface fuels increased, the CBH was lower post-treatment and the thinned standmodified the wind speed reduction factor. The litter, 1-, 10- and 100-hr fuels shown in the Post ThinningSlash row are yard loss (as set in the Yard Loss % field) and additional fuels from limb breakage, etc.Treatment Review:ComponentStand densityBasal areaMerchantable materialFire riskResultTarget metToo lowProvides substantial merchantable volumeCrowning Index increases; Torching Index unchanged8
FuelCalc TutorialsThin Treatment Simulation 21. In the first simulation most of the large trees were thinned. In this exercise you will exclude the largertrees from the treatment. Change the upper DBH range of trees to be considered for thinning to 12.2. Change the Treatment Name to Thin 0 to 12, click Save Treatment. Minimize or close the Settingswindow.3. Click File Save Project to save the changes. If you don’t save your project the new treatment will belost when FuelCalc is closed.4. Click Calculate.5. In this simulation the larger trees are retained - the first thinned tree record is number 10 – PIPO 11.8DBH.6. The CBD graph clearly shows the crown material of the smaller trees that were thinned (blue area).9
FuelCalc Tutorials7. The post-treatment tree density is 100 TPA as in the first exercise but the BA and QMD aresubstantially higher because the large trees were not thinned. Also note the CBH has increased to 22feet due to the removal of the smaller diameter trees.8. Harvested merchantable timber is a lot lower is this simulation – just 1440 board feet per acre –because only small trees were harvested and just some of those harvested had DBH greater than the 4”merchantable diameter cutoff (Merch dia ). Only trees greater than or equal to the cutoff are includedin the merchantable Timber Volume.9. The Torching Index (TORI) increased to 58 mph post-treatment primarily because the CBH increasedto 22 feet. The same number of trees were thinned but they were smaller and had less crown materialso there is less Post Thinning Slash than in the first simulation. Crowning Index remained the samebecause the maximum CBD remained unchanged by the thinning treatment.Treatment Review:ComponentStand densityBasal areaMerchantable materialFire riskResultTarget metToo highProvides little merchantable volumeCrowning Index unchanged, Torching Index increasedThin and Burn Treatment SimulationThe first two exercises thinned only small trees or large trees. Both met the tree density target. The firstprovided substantial timber volume but didn’t reduce fire risk. The second reduced fire risk but didn’tprovide much timber. In this exercise you will set up a treatment to thin all trees greater than 4” DBHand use the Retention Priority table to prioritize the trees that are retained. You will also simulate abroadcast burn with the goal of reducing the density of trees less than 4” DBH.1. FuelCalc allows you to save Retention Priority Sets that use tree status, crown class and crown ratio toprioritize tree retention. Select Options Settings and enter data in a new row of the Retention Prioritiestable (the bottom table on the page). In the bottom blank row of the table, name the new set10
FuelCalc TutorialsRestoration and enter the other values shown below. Click the Apply button below the table whenfinished.The priorities are to retain a tree; trees with values closer to 1.0 are more likely to be retained. The RPshown in the treelist on the main screen is the product of the individual retention priority values. Theretention priorities you just added in the Restoration Retention Priorities Set will preferentially retainhealthy, dominant, codominant, emergent and open grown trees over trees in the other Tree Status andCrown Classes.2. You can also create a list of species specific retention priorities to favor retention of certain treespecies over others. In this exercise you will set PIPO in the largest class to always be retained. The othersettings will retain PIPO and LAOC with variable preference over other species.Click the Species Group button at the lower right of the Settings window. Select the PIPO species groupfrom the dropdown on the left.3. Enter the values in the screen shot below. You can click in any populated cell to change the value. Addnew rows at the bottom. It is important to always include a row for the species Other to identify theretention priority for the species not shown in the remainder of the table. The note at the lower leftdefines special codes used to always remove or always retain trees identified in the row.NOTE: To delete a row in the table click the gray area to the left of the row to highlight it and thenclick the Delete key on your keyboard.11
FuelCalc Tutorials4. In the Species Group window click File Save Group As.5. Type the species group name PIPO Restore in the field at the upper right and click OK. The newSpecies Group name will display in the dropdown field. Close the Species Group window by clicking “X”in the upper right.12
FuelCalc Tutorials6. In the Settings window, click the Species Group dropdown for the Restoration Retention Prioritiesgroup and select PIPO Restore. Click Apply at the lower right below the Retention Priorities table.Minimize or close the Settings window.7. Select the Restoration Retention Priority Set in the dropdown at the lower left on the main screen.8. In reality small trees will probably not be thinned by a saw crew so modify the treatment to thin justtrees greater than 4” DBH. Select the Thin 0 to 99 treatment, change the lower DBH limit to 4”, changethe treatment name to Thin 4 to 99 and click Save Treatment.NOTE: The retention priority rules in the Species Group will be applied to all trees within theDBH range entered in the Thinning group box.9. Make the settings to simulate a burn to remove some of the trees less than 4” DBH. Check the box toinclude a Broadcast Burn and set the Scorch Height (Scorch Hgt (ft)) to 4’. Set the Moisture regime toModerate.NOTE: There is a bug in FuelCalc 1.6 that sometimes causes the moisture values to be set to0. If this happens simply select the desired moisture regime from the dropdown and thecorrect moisture values will be assigned.13
FuelCalc TutorialsNOTE: Tree mortality is a function of scorch height and DBH. The other settings in theBroadcast Burn box are used to modify fuel consumption and emissions.10. Click Save Treatment to update the Thin 4 to 99 treatment. Your simulation settings should looklike this.11. Click File Save Project save the changes in the project file. If you don’t save your project all theunsaved Treatments, Retention Priorities and Species Groups will be lost when FuelCalc is closed.12. Click Calculate.13. Compared to the first two examples the crown material reduction is more evenly distributedthroughout the canopy. The crown material for the large trees and, to a lesser extent, small treesremaining after the treatments are evident.14
FuelCalc Tutorials14. The Thinned and Killed columns show the trees removed by the thinning and burning treatment,respectively. The thinning rules removed many large trees (rows where Thinned 0.0) and the burnkilled two of the largest PIPO.15. The Species Group you created included a rule to retain all PIPO 20” DBH and those trees areidentified in the treelist with the code 99 in the RP column (e.g., record #1). Tree records coded 99 willnot have trees removed by thinning but they may be removed by burning. The RP for the second recordis 0.7. This value is the product of all retention priorities assigned to the record:ComponentSettingTree StatusCrown ClassSpecies GroupHealthyDominantLAOC 4”– 99”RetentionPriority1.01.00.7Q: Why was one, each, of the largest PIPO trees killed by the fire but smaller diameter PIPO werenot killed?A: The number of killed trees is the product of the probability of mortality (P(m)) and treedensity. The P(m) for the three largest PIPO records is 0.06 (this value is not shown in FuelCalc).None of the trees in records #1 or #3 were thinned so post-thin tree density is 10 TPA. Thenumber killed is: 10 x 0.06 0.6; which gets rounded to 1. Nine of the ten trees in record #4 werethinned so tree density is 1 TPA. The number killed is: 1 x 0.06 0.06, which gets rounded to 0.16. Scroll down in the treelist and you will note trees less than 4” DBH were not thinned (Thinned 0.0)because of the diameter range selected for the thin but some were killed by the fire.15
FuelCalc Tutorials17. The combined thin and burn treatments reduced tree density and basal area to near the desiredlevels of 100 TPA and 50 ft2, respectively.NOTE: It is possible that the Treatment, Retention Priority and/or Species Group settings willrestrict the tree records available for thinning to the point the thinning target cannot be met.When this happens settings will need to be modified if meeting the target is a priority.18. The thinning treatment removed just over half of the merchantable material providing over 12,000board feet while maintaining growing stock for the remaining stand.19. Torching index increased substantially and, while Crowning Index was already high, it also increased.In FuelCalc, the maximum wind speed for Crowning Index and Torching Index is 100 mph so followingthese thin and burn treatments the simulated fire risk is at its lowest.Review:ComponentStand densityBasal areaMerchantable materialFire riskResultTarget metTarget metProvides merchantable volumeBoth indices indicate low risk16
FuelCalc TutorialsExample Prune and Pile TreatmentsThe following simulations will demonstrate the Prune and Pile treatments.Prune Treatment Simulation1. Select the Thin 0 to 99 Treatment, set Retention Priority Set to Restoration and uncheck the boxesfor the Thinning and Broadcast Burn treatment.2. There are two fields in the Prune group box. The first is for the maximum height that crown materialwill be pruned (Height). The second is the minimum remaining crown ratio (MRCR %). The MRCR %setting will stop pruning at a height where the crown ratio of the tree record equals the MCRC %. Checkthe box to perform a pruning treatment. Set Height to 10 and MRCR % to 50. It is probably not realisticthat managers would prune small trees so these settings will minimize pruning of them. Click Calculate.3. The CBD profile shows how the lower part of the crown was modified by the pruning.17
FuelCalc Tutorials4. The Post Prune Slash row shows a small amount of material added to the surface fuels. Note thatFuelCalc does not calculate the loading of 1000-hr pruning slash. The Post-treatment row shows totalfuels.Prune and Pile Treatment Simulation1. The Pile treatment allows piling of a percentage of the pre-treatment fuels (Surface %), slash fuels(Slash %) and sets the percentage of large size/coarse fuel loading consumed when the piles are burned(Consumed %). Leave the Prune box checked and keep the settings the same. Check the Pile box and setSurface % to 50, Slash % to 75 and Consumed % to 90. Click Calculate.2. The Surface Fuel Piled row shows 50% of the Pre-treatment row and 75% of the Post Prune Slash fuelswere piled. The value in the Pile column is the total of only the piled Pre-treatment fuels. Note FuelCalceven piled half of the 12” to 20” class but in reality these large size 1000-hr fuels may not be piledbecause they are too heavy to move.3. The Post Prune Slash row now shows 25% of the total loading the in litter, 1-, 10- and 100-hr pruningmaterial as un-piled and the remaining 75% in the Pile column at the right.18
FuelCalc Tutorials4. The consumed pile material is displayed in the Pile column of the Consumed row. The Consumed Pileamount includes 100% of the fine material and 90% of the coarse material (as set in the Consumed %field): 4.815 (12.1 x 0.9) 15.705 tons/acre consumed.Reports and GraphsFuelCalc incudes basic Report and Graph features. Reports are available for individual plots only.ReportsClick Report Plot Report. This report shows: 1) pre- and post-treatment fuel loading, the loading of unpiled Thinning and Prune slash and consumed fuels, if the associated treatments are simulated, 2) preand post-treatment Stand Measurements and 3) emissions from broadcast and/or pile burning.Click Report Tree Report to see a copy of the records in the treelist for the currently selected plot,Standing and Harvested Timber Volume, Treatment Name, thinning type and Broadcast Burn (Yes, No).The Plot CSV file (Report Plot CSV File) reproduces the fuel loading portion of the user interface (prethrough post-treatment fuels), Stand Measurements, torching and crowning index and Timber Volume.The Tree CSV file (Report Tree CSV File) reproduces the treelist and also includes the Treatment Nameand Retention Priority Set name.19
FuelCalc TutorialsGraphs – Fuel StandClick Graph Fuel Stand to view a window with several graphs. The top bar graphs show the pretreatment, post-thinning and pruning, post-pile and post-burn loading for fine and coarse fuels. Rightclick the graph area for options to save or print the graphs.Pie charts show the percent removed for a number of the Stand Measurements and percent harvestedTimber Volume.The Stand Watch graph updates automatically as treatments are changed on the user interface. Thevalue that is graphed is selected in the dropdown below the graph: Canopy Fuel Load, Canopy BulkDensity, Tree Density and Basal Area. Right-click the graph area for options to save or print the graph.Click Reset to clear the Stand Watch graph. It will clear automatically after 50 simulations.20
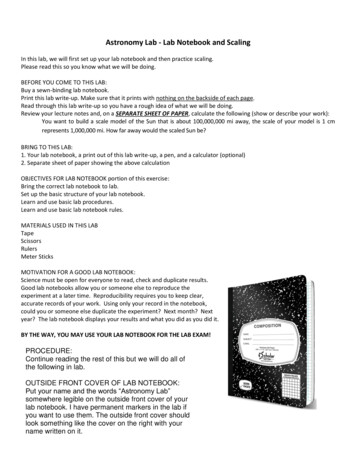
FuelCalc TutorialsGraphs - EmissionsSelect the Thin 4 to 99 treatment, click Calculate and click Graph Emission to view a graph ofemissions from the broadcast burn.The graph opens displaying the PM2.5 emissions (pounds per acre) by time (minutes). The jaggedappearance of the emission graph is because different fuel components burn at different rates. Thecheckboxes in the upper left are used to select the smoke component(s) of interest. Flaming, Smolderingand Total emissions by component are shown for seven smoke components at the bottom. Fields tolimit and rotate axes are on the right.The graph below displays PM2.5, CO and CO2 emissions. The axis limits have been set and rotated tomore clearly display the relationship of the three components over time.21
includes all the macro plot data and fuels data, and 2) the .tre file includes the tree list for all the plots in the .ffi file. The .ffi and .tre files are both required and must have the same prefix. E.g., FuelCalc_Tutorial. NOTE: FuelCalc .ffi and .tre files can be saved in most folders on your computer but the examples