Transcription
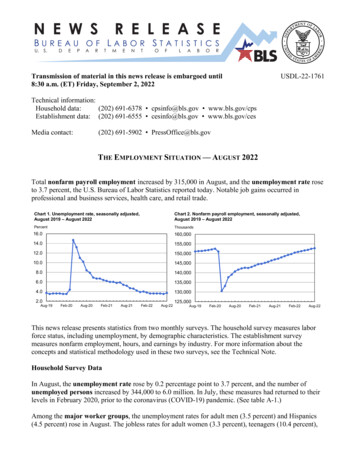
Transmission of material in this news release is embargoed until8:30 a.m. (ET) Friday, September 2, 2022USDL-22-1761Technical information:Household data:(202) 691-6378 cpsinfo@bls.gov www.bls.gov/cpsEstablishment data: (202) 691-6555 cesinfo@bls.gov www.bls.gov/cesMedia contact:(202) 691-5902 PressOffice@bls.govTHE EMPLOYMENT SITUATION — AUGUST 2022Total nonfarm payroll employment increased by 315,000 in August, and the unemployment rate roseto 3.7 percent, the U.S. Bureau of Labor Statistics reported today. Notable job gains occurred inprofessional and business services, health care, and retail trade.Chart 1. Unemployment rate, seasonally adjusted,August 2019 – August 2022Chart 2. Nonfarm payroll employment, seasonally adjusted,August 2019 – August 19Feb-20Aug-20Feb-21Aug-21Feb-22Aug-22This news release presents statistics from two monthly surveys. The household survey measures laborforce status, including unemployment, by demographic characteristics. The establishment surveymeasures nonfarm employment, hours, and earnings by industry. For more information about theconcepts and statistical methodology used in these two surveys, see the Technical Note.Household Survey DataIn August, the unemployment rate rose by 0.2 percentage point to 3.7 percent, and the number ofunemployed persons increased by 344,000 to 6.0 million. In July, these measures had returned to theirlevels in February 2020, prior to the coronavirus (COVID-19) pandemic. (See table A-1.)Among the major worker groups, the unemployment rates for adult men (3.5 percent) and Hispanics(4.5 percent) rose in August. The jobless rates for adult women (3.3 percent), teenagers (10.4 percent),
Whites (3.2 percent), Blacks (6.4 percent), and Asians (2.8 percent) showed little change over themonth. (See tables A-1, A-2, and A-3.)Among the unemployed, the number of permanent job losers increased by 188,000 to 1.4 million inAugust. The number of persons on temporary layoff was virtually unchanged at 782,000. (See table A11.)The number of long-term unemployed (those jobless for 27 weeks or more) was little changed at 1.1million in August. The long-term unemployed accounted for 18.8 percent of all unemployed persons.(See table A-12.)The labor force participation rate increased by 0.3 percentage point over the month to 62.4 percent butis 1.0 percentage point below its February 2020 level. The employment-population ratio was littlechanged at 60.1 percent in August and remains 1.1 percentage points below its February 2020 value.(See table A-1.)The number of persons employed part time for economic reasons was little changed at 4.1 million inAugust. These individuals, who would have preferred full-time employment, were working part timebecause their hours had been reduced or they were unable to find full-time jobs. (See table A-8.)The number of persons not in the labor force who currently want a job declined by 361,000 to 5.5million in August. This measure remains above its February 2020 level of 5.0 million. These individualswere not counted as unemployed because they were not actively looking for work during the 4 weekspreceding the survey or were unavailable to take a job. (See table A-1.)Among those not in the labor force who wanted a job, the number of persons marginally attached tothe labor force, at 1.4 million, was little changed in August. These individuals wanted and wereavailable for work and had looked for a job sometime in the prior 12 months but had not looked forwork in the 4 weeks preceding the survey. Discouraged workers, a subset of the marginally attachedwho believed that no jobs were available for them, numbered 366,000 in August, little changed from theprior month. (See Summary table A.)Household Survey Supplemental DataIn August, 6.5 percent of employed persons teleworked because of the coronavirus pandemic, downfrom 7.1 percent in the prior month. These data refer to employed persons who teleworked or worked athome for pay at some point in the 4 weeks preceding the survey specifically because of the pandemic.In August, 1.9 million persons reported that they had been unable to work because their employerclosed or lost business due to the pandemic—that is, they did not work at all or worked fewer hours atsome point in the 4 weeks preceding the survey due to the pandemic. This measure is down from 2.2million in the previous month. Among those who reported in August that they were unable to workbecause of pandemic-related closures or lost business, 21.5 percent received at least some pay fromtheir employer for the hours not worked, little different from the previous month.Among those not in the labor force in August, 523,000 persons were prevented from looking for workdue to the pandemic, little changed from the prior month. (To be counted as unemployed, by definition,individuals must be either actively looking for work or on temporary layoff.)-2-
These supplemental data come from questions added to the household survey in May 2020 to help gaugethe effects of the pandemic on the labor market. The data are not seasonally adjusted. Tables withestimates from the supplemental questions for all months are available online -19-pandemic.htm. (For more information aboutupcoming changes to these supplemental data, see the box note on page 4.)Establishment Survey DataTotal nonfarm payroll employment increased by 315,000 in August. Nonfarm employment has risenby 5.8 million over the past 12 months, as the labor market continued to recover from the job losses ofthe pandemic-induced recession. This growth brings total nonfarm employment 240,000 higher than itspre-pandemic level in February 2020. In August, notable job gains occurred in professional and businessservices, health care, and retail trade. (See table B-1.)Professional and business services added 68,000 jobs in August. Within the industry, employmentgains occurred in computer systems design and related services ( 14,000), management and technicalconsulting services ( 13,000), architectural and engineering services ( 10,000), and scientific researchand development services ( 6,000), while legal services lost jobs (-9,000). Over the past 12 months,professional and business services has added 1.1 million jobs.In August, health care employment rose by 48,000, with job gains in offices of physicians ( 15,000),hospitals ( 15,000), and nursing and residential care facilities ( 12,000). Health care has added 412,000jobs over the year. Despite this growth, employment in health care is below its February 2020 level by37,000, or 0.2 percent.Retail trade added 44,000 jobs in August and 422,000 jobs over the past 12 months. In August,employment increased in general merchandise stores ( 15,000), food and beverage stores ( 15,000),health and personal care stores ( 10,000), and building material and garden supply stores ( 7,000).Employment in furniture and home furnishings stores continued to trend down (-3,000).Manufacturing employment continued to trend up in August ( 22,000), with gains concentrated indurable goods industries ( 19,000). Manufacturing has added 461,000 jobs over the year.Employment in financial activities rose by 17,000 in August and by 200,000 over the year.Employment in wholesale trade increased by 15,000 in August, returning to its February 2020 level.This industry has added 197,000 jobs over the year.Mining employment rose by 6,000 in August, reflecting a gain in support activities for mining ( 7,000).Over the year, mining has added 68,000 jobs.Employment in leisure and hospitality changed little in August ( 31,000), following average monthlygains of 90,000 in the first 7 months of the year. Employment in leisure and hospitality is below itsFebruary 2020 level by 1.2 million, or 7.2 percent.In August, employment showed little change in other major industries, including construction,transportation and warehousing, information, other services, and government.-3-
In August, average hourly earnings for all employees on private nonfarm payrolls rose by 10 cents, or0.3 percent, to 32.36. Over the past 12 months, average hourly earnings have increased by 5.2 percent.In August, average hourly earnings of private-sector production and nonsupervisory employees roseby 10 cents, or 0.4 percent, to 27.68. (See tables B-3 and B-8.)The average workweek for all employees on private nonfarm payrolls decreased by 0.1 hour to 34.5hours in August. In manufacturing, the average workweek for all employees was little changed at 40.3hours, and overtime held at 3.3 hours. The average workweek for production and nonsupervisoryemployees on private nonfarm payrolls declined by 0.1 hour to 33.9 hours. (See tables B-2 and B-7.)The change in total nonfarm payroll employment for June was revised down by 105,000, from 398,000to 293,000, and the change for July was revised down by 2,000, from 528,000 to 526,000. Withthese revisions, employment in June and July combined is 107,000 lower than previously reported.(Monthly revisions result from additional reports received from businesses and government agenciessince the last published estimates and from the recalculation of seasonal factors.)The Employment Situation for September is scheduled to be released on Friday, October 7, 2022,at 8:30 a.m. (ET).Upcoming Changes to Household Survey Supplemental DataThe supplemental questions that BLS added to the household survey in May 2020 to examine the effectsof the coronavirus (COVID-19) pandemic on the labor market will be asked for the last time inSeptember 2022. These questions ask whether people teleworked or worked from home because of thepandemic; whether people were unable to work because their employers closed or lost business due tothe pandemic; whether they were paid for that missed work; and whether the pandemic prevented jobseeking activities. These questions have become less relevant than they were earlier in the pandemic.The September 2022 Employment Situation news release published on October 7, 2022, will be the lastnews release to contain data from these questions.To improve the relevancy of the supplemental pandemic-related questions, four new questions that focuson telework will be asked starting in October 2022. These new questions will ask whether peopleteleworked or worked from home during the survey reference week; how many hours they teleworked;whether they teleworked prior to the pandemic; and whether they teleworked more, less, or about thesame as before the pandemic.Because data from the new questions will take time to process and review, the Household SurveySupplemental Data section of the Employment Situation news release will be temporarily discontinuedwith the release of October data on November 4, 2022. More information about the new questions,including future announcements about the availability of data from these questions, will be available -19-pandemic.htm .-4-
HOUSEHOLD DATASummary table A. Household data, seasonally adjusted[Numbers in thousands]CategoryAug.2021June2022July2022Change from:July 2022Aug. 2022Aug.2022Employment statusCivilian noninstitutional population. . . . . . . . . . . . . . . . . . . . . . . . . . . . . . . . . . . . . . . . . . .Civilian labor force. .Participation rate. . . . . . . . . . . . . . . . . . . . . . . . . . . . . . . . . . . . . . . . . . . . . . . . . . . . . . . . . .Employed. .Employment-population ratio. .Unemployed. . . . . . . . . . . . . . . . . . . . . . . . . . . . . . . . . . . . . . . . . . . . . . . . . . . . . . . . . . . . . . .Unemployment rate. . . . . . . . . . . . . . . . . . . . . . . . . . . . . . . . . . . . . . . . . . . . . . . . . . . .Not in labor force. . . . . . . . . . . . . . . . . . . . . . . . . . . . . . . . . . . . . . . . . . . . . . . . . . . . . . . . . . . Unemployment ratesTotal, 16 years and over. . . . . . . . . . . . . . . . . . . . . . . . . . . . . . . . . . . . . . . . . . . . . . . . . . . . . .Adult men (20 years and over). . . . . . . . . . . . . . . . . . . . . . . . . . . . . . . . . . . . . . . . . . . .Adult women (20 years and over). . . . . . . . . . . . . . . . . . . . . . . . . . . . . . . . . . . . . . . . .Teenagers (16 to 19 years). . . . . . . . . . . . . . . . . . . . . . . . . . . . . . . . . . . . . . . . . . . . . . . .White. . . . . . . . . . . . . . . . . . . . . . . . . . . . . . . . . . . . . . . . . . . . . . . . . . . . . . . . . . . . . . . . . . . . . . . . . .Black or African American. . . . . . . . . . . . . . . . . . . . . . . . . . . . . . . . . . . . . . . . . . . . . . . . . .Asian. . . . . . . . . . . . . . . . . . . . . . . . . . . . . . . . . . . . . . . . . . . . . . . . . . . . . . . . . . . . . . . . . . . . . . . . . .Hispanic or Latino ethnicity. 50.20.30.2-1.10.10.40.20.6Total, 25 years and over. . . . . . . . . . . . . . . . . . . . . . . . . . . . . . . . . . . . . . . . . . . . . . . . . . . . . .Less than a high school diploma. . . . . . . . . . . . . . . . . . . . . . . . . . . . . . . . . . . . . . . . . .High school graduates, no college. . . . . . . . . . . . . . . . . . . . . . . . . . . . . . . . . . . . . . . .Some college or associate degree. . . . . . . . . . . . . . . . . . . . . . . . . . . . . . . . . . . . . . . .Bachelor’s degree and higher. .24.22.91.90.20.30.60.1-0.1Reason for unemploymentJob losers and persons who completed temporary jobs. . . . . . . . . . . . . . . . . .Job leavers. .Reentrants. .New entrants. ,7208981,8364401735610-20Duration of unemploymentLess than 5 weeks. . . . . . . . . . . . . . . . . . . . . . . . . . . . . . . . . . . . . . . . . . . . . . . . . . . . . . . . . . . . .5 to 14 weeks. .15 to 26 weeks. . . . . . . . . . . . . . . . . . . . . . . . . . . . . . . . . . . . . . . . . . . . . . . . . . . . . . . . . . . . . . . . .27 weeks and over. 181,0672,2231,8078851,1371433516770Employed persons at work part timePart time for economic reasons. . . . . . . . . . . . . . . . . . . . . . . . . . . . . . . . . . . . . . . . . . . . . .Slack work or business conditions. . . . . . . . . . . . . . . . . . . . . . . . . . . . . . . . . . . . . . . .Could only find part-time work. . . . . . . . . . . . . . . . . . . . . . . . . . . . . . . . . . . . . . . . . . . . .Part time for noneconomic reasons. 791021,1034,1492,76997921,0442257269-59Persons not in the labor forceMarginally attached to the labor force. . . . . . . . . . . . . . . . . . . . . . . . . . . . . . . . . . . . . . .Discouraged workers. .1,5763891,5043641,5454241,434366-111-58NOTE: Persons whose ethnicity is identified as Hispanic or Latino may be of any race. Detail for the seasonally adjusted data shown in this table willnot necessarily add to totals because of the independent seasonal adjustment of the various series. Updated population controls are introducedannually with the release of January data.
ESTABLISHMENT DATASummary table B. Establishment data, seasonally adjustedAug.2021June2022EMPLOYMENT BY SELECTED INDUSTRY(Over-the-month change, in thousands)Total nonfarm. . . . . . . . . . . . . . . . . . . . . . . . . . . . . . . . . . . . . . . . . . . . . . . . . . . . . . . . . . . . . . . . . . . . . . . . . . . . . .Total private. . . . . . . . . . . . . . . . . . . . . . . . . . . . . . . . . . . . . . . . . . . . . . . . . . . . . . . . . . . . . . . . . . . . . . . . . . . . .Goods-producing. . . . . . . . . . . . . . . . . . . . . . . . . . . . . . . . . . . . . . . . . . . . . . . . . . . . . . . . . . . . . . . . . . . . . .Mining and logging. . . . . . . . . . . . . . . . . . . . . . . . . . . . . . . . . . . . . . . . . . . . . . . . . . . . . . . . . . . . . . . . . .Construction. . . . . . . . . . . . . . . . . . . . . . . . . . . . . . . . . . . . . . . . . . . . . . . . . . . . . . . . . . . . . . . . . . . . . . . . .Manufacturing. . . . . . . . . . . . . . . . . . . . . . . . . . . . . . . . . . . . . . . . . . . . . . . . . . . . . . . . . . . . . . . . . . . . . . .Durable goods1. . . . . . . . . . . . . . . . . . . . . . . . . . . . . . . . . . . . . . . . . . . . . . . . . . . . . . . . . . . . . . . . . . .Motor vehicles and parts. . . . . . . . . . . . . . . . . . . . . . . . . . . . . . . . . . . . . . . . . . . . . . . . . . . . . . .Nondurable goods. . . . . . . . . . . . . . . . . . . . . . . . . . . . . . . . . . . . . . . . . . . . . . . . . . . . . . . . . . . . . . . .Private service-providing. . . . . . . . . . . . . . . . . . . . . . . . . . . . . . . . . . . . . . . . . . . . . . . . . . . . . . . . . . . . . .Wholesale trade. . . . . . . . . . . . . . . . . . . . . . . . . . . . . . . . . . . . . . . . . . . . . . . . . . . . . . . . . . . . . . . . . . . . .Retail trade. . . . . . . . . . . . . . . . . . . . . . . . . . . . . . . . . . . . . . . . . . . . . . . . . . . . . . . . . . . . . . . . . . . . . . . . . .Transportation and warehousing. . . . . . . . . . . . . . . . . . . . . . . . . . . . . . . . . . . . . . . . . . . . . . . . . . . .Utilities. . . . . . . . . . . . . . . . . . . . . . . . . . . . . . . . . . . . . . . . . . . . . . . . . . . . . . . . . . . . . . . . . . . . . . . . . . . . . .Information. . . . . . . . . . . . . . . . . . . . . . . . . . . . . . . . . . . . . . . . . . . . . . . . . . . . . . . . . . . . . . . . . . . . . . . . . .Financial activities. . . . . . . . . . . . . . . . . . . . . . . . . . . . . . . . . . . . . . . . . . . . . . . . . . . . . . . . . . . . . . . . . . .Professional and business services1. . . . . . . . . . . . . . . . . . . . . . . . . . . . . . . . . . . . . . . . . . . . . . . .Temporary help services. . . . . . . . . . . . . . . . . . . . . . . . . . . . . . . . . . . . . . . . . . . . . . . . . . . . . . . . . .Education and health services1. . . . . . . . . . . . . . . . . . . . . . . . . . . . . . . . . . . . . . . . . . . . . . . . . . . . .Health care and social assistance. . . . . . . . . . . . . . . . . . . . . . . . . . . . . . . . . . . . . . . . . . . . . . . .Leisure and hospitality. . . . . . . . . . . . . . . . . . . . . . . . . . . . . . . . . . . . . . . . . . . . . . . . . . . . . . . . . . . . . .Other services. . . . . . . . . . . . . . . . . . . . . . . . . . . . . . . . . . . . . . . . . . . . . . . . . . . . . . . . . . . . . . . . . . . . . .Government. . . . . . . . . . . . . . . . . . . . . . . . . . . . . . . . . . . . . . . . . . . . . . . . . . . . . . . . . . . . . . . . . . . . . . . . . . . . 315.144.04.80.67176811.66861.53177(3-month average change, in thousands)Total nonfarm. . . . . . . . . . . . . . . . . . . . . . . . . . . . . . . . . . . . . . . . . . . . . . . . . . . . . . . . . . . . . . . . . . . . . . . . . . . . . .Total private. . . . . . . . . . . . . . . . . . . . . . . . . . . . . . . . . . . . . . . . . . . . . . . . . . . . . . . . . . . . . . . . . . . . . . . . . . . . .588548349348402385378377CategoryWOMEN AND PRODUCTION AND NONSUPERVISORY EMPLOYEESAS A PERCENT OF ALL EMPLOYEES2Total nonfarm women employees. . . . . . . . . . . . . . . . . . . . . . . . . . . . . . . . . . . . . . . . . . . . . . . . . . . . . . . . . .Total private women employees. . . . . . . . . . . . . . . . . . . . . . . . . . . . . . . . . . . . . . . . . . . . . . . . . . . . . . . . .Total private production and nonsupervisory employees. . . . . . . . . . . . . . . . . . . . . . . . . . . . . . . . . . .HOURS AND EARNINGSALL EMPLOYEESTotal privateAverage weekly hours. . . . . . . . . . . . . . . . . . . . . . . . . . . . . . . . . . . . . . . . . . . . . . . . . . . . . . . . . . . . . . . . . . .Average hourly earnings. . . . . . . . . . . . . . . . . . . . . . . . . . . . . . . . . . . . . . . . . . . . . . . . . . . . . . . . . . . . . . . . .Average weekly earnings. . . . . . . . . . . . . . . . . . . . . . . . . . . . . . . . . . . . . . . . . . . . . . . . . . . . . . . . . . . . . . . .Index of aggregate weekly hours (2007 100)3. . . . . . . . . . . . . . . . . . . . . . . . . . . . . . . . . . . . . . . . . .Over-the-month percent change. . . . . . . . . . . . . . . . . . . . . . . . . . . . . . . . . . . . . . . . . . . . . . . . . . . . . . .Index of aggregate weekly payrolls (2007 100)4. . . . . . . . . . . . . . . . . . . . . . . . . . . . . . . . . . . . . . . .Over-the-month percent change. . . . . . . . . . . . . . . . . . . . . . . . . . . . . . . . . . . . . . . . . . . . . . . . . . . . . . .DIFFUSION INDEX(Over 1-month span)5Total private (256 industries). . . . . . . . . . . . . . . . . . . . . . . . . . . . . . . . . . . . . . . . . . . . . . . . . . . . . . . . . . . . . . .Manufacturing (74 industries). . . . . . . . . . . . . . . . . . . . . . . . . . . . . . . . . . . . . . . . . . . . . . . . . . . . . . . . . . . . . .149.848.481.534.7 30.76 1,067.37108.70.1159.90.467.655.449.848.481.534.5 32.11 1.534.6 32.26 1.534.5 32.36 1,116.42113.0-0.1174.90.362.157.4Includes other industries, not shown separately.Data relate to production employees in mining and logging and manufacturing, construction employees in construction, and nonsupervisory employees in theservice-providing industries.3The indexes of aggregate weekly hours are calculated by dividing the current month’s estimates of aggregate hours by the corresponding annual average aggregatehours.4The indexes of aggregate weekly payrolls are calculated by dividing the current month’s estimates of aggregate weekly payrolls by the corresponding annual averageaggregate weekly payrolls.5Figures are the percent of industries with employment increasing plus one-half of the industries with unchanged employment, where 50 percent indicates an equalbalance between industries with increasing and decreasing employment.p PreliminaryNOTE: Data have been revised to reflect March 2021 benchmark levels and updated seasonal adjustment factors.2
Frequently Asked Questions about Employment and Unemployment Estimates1. Why are there two monthly measures of employment?The household survey and establishment survey both produce sample-based estimates ofemployment, and both have strengths and limitations. The establishment survey employment serieshas a smaller margin of error on the measurement of month-to-month change than the householdsurvey because of its much larger sample size. An over-the-month employment change of about100,000 is statistically significant in the establishment survey, while the threshold for a statisticallysignificant change in the household survey is about 500,000. However, the household survey has amore expansive scope than the establishment survey because it includes self-employed workerswhose businesses are unincorporated, unpaid family workers, agricultural workers, and privatehousehold workers, who are excluded by the establishment survey. The household survey alsoprovides estimates of employment for demographic groups. For more information on the differencesbetween the two surveys, please visit www.bls.gov/web/empsit/ces cps trends.htm.2. Are undocumented immigrants counted in the surveys?It is likely that both surveys include at least some undocumented immigrants. However, neither theestablishment nor the household survey is designed to identify the legal status of workers. Therefore,it is not possible to determine how many are counted in either survey. The establishment survey doesnot collect data on the legal status of workers. The household survey does include questions whichidentify the foreign and native born, but it does not include questions about the legal status of theforeign born. Data on the foreign and native born are published each month in table A-7 of TheEmployment Situation news release.3. Why does the establishment survey have revisions?The establishment survey revises published estimates to improve its data series by incorporatingadditional information that was not available at the time of the initial publication of the estimates.The establishment survey revises its initial monthly estimates twice, in the immediately succeeding2 months, to incorporate additional sample receipts from respondents in the survey and recalculatedseasonal adjustment factors. For more information on the monthly revisions, please visitwww.bls.gov/web/empsit/cestn.htm#section7.On an annual basis, the establishment survey incorporates a benchmark revision that re-anchorsestimates to nearly complete employment counts available from unemployment insurance taxrecords. The benchmark helps to control for sampling and modeling errors in the estimates. For moreinformation on the annual benchmark revision, please visit www.bls.gov/web/empsit/cesbmart.htm.4. Does the establishment survey sample include small firms?Yes; about 40 percent of the establishment survey sample is comprised of business establishmentswith fewer than 20 employees. The establishment survey sample is designed to maximize thereliability of the statewide total nonfarm employment estimate; firms from all states, size classes, andindustries are appropriately sampled to achieve that goal.
5. Does the establishment survey account for employment from new businesses?Yes; monthly establishment survey estimates include an adjustment to account for the netemployment change generated by business births and deaths. The adjustment comes from aneconometric model that forecasts the monthly net jobs impact of business births and deaths basedon the actual past values of the net impact that can be observed with a lag from the Quarterly Censusof Employment and Wages. The establishment survey uses modeling rather than sampling for thispurpose because the survey is not immediately able to bring new businesses into the sample. Thereis an unavoidable lag between the birth of a new firm and its appearance on the sampling frame andavailability for selection. BLS adds new businesses to the survey twice a year.6. Is the count of unemployed persons limited to just those people receiving unemploymentinsurance benefits?No; the estimate of unemployment is based on a monthly sample survey of households. All personswho are without jobs and are actively seeking and available to work are included among theunemployed. (People on temporary layoff are included even if they do not actively seek work.) Thereis no requirement or question relating to unemployment insurance benefits in the monthly survey.7. Does the official unemployment rate exclude people who want a job but are not currentlylooking for work?Yes; however, there are separate estimates of persons outside the labor force who want a job,including those who are not currently looking because they believe no jobs are available (discouragedworkers). In addition, alternative measures of labor underutilization (some of which includediscouraged workers and other groups not officially counted as unemployed) are published eachmonth in table A-15 of The Employment Situation news release. For more information about thesealternative measures, please visit 8. How can unusually severe weather affect employment and hours estimates?In the establishment survey, the reference period is the pay period that includes the 12th of themonth. Unusually severe weather is more likely to have an impact on average weekly hours thanon employment. Average weekly hours are estimated for paid time during the pay period, includingpay for holidays, sick leave, or other time off. The impact of severe weather on hours estimatestypically, but not always, results in a reduction in average weekly hours. For example, someemployees may be off work for part of the pay period and not receive pay for the time missed,while some workers, such as those dealing with cleanup or repair, may work extra hours.Typically, it is not possible to precisely quantify the effect of extreme weather on payrollemployment estimates. In order for severe weather conditions to reduce employment estimates,employees have to be off work without pay for the entire pay period. Employeeswho receive pay for any part of the pay period, even 1 hour, are counted in the payrollemployment figures. For more information on how often employees are paid, please do-private-businesses-pay-workers.htm.In the household survey, the reference period is generall
The average workweek for all employees on private nonfarm payrolls decreased by 0.1 hour to 34.5 . hours in August. In manufacturing, the average workweek for all employees was little changed at 40.3 . . even 1 hour, are counted in the payroll employment figures. For more information on how often employees are paid, please visit