Transcription
One-handed Keystroke Biometric Identification CompetitionJohn V. Monaco1 , Gonzalo Perez1 , Charles C. Tappert1 , Patrick Bours2 , Soumik Mondal2 , SudalaiRajkumar3 , Aythami Morales4 , Julian Fierrez4 and Javier Ortega-Garcia41 PaceUniversity, Pleasantville, New York, USA, {jmonaco,gperez,ctappert}@pace.eduUniversity College, Gjøvik, Norway, {patrick.bours,soumik.mondal}@hig.no3 Tiger Analytics, Chennai, India, sudalai@tigeranalytics.com4 Universidad Autónoma de Madrid, Madrid, Spain, .es2 GjøvikAbstractThis work presents the results of the One-handedKeystroke Biometric Identification Competition (OhKBIC),an official competition of the 8th IAPR International Conference on Biometrics (ICB). A unique keystroke biometric dataset was collected that includes freely-typed longtext samples from 64 subjects. Samples were collected tosimulate normal typing behavior and the severe handicapof only being able to type with one hand. Competitionparticipants designed classification models trained on thenormally-typed samples in an attempt to classify an unlabeled dataset that consists of normally-typed and onehanded samples. Participants competed against each otherto obtain the highest classification accuracies and submitted classification results through an online system similarto Kaggle. The classification results and top performingstrategies are described.rolled with a normal both-hands typing sample. Such a scenario might be encountered in production or during a fieldexperiments that impose little or no condition on how thesystem should be used.There are many performance-degrading scenarios thatmay be encountered during deployment of a keystroke biometric system. Variations in typing behavior can occur as aresult of distractions, cognitive load, and sickness, to namea few. Consider the scenario in which a user has enrolledwith normal two-hand typing and later restricted to typingwith only one hand as a result of an injury or multitasking (e.g. using a desktop mouse with one hand while typingwith the other). A robust keystroke biometric system shouldbe able to handle this situation appropriately, although thecorrect response of such a system is not known at this point.Should the user be re-enrolled with a one-hand sample orcan the user still be identified under this constraint? Theresults of this competition can help answer these questions.2. Benchmark dataset1. IntroductionKeystroke biometric applications have been investigatedover the past several decades, attracting both academics andpractitioners. There are commercial products available thatanalyze a sequence of keystrokes for human identification,or provide additional security through password hardeningand continuous authentication. It is common to see errorrates below 10% for short text authentication [11], and below 1% in long text applications [12]. In terms of continuous authentication, an intruder can accurately be identified in less than 100 keystrokes [4]. While many performance evaluations are derived from normal typing behavior obtained in laboratory or natural settings, there has notbeen much research to determine how the performance ofa keystroke biometric system degrades as a result of a userimpairments, such as typing with one hand after having en-A unique keystroke biometric dataset was collectedfrom three online exams administered to undergraduate students in an introductory computer science course during asemester. Each exam contained five essay questions thatrequired typing a response directly into a web page. Students took the three exams through the Moodle learningplatform and their keystrokes were logged by a Javascriptevent-logging framework [1] and transmitted to a server.For the first exam students were instructed to type normallywith both hands, for the second exam with their left handonly, and for the third exam with their right hand only.The benchmark dataset consists of 64 students who provided at least 500 keystrokes on each exam. Approximately1/3 of all exam attempts occurred in an electronic classroomon standard desktop computers to ensure instructions werefollowed when typing with just one hand. The remaining
Typ. styleHaPHaP hybridTouchtypeTotalAmb.2103HandednessLeft Right172220233523. Submission evaluationTotal10252358Table 1: Subject population demographicsstudents completed the exams individually on their personalcomputers, which was a mix of desktop and laptop computers. It has been shown that combined laptop and desktopkeyboards has an effect on system performance [14]. Thisvariable alone makes the dataset less than ideal, as somestudents completed the three exams using different modelkeyboards.A subset of the data collected from the first exam withnormal both-hands typing was designated as a labeled training dataset. A classifier needs to be able to successfullyclassify unlabeled samples under each condition: normalboth-hands typing, left-hand typing, and right-hand typing. The labeled portion of the dataset consisted of 500keystroke normally-typed samples from 64 subjects. Students also completed a short survey for demographic information, including handedness and typing style. Studentsidentify themselves as ambidextrous, right, or left handed.They were also given a description of several typing stylesand instructed to choose the style that closely matched theirtyping behavior: touch typist (touchtype), hunt-and-peck(H&P), or hybrid of touchtype and hunt-and-peck (H&P hybrid). A summary of the demographic information is shownin Table 1, showing 58 of the 64 students as some did notcomplete the survey.The unlabeled dataset used for competition evaluationincluded typing samples from all three scenarios: 203 normal both-hands typing samples, 131 left-hand typing samples, and 137 right-hand typing samples, with 61 studentsfrom the training set appearing in the testing set. The number of samples per student in the testing set ranged from1 to 38. In the training dataset, the subject ID, handedness,typing style, and press and release event timestamps of eachkey were made available. Timestamps were in millisecondprecision and normalized to begin at 0 at the start of eachsample. In the testing dataset, key name, press and releaseevent timestamps, typing condition (both, left, right), and aunique sample ID were made available. Timestamps werenormalized in a similar way. In cases where a subject provided a large amount of data for one exam, several sampleswere created by taking 500-keystroke segments separatedby at least 50 keystrokes apart.Classification results were evaluated based on the proportion of correctly classified samples (recognition accuracy). A sample is correctly classified if the correct subjectidentity for that sample is given in a submission file. A competition website allowed participants to register, downloadthe training and testing datasets, make submissions, and discuss the competition in an open forum 1 . Submissions weremade through an automated system with the leaderboardand results publicly available. The submission format was aCSV file with the header: “sample, user” and rows for eachsample classification. The competition began September 1,2014, and ended October 31, 2014.Submissions were limited to one per day until the finalday of the competition. To avoid overfitting submissionswere evaluated on 50% of the unlabeled data until the endof the competition when the evaluation was based on 100%of the unlabeled data. The first place winner was awarded aFutronic FS88 fingerprint scanner.The leaderboard was calculated as follows. The rank ofeach competition participant is first determined separatelyfor each condition (both, left, and right hand keystroke input) in the unlabeled dataset using accuracy (ACC). Theleaderboard is then determined by taking the sum of thethree ranks from each condition. Thus, the best possiblescore is 3 (first place in each condition) and the worst is 3N(last place in each condition), where N is the number of participants in the competition. The leaderboard is designedto select a model that operates well under all three conditions. The highest ranking competition participant on theleaderboard was used to determine the winner, and the best(highest ranking) submission from each participant considered. A benchmark script was provided for participants toquickly parse the data and begin building a classificationsystem. This script used a kNN classifier with a naive set offeatures that obtained a classification accuracy of less than5% in each condition.The competition was designed to be challenging andunique in the area of keystroke biometrics. It representsa realistic scenario that may be encountered in a keystrokebiometric system, tackling a problem with no straightforward solution. Well known methods of keystroke biometricauthentication have shown considerable degradation due toenvironment variables. It may be possible to account forone-handed typed samples when only normally-typed samples are known.4. Competition resultsA total of nine participants registered for the competition, and three actively competed against each other for ition/view.php?id 7
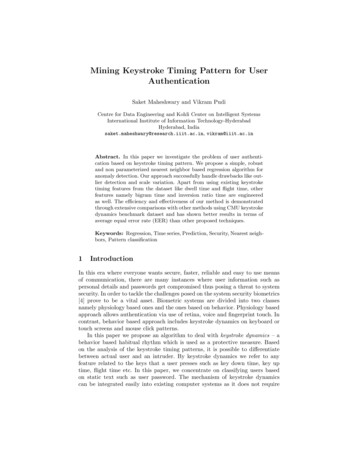
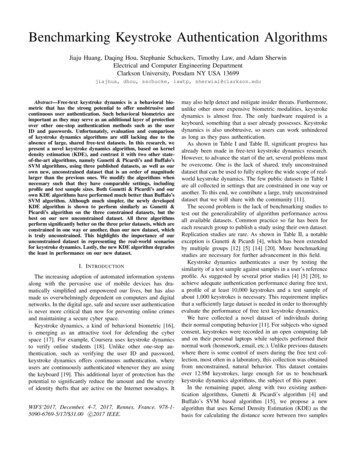
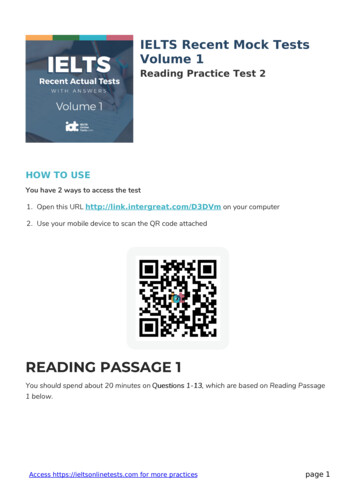
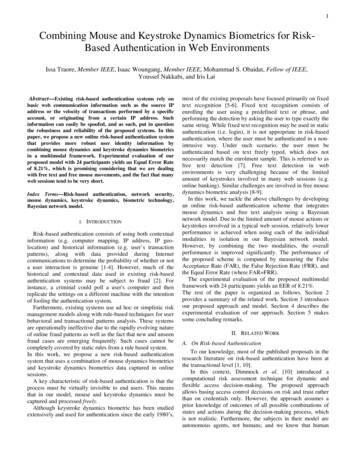
Rank123TeamGjøvikUniversityCollegeSudalaiRajkumar SUniversidadAutónomade Madrid[Baseline]BothLeftRight82.8 2.730.5 4.040.2 4.282.8 2.627.5 3.932.1 4.069.5 3.216.8 3.320.4 3.461.1 3.46.2 2.19.5 2.5Table 2: Final competition leaderboard - the top three teams4.1. Results analysisFirst, the classification accuracy for individual studentsand samples was examined. It is well known that biometric system accuracy depends heavily on the enrolled users[15, 7]. The distribution of classification accuracies for eachstudent is shown in Figure 1 and for each sample in Figure2. The classification accuracy of each student and each sample was calculated using all submissions from all the competition participants. The student and sample with the highest and lowest classification accuracies are labeled in thefigures. One student’s samples were never correctly classified by any of the 49 systems.The distribution of sample classification accuracies differs dramatically between one-handed and normally typedsamples. Overall, 91 samples were never correctly classified: 49 typed with the left hand, 32 with the right hand,and 10 with both hands. The sample accuracy (ACC) undereach typing condition is shown in Figure 2.The 49 submissions were further analyzed in order tobetter understand the effect of several user and environmentvariables in the identification task. The classification accuracy was broken down by the self-reported handedness andFigure 1: Accuracy distribution per student(a) Both(b) Left(c) RightFigure 2: Accuracy distribution per sampleHandednessplace. There were a total of 48 submissions from four participants. Including the benchmark results there were a totalof 49 submissions, so that any unlabeled sample could becorrectly classified at most 49 times.The final leaderboard of the competition is shown inTable 2. Baseline results were obtained with a 1-nearestneighbor classifier using scaled Manhattan distance [2] and218 commonly used keystroke features [12]. This baselineis different than the baseline obtained by the starter codeprovided to participants. To calculate the 95% confidenceintervals, a bootstrap method was used. The submissionsfrom each team and typing condition were resampled withreplacement 104 times. The team from Gjøvik UniversityCollege placed first, with the highest rank in each typingcondition and the highest overall classification accuracy.The classification strategies of the three teams are describedin Sections 5, 6, and ditionLeft Right14.31.514.6 10.617.8 24.418.3 23.7Avg.21.225.035.935.2Table 3: Handedness versus typing condition accuracytyping style, attributes not verified by an expert. Of the 64students, six did not provide handedness and typing styleinformation. Of the 58 students who did provide the information, 55 appeared in the unlabeled dataset which consisted of 397 samples: 18 from students identified as ambidextrous, 20 from left handers, and 359 from right handers. And of these 397 samples, 91 were typed with the lefthand, 144 with the right hand, and 162 with both hands.The accuracies for each handedness and condition areshown in Table 3, with the average row and columnweighted by the frequencies listed above. Left-handed andambidextrous students were more easily identified fromtheir left-hand samples, and right-handed students fromtheir right-hand samples. This is understandable since dominant hand samples are more likely to be produced in a consistent keystroke rhythm than non-dominant hand samples.The classification accuracy and sample frequency forsubjects who reported a typing style is shown in Table 4,
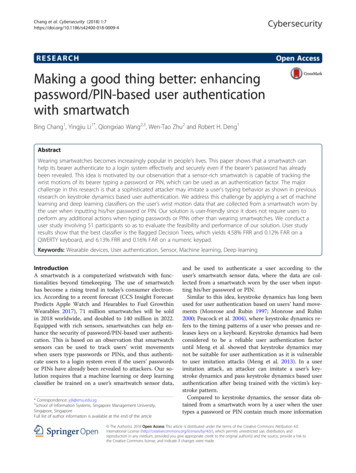
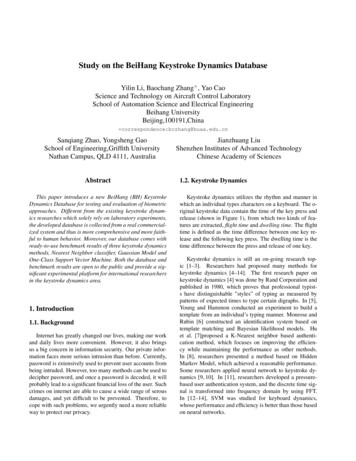
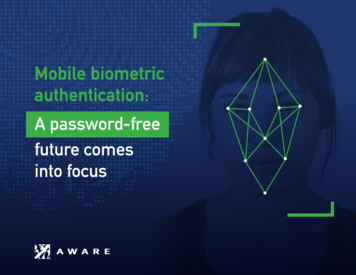
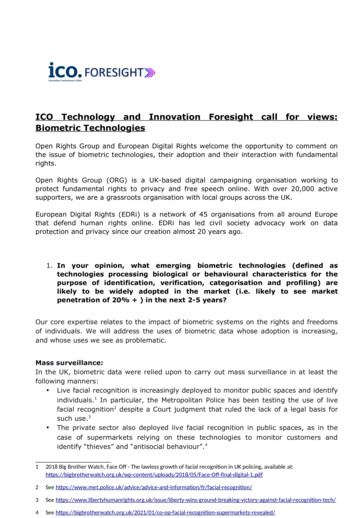
Typing styleHunt-and-peckHunt-and-peck hybridTouchtypeNo. Samples91144162Accuracy43.2 0.7433.5 0.5630.5 0.52Table 4: Accuracy versus typing style5. First place strategy5.1. Feature DefinitionFrom the available raw timing data, we extracted duration and latency information. Duration is defined as thetime elapsed between pressing down a key and releasingthat same key. Latency can be defined the time differencebetween releasing one key and pressing down the next one(RP latency) [2].5.2. ClassificationFigure 3: Accuracy versus median keypress latency showing the best-fit linear regression linewith 95% confidence intervals calculated be resampling thesubmissions for each typing style. The hunt-and-peck typists demonstrated higher performance than the hunt-andpeck hybrid and touch typists.The typing speed of a student may be indicative of classification accuracy. We hypothesized that faster typistsmay type more consistently and therefore be easier to classify as a result of fewer spurious key latencies and durations. Let the duration of a keystroke and latencies betweenkeystrokes be defined asDuration: di tri tpiRP-latency: liRP tpi 1 triPP-latency: liP P tpi 1 tpiRR-latency: liRR tri 1 triPR-latency: liP R tri 1 tpiAs an estimate of typing speed, we consider the median latency time between consecutive key presses, liP P . In Figure3, the mean accuracy of each sample is plotted against themedian key press latency. With a Pearson correlation coefficient of ρ 0.38, the typing speed of a subject mayonly be a weak indication of the difficulty in identifying thatsubject’s samples.In the following sections, we describe the classificationstategies taken by the top three competing teams.In our study, we have used pairwise coupling [9] byusing 2 regression model and one prediction model in amulti-classifier architecture [10]. For regression models,we have applied Artificial Neural Network (ANN) andCounter-Propagation Artificial Neural Network (CPANN),while a Support Vector Machine (SVM) is used for the prediction model. The score vector for each pair couplingis (f1 , f2 , f3 ) (Scoreann , Scoresvm , Scorecpann ). Initial analysis showed that training accuracy of the classifierswas reduced when combining latency and duration features,compared to only using duration features. Therefore, wedecided to use only duration features for our analysis.For pairwise coupling, we used a bottom up tree structure, as shown in Figure 4. In this particular example, thepairs are created in increasing order, but in the actual analysis we have selected these pairs randomly. For each coupling we have calculated the total classification score (Si )based on the weighted fusion of the individual classifierscore mentioned above:Si P33X1j 1wjwj fjj 1We selected the user from the pair which has the maximum value of Si for the next level of the tree. By usingdifferent weights we have obtained different results, as discussed in the following section.5.3. ResultsWe have tried different weights for the above fusion techniques and, for the “Both Hand” category the recognitionrate ranged from 58.1% to 74.4%. For the “Left Hand” category the recognition rate ranged from 16.8% to 26.7% andfor the “Right Hand” category the recognition rate rangedfrom 21.9% to 35.0%.Next, we tried only using two classifiers with different weights based on the training accuracy of a specificpair (i.e. removing the classifier with the least accuracy forthat specific pair). The results obtained from this analysis are slightly better. For the “Both Hand” category therecognition rate ranged from 55.7% to 82.8%, for the “LeftHand” category the recognition rate ranged from 19.9% to
ApproachAll key featuresLeft and right side featuresBoth82.882.8Left20.627.5Right27.032.1Table 5: Second place strategy classification accuracyFigure 4: Tree structure based pairwise coupling.30.5% and for the “Right Hand” category the recognitionrate ranged from 24.8% to 34.3%.When analyzing the test data of a user who is typing withonly one hand, we adjusted our analysis slightly. Assumethe test data is typed with the right hand; then typing keyson the right hand side of the keyboard will be typed in anormal manner, while keys on left hand side of the keyboard might be typed using only 1 finger of the right hand(most likely right index finger in this case). This means thattyping characteristics change for keys on the other side ofthe keyboard. Instead of considering all typed text in thetest data, we evaluated the performance based only on thekeys in the test data that are on the right hand side of thekeyboard. This strategy worked only for “Right Hand” category, where the recognition rate improved from 34.3% to40.2% for a particular fusion weight. But, on the other hand,the recognition rate for “Left Hand” category reduced from29.0% to 22.1%.6. Second place strategy6.1. Feature definitionThe features we extracted from the raw data include durations and key press latencies for each individual key. Latency features include press to press (PP) and release topress (RP) latencies [3]. These features are extracted directly from the given raw data. Keys were also grouped together based on their position on the keyboard such as left,right, top, middle and bottom. The groups are made suchthat left key group consists of those keys which are presenton the left side of the keyboard and so on. Key press duration and latency features are also extracted for each of thesegroups.opment and validation sample to test the accuracy of themodel being built. Models are built on the training sample and validated on the validation sample to get the bestparameters for the model.We have used Random Forests [5] for our classification.Best parameters for the model are obtained through minimizing the classification error on the validation sample. Wehave also tried using other classification techniques like logistic regression and SVM, but Random Forests gave bettertraining accuracy when compared to others.6.3. ResultsThe results suggest that instead of using the features ofall the keys, using only those features related to keys presenton the left side of the key board yielded better results for“Left-Hand” category. Same is the case for “Right-hand”category as well. So we have used only those features for“Left-hand” and “Right-hand” classification.7. Third place stategy7.1. Feature definitionOur strategy is focused on matching features related withsmall strings of two and three keys (also called digraphs andtrigraphs respectively [8]) in a similar way as fixed passwords. For each of the digraphs we create a feature vectorcomposed of: duration (time interval between press and release of the same key, also known as dwell or hold time) andRP latency. In case of the trigraphs, we add the time intervalbetween the press and release of alternate keystrokes.7.2. ClassificationFor the matching of the feature vectors we proposed amulti-algorithm approach based on two algorithms [13]:Algorithm A - Normalized Distance: This algorithmcomputes the distance between the feature vectors in theunlabeled and training datasets. The distance between a feature vector v [v1 , v2 , . . . , vN ] from the unlabeled datasetand his training samples is measured as:di N1 X 1( vk µk )Nσk i 1, . . . , Mk 16.2. ClassificationEach individual user had 500 keystrokes in the trainingdataset. We have sampled those 500 keystrokes into devel-where σ [σ1 , σ2 , . . . , σN ] and µ [µ1 , µ2 , . . . , µN ] arethe standard deviation and mean of the training samples, Nis the number of features (3 for digraphs and 6 for trigraphs)
ApproachAlgorithm AAlgorithm 6.720.4Table 6: Third place strategy classification accuracyand M is the number of digraphs and trigraphs shared by theunlabeled and training datasets. The 80 lowest values of d(40 digraphs and 40 trigraphs) obtained for each user arecombined by the mean rule (applying a correction factor of1.5 to the digraphs) to obtain a final score SA for each user.Algorithm B SVM Classifier: The keystroke model ofAlgorithm B has been built using a Least Squares SupportVector Machine (LS-SVM). Least Squares Support VectorMachines are reformulations to standard SVMs, which leadto solutions of the indefinite linear systems generated withinthem. The meta-parameters of the LS-SVM models are optimized using the keystroke dataset included in the BiosecurID multimodal database [6]. This training procedure isused to generate a LS-SVM model per user, using their owntraining samples as positive vectors and training samples ofthe other 63 users as negative vectors. To identify an unlabeled sample, the LS-SVMs of all the users generate a scorefor each trigraph shared between the unlabeled and trainingdatasets. The 40 highest scores of each user are combinedby the mean rule to obtain a final score SB for each user.Combined Approach: the scores are normalized by themin/max technique, which transforms the range of the classification scores to [0-1]. The combination of the scores isbased on a weighted sum given by:Sf usion w (1 SA ) (1 w) SBwhere {SA , SB } are the normalized scores (note that SAand SB are dissimilarity and similarity scores respectively)and w the weighting factor obtained through the performances achieved with the training dataset as w 1 EERA / (EERA EERB )7.3. ResultsTable 6 shows the performances achieved for all threescenarios and the three different proposed approaches:The results suggest the complementarity of both algorithms when they are combined at score level. However,the improvement is clearer for the “Both Hand” categoryin which the accuracy ranged from 50.7% to 69.4%. Forthe “Left Hand” and “Right Hand” categories the improvements are moderate and range from 12% to 16% and from16% to 20% respectively.8. SummaryAs expected, classification accuracy degrades considerably for keystroke samples that are typed with only onehand after having trained a model on both hands. A common theme among the competition participants to deal withone-handed samples was to divide the keyboard into left andright components, placing more weight on the side corresponding to the non-obstructed hand. Motivation for thisapproach is the assumption that typing behavior of the nonobstructed hand will be more natural on the correspondingside of the keyboard. This approach seemed to work well,as seen by the strategy of the first and second place teams.The one-handed typed samples also seem to be generallyeasier to classify when the obstructed hand is non-dominantfor right-handed subjects (i.e. right-handed subjects typingwith only their right hand). It seems as though this maybe true in general, as classification accuracy for left-handedsubjects was higher when typing left-handed samples, although the small number of left-handed subjects calls for future work to validate this finding with greater significance.Besides handedness, typing speed is also weak predictorof keystroke biometric system performance. The correlation between median PP latency and classification accuracyis too weak to be useful. Perhaps there are other behavioral characteristics that indicate system performance. Thisis also an area of keystroke dynamics that warrants moreresearch.AcknowledgmentsThe authors would like to acknowledge the support fromthe National Science Foundation under Grant No. 1241585.Any opinions, findings, and conclusions or recommendations expressed in this material are those of the authors anddo not necessarily reflect the views of the National ScienceFoundation or the US government.References[1] Moodle bioauth plugin. (Accessed August 2014).[2] L. C. Araujo, L. H. Sucupira Jr, M. G. Lizarraga, L. L. Ling,and J. B. T. Yabu-Uti. User authentication through typingbiometrics features. IEEE Transactions on Signal Processing, 53(2):851–855, 2005.[3] S. P. Banerjee and D. L. Woodard. Biometric authentication and identification using keystroke dynamics: A survey.Journal of Pattern Recognition Research, 7:116–139, 2012.[4] P. Bours. Continuous keystroke dynamics: A different perspective towards biometric evaluation. Information SecurityTechnical Report, 17(1):36–43, 2012.[5] L. Breiman. Random forests. Machine learning, 45(1):5–32,2001.[6] J. Fierrez, J. Galbally, J. Ortega-Garcia, et al. Biosecurid: amultimodal biometric database. Pattern Analysis and Applications, 13(2):235–246, 2010.
[7] J. Fierrez-Aguilar, J. Ortega-Garcia, and J. GonzalezRodriguez. Target dependent score normalization techniquesand their application to signature verification. Systems, Man,and Cybernetics, Part C: Applications and Reviews, IEEETransactions on, 35(3):418–425, 2005.[8] D. Gunetti and C. Picardi. Keystroke analysis of free text.ACM Transactions on Information and System Security (TISSEC), 8(3):312–347, 2005.[9] T. Hastie and R. Tibshirani. Classification by pairwise coupling. The Annals of Statistics, 26(2):451–471, 04 1998.[10] T. K. Ho, J. Hull, and S. Srihari. Decision combination inmultiple classifier systems. IEEE Trans. on Pattern Analysisand Machine Intelligence, 16(1):66–75, 1994.[11] K. S. Killourhy and R. A. Maxion. Comparing anomalydetection algorithms for keystroke dynamics. In Dependable Systems & Networks, 2009. DSN’09. IEEE/IFIP International Conference on, pages 125–134. IEEE, 2009.[12] J. V. Monaco, N. Bakelman, S.-H. Cha, and C. C. Tappert.Recent advances in the development of a long-text-inputkeystroke biometric authentication system for arbitrary textinput. In Intelligence and Security Informatics Conference(EISIC), 2013 European, pages 60–66. IEEE, 2013.[13] A. Morales, J. Fierrez, and J. Ortega-Garcia. Towardspredicting good users for biometric recognition based onkeystroke dynamics. In International Workshop on Soft Biometrics, pages 1–14, 2014.[14] M. Villani, C. Tappert, G. Ngo, J. Simone, H. S. Fort, andS.-H. Cha. Keystroke biometric recognition studies on longtext input under ideal and application-oriented conditions. InComputer Vision and Pattern Recognition Workshop, 2006.CVPRW’06. Conference on, pages 39–39. IEEE, 2006.[15] N. Yager and T. Dunstone. The biometric menagerie. IEEETransactions on Pattern Analysis and Machine Intelligence,32(2):220–230, 2010.
Keystroke Biometric Identification Competition (OhKBIC), an official competition of the 8th IAPR International Con-ference on Biometrics (ICB). A unique keystroke biomet-ric dataset was collected that includes freely-typed long-text samples from 64 subjects. Samples were collected to simulate normal typing behavior and the severe handicap