Transcription
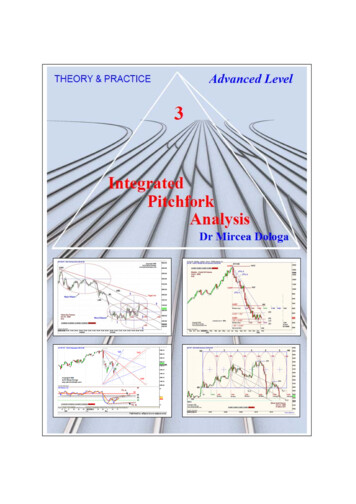
FIBONACCI TRADING ANDBOLLINGER BANDS
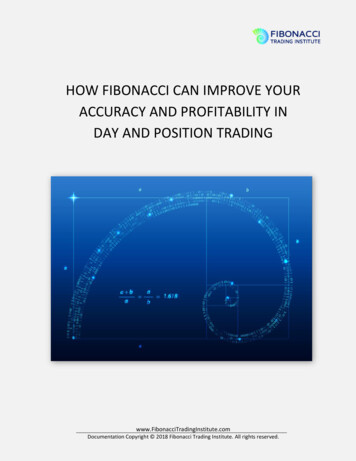
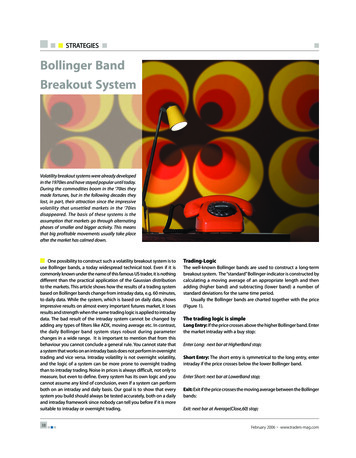
www.sohomarkets.euFibonacci TradingLeonardo Fibonacci was a famous Italian mathematician that discovered a simple series ofnumbers that created ratios describing the natural proportions of things in the universe.The ratios arise from the following number series: 0, 1, 1, 2, 3, 5, 8, 13, 21, 34, 55, 89, 144 This series of numbers is derived by starting with 0 followed by 1 and then adding 0 1 to get 1,the third number. Then, adding the second and third number (1 1) to get 2, the fourth number,and so on. After the first few numbers in the sequence, if you measure the ratio of any numberto the succeeding higher number, you get .618. For example, 34 divided by 55 equals .618. If youmeasure the ratio between alternate numbers you get .382. For example, 34 divided by 89 0.382.Fibonacci Retracement LevelsA Fibonacci retracement is a term used in technical analysis that refers to areasof support or resistance. Fibonacci retracement levels use horizontal lines to indicatewhere possible support and resistance levels are. Each level is associated with a percentage. Thepercentage is how much of a prior move the price has retraced. The Fibonacci retracement levelsare 23.6%, 38.2%, 61.8% and 78.6%. While not officially a Fibonacci ratio, 50% is also used. Theindicator is useful because it can be drawn between any two significant price points, such as ahigh and a low, and then the indicator will create the levels between those two points.Fibonacci Extension LevelsFibonacci extensions are a tool that traders can use to establish profit targets or estimate howfar a price may travel after a retracement/pullback is finished. Extension levels are also possibleareas where the price may reverse. Extensions are drawn on a chart, marking price levels ofpossible importance. These levels are based on Fibonacci ratios (as percentages) and the size ofthe price move the indicator is being applied to. Common Fibonacci extension levels are 61.8%,100%, 161.8%, 200%, and 261.8%.This is a daily chart of AUD/USD showing an uptrendPage 2 35725323120 357 25323112info@sohomarkets.eu
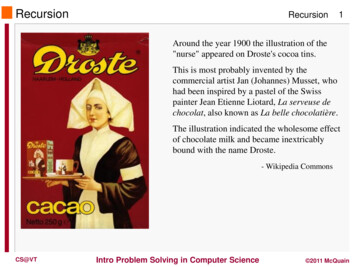
www.sohomarkets.euHere we plotted the Fibonacci retracement levels by clicking on the Swing Low at .6955 on April20 and dragging the cursor to the Swing High at .8264 on June 3. As you can see from the chart,the Fibonacci retracement levels were .7955 (23.6%), .7764 (38.2%), .7609 (50.0%), .7454(61.8%), and .7263 (76.4%). Now, the expectation is that if AUD/USD retraces from the recenthigh, it will find support at one of those Fibonacci retracement levels because traders will beplacing buy orders at these levels as price pulls back.Now, let’s look at what happened after the Swing High occurred.Page 3 35725323120 357 25323112info@sohomarkets.eu
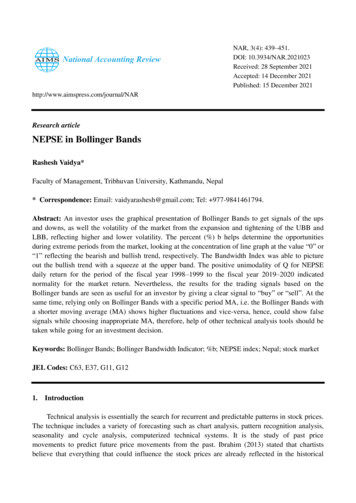
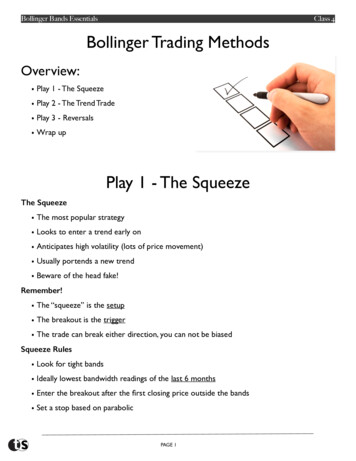
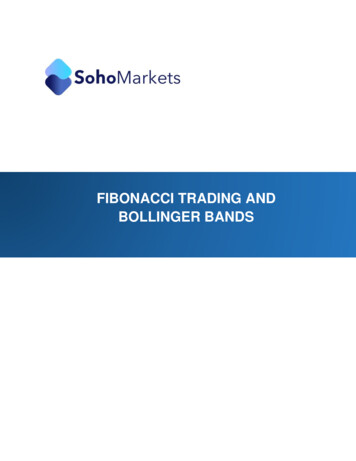
www.sohomarkets.euPrice pulled back right through the 23.6% level and continued to shoot down over the next coupleof weeks. It even tested the 38.2% level but was unable to close below it. Later on, around July14, the market resumed its upward move and eventually broke through the swing high. Clearly,buying at the 38.2% Fibonacci level would have been a profitable long-term trade!Now, let’s see how we would use the Fibonacci retracement tool during a downtrend. Below is achart of EUR/USD.As you can see, we found our Swing High at 1.4195 on January 25 and our Swing Low at 1.3854 afew days later on February 1.The retracement levels are 1.3933 (23.6%), 1.3983 (38.2%), 1.4023 (50.0%), 1.4064 (61.8%) and1.4114 (76.4%). The expectation for a downtrend is that if price retraces from this low, it couldpossibly encounter resistance at one of the Fibonacci levels because traders who want to playthe downtrend at better prices may be ready with sell orders there.Let’s take a look at what happened next.Page 4 35725323120 357 25323112info@sohomarkets.eu
www.sohomarkets.euThe market did try to rally, stalled below the 38.2% level for a bit before testing the 50.0% level.If you had some orders either at the 38.2% or 50.0% levels, you would’ve made some mad pipson that trade. In these two examples, we see that price found some temporary forex support orresistance at Fibonacci retracement levels.Bollinger Bands A Bollinger Band is a technical analysis tool defined by a set of lines plotted two standarddeviations (positively and negatively) away from a simple moving average (SMA) of the security'sprice but can be adjusted to user preferences. Bollinger Bands were developed and copyrightedby famous technical trader John Bollinger. A Bollinger Band technical indicator has bandsgenerally placed two standard deviations away from a simple moving average. In general, a movetoward the upper band suggests the asset is becoming overbought, while a move close to thelower band suggests the asset is becoming oversold. Since standard deviation is used as astatistical measure of volatility, this indicator adjusts itself to market conditions.Bollinger bands are excellent tools for measuring volatility because that is exactly what it wasdesigned to do. Bollinger bands are basically 2 lines that are plotted 2 standard deviations aboveand below a moving average for an X amount of time, where X is whatever you want it to be.Page 5 35725323120 357 25323112info@sohomarkets.eu
www.sohomarkets.euSo if we set it at 20, we would have a 20 SMA and two other lines. One line would be plotted 2standard deviations above it and the other line would be plotted -2 standard deviations below.When the bands contract, it tells us that volatility is LOW.When the bands widen, it tells us that volatility is HIGH.In the chart depicted below, Bollinger Bands bracket the 20-day SMA of the stock with an upperand lower band along with the daily movements of the stock's price. Because standard deviationis a measure of volatility, when the markets become more volatile the bands widen; during lessvolatile periods, the bands contract.Page 6 35725323120 357 25323112info@sohomarkets.eu
www.sohomarkets.euThe Bollinger BounceOne thing you should know about Bollinger Bands is that price tends to return to the middle ofthe bands. That is the whole idea behind the “Bollinger Bounce.”As you can see, the price settled back down towards the middle area of the bands.Page 7 35725323120 357 25323112info@sohomarkets.eu
www.sohomarkets.euWhat you just saw was a classic Bollinger Bounce. The reason these bounces occur isbecause Bollinger bands act like dynamic support and resistance levels. The longer the timeframe you are in, the stronger these bands tend to be. Many traders have developed systemsthat thrive on these bounces and this strategy is best used when the market is ranging and thereis no clear trend.Bollinger SqueezeThe “Bollinger Squeeze” is pretty self-explanatory. When the bands squeeze together, it usuallymeans that a breakout is getting ready to happen. Bollinger Bands Squeeze is a great chartpattern that enables you to locate strong and profitable trade setups. When the market becomestoo slow and there is a low volatility, the price moves sideways and the Bollinger upper and lowerbands become so close to each otherIf the candles start to break out above the TOP band, then the move will usually continue to goUP. If the candles start to break out below the BOTTOM band, then price will usually continue togo DOWN.Page 8 35725323120 357 25323112info@sohomarkets.eu
www.sohomarkets.euPage 9 35725323120 357 25323112info@sohomarkets.eu
Fibonacci retracement levels use horizontal lines to indicate where possible support and resistance levels are. Each level is associated with a percentage. The percentage is how much of a prior move the price has retraced. The Fibonacci retracement levels are 23.6%, 38.2%, 61.8% and 78.6%. While not officially a Fibonacci ratio, 50% is also used.