Transcription
STRATEGIESBollinger BandBreakout SystemVolatility breakout systems were already developedin the 1970ies and have stayed popular until today.During the commodities boom in the ‘70ies theymade fortunes, but in the following decades theylost, in part, their attraction since the impressivevolatility that unsettled markets in the ‘70iesdisappeared. The basis of these systems is theassumption that markets go through alternatingphases of smaller and bigger activity. This meansthat big profitable movements usually take placeafter the market has calmed down.One possibility to construct such a volatility breakout system is touse Bollinger bands, a today widespread technical tool. Even if it iscommonly known under the name of this famous US trader, it is nothingdifferent than the practical application of the Gaussian distributionto the markets. This article shows how the results of a trading systembased on Bollinger bands change from intraday data, e.g. 60 minutes,to daily data. While the system, which is based on daily data, showsimpressive results on almost every important futures market, it losesresults and strength when the same trading logic is applied to intradaydata. The bad result of the intraday system cannot be changed byadding any types of filters like ADX, moving average etc. In contrast,the daily Bollinger band system stays robust during parameterchanges in a wide range. It is important to mention that from thisbehaviour you cannot conclude a general rule. You cannot state thata system that works on an intraday basis does not perform in overnighttrading and vice versa. Intraday volatility is not overnight volatility,and the logic of a system can be more prone to overnight tradingthan to intraday trading. Noise in prices is always difficult, not only tomeasure, but even to define. Every system has its own logic and youcannot assume any kind of conclusion, even if a system can performboth on an intraday and daily basis. Our goal is to show that everysystem you build should always be tested accurately, both on a dailyand intraday framework since nobody can tell you before if it is moresuitable to intraday or overnight trading.38Trading-LogicThe well-known Bollinger bands are used to construct a long-termbreakout system. The “standard” Bollinger-indicator is constructed bycalculating a moving average of an appropriate length and thenadding (higher band) and subtracting (lower band) a number ofstandard deviations for the same time period.Usually the Bollinger bands are charted together with the price(Figure 1).The trading logic is simpleLong Entry: If the price crosses above the higher Bollinger band. Enterthe market intraday with a buy stop:Enter Long: next bar at HigherBand stop;Short Entry: The short entry is symmetrical to the long entry, enterintraday if the price crosses below the lower Bollinger band.Enter Short: next bar at LowerBand stop;Exit: Exit if the price crosses the moving average between the Bollingerbands:Exit: next bar at Average(Close,60) stop;February 2006www.traders-mag.com
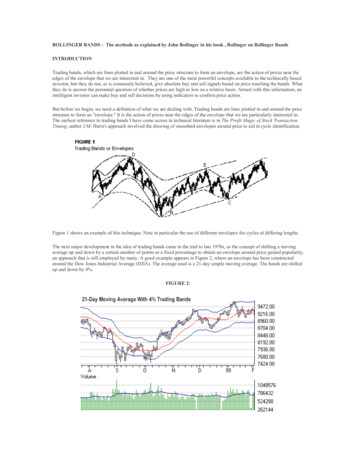
The exact position of the higher and the lower Bollinger band isdetermined by taking the simple moving average and adding (higherband) or subtracting (lower band) the following, volatility dependantamount: Distance * Standard-Deviation. The volatility dependantcomponents is located within the standard deviation, whereas thedistance is a fixed parameter which can be varied. We chose it as oneof the two input parameters of the system code. Let us have a look atthe complete Easy Language code for the Bollinger band system:Inputs: Length(60), Distance(2);Bars: HigherBand(0),LowerBand(0);HigherBand Average(Close, Length) Distance * StdDev(Close,Length);LowerBand Average(Close, Length) - Distance * StdDev(Close,Length);Buy next bar at HigherBand stop;Sell next bar at LowerBand stop;ExitLong next bar at Average(Close, Length) stop;ExitShort next bar at Average(Close, Length) stop;As you can see from the Easy language code the system has twoinput parameters, which are bold typed. One represents the length ofthe moving average, the other determines the distance (or width) ofhow far away from this moving average the Bollinger Bands are placed.Their default values are set to a length of 60 and distance of 2. Bychanging these parameters you can adjust the trade frequency. Thesmaller you set the length for the moving average and the smalleryou choose the distance of the Bollinger Bands the faster the systemwill react to market changes and the more signals you will get. Despitethe possibility to adjust the system code to your personal needs,F1) Backadjusted Future Contract1400013800Exit1320013000Exit12800Short Entry12600Distance12400Long Entry12200LowerBollinger BandAS12000OND05Application of the StrategyNow that we have built and understood the system’s logic we can testit under different market conditions. The strategy will be applied tointraday 60-min and daily data of the same following seven marketsfrom three different market groups: 3 Stock-Index-Futures: Nasdaq-Mini, EuroStoxx50 and SwissMarket Index 2 Bond-Index-Futures: Bund, US-T-Note (10 year) 2 Currency-Futures: Euro and Swiss-Franc1360013400HigherBollinger BandBollinger band have further advantages for building mechanicaltrading systems. Due to their volatility based component they caneasily adapt to different market conditions. Additionally they providea natural exit point by using the moving average between theBollinger bands.Let us analyse the behaviour of the Bollinger bands with the helpof the examples shown in Figure 1. The first third of the graph (AugustOctober 2004) shows a phase of lower market activity. The volatilitydrops and the Bollinger bands become narrower. During this periodof lower volatility the market often trends sideways without anydirection. Many market participants are unsure about the furtherdevelopment and stay on the sidelines.Such phases of decreasing interest of market participants formthe base of succeeding considerable movements. The longer theindecisive phase is, the stronger the subsequent breakout (see Figure1,mid October till December 2004). After the breakout the Bollingerbands widen and follow the trending price very quickly. From Figure1 you can calculate the profit of the trade which uses this impulsivelong breakout. It brings 6 cents ( 7,500 US-Dollar in the Euro-future)although some of the gains have been given away. Shortly after thelong exit a short signal was triggered (February 2005), which turnedout to be a false breakout and was soon exited by the moving averagestop.In the next section the strategy will be applied to a portfolio of sevendifferent markets with the default values (length 60, distance 2). Wewill test our trading logic with the same parameters, without anyoptimisation, on 60 minutes intraday data and on daily market data onthe same seven markets. It will be interesting to see how the resultschange between the two different time scales.FEuro, daily, backadjusted future contract, with Bollinger bands and 60day moving average of closing prices. The entry and exit points are markedwith circles: The crossing of the price and the Bollinger bands generatethe long and short entries. The crossing of the price and the movingaverage triggers the exits.All futures data are point-based back adjusted. This standard methodof data adjustment insures a continuous data series without anyartificial gaps, which usually occur at the roll to a new contract month.Daily data was taken from mid 1994 until mid 2005. The data for theintraday tests covered the period from January 1997 until August 2004.Data source for the intraday data was TICK DATAâ (tickdata.com)andfor the of end-of-day data CSIâ (csidata.com).For all the performed tests exactly the same parameters (default)were taken in order to avoid the effect of curve fitting. All results arebased on a one contract per market basis. Any considerations in termsof money and risk management are beyond the scope of this article.Furthermore it is important to mention that all results in the figuresand tables are presented without subtraction of slippage andcommissions. This simplifies the back-testing procedure and thevisualisation of results. However, in the analysis of the system’s statistics39
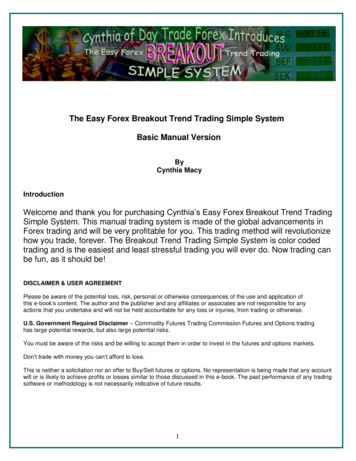
STRATEGIESwe take the slippage and commissions into accountin order to compare results at conditions as close tothe real market as possible.Results, Based on 60-min Intraday DataT1) 60 Minute Intraday DataSystem AnalysisNet ProfitGross ProfitGross Loss 45,726.77 547,597.27( 501,870.50)Time Analysis (Days)Percent in the marketLongest flat period79.31%11.67Equity ( )Let’s start with the application of the strategy toAvg. time in trades6.06Percent profitable35.08%Avg. time between trades0.40intraday data. We will apply the Bollinger bandRatio avg. win/avg. loss2.02strategy to the seven markets with exactly the sameAvg. time in winning trades11.28parameters (default)in order to minimise curveProfit factor1.09Avg. time between winning trades1.42fitting. The equity lines of the seven markets wereMaximum Drawdown( 8,758.00)Avg. time in losing trades3.24added to a portfolio, which results in a combinedAverage Drawdown( 517.08)Avg. time between losing trades1.46Number of total trades1,414equity line (Figure 2).Average trade 32.34Avg. time between peaks (days)57.06Although you have an overall positive return theequity line looks untradable. There is a big equityThe table shows the main figures of the Bollinger Band-System for the portfolio of 7 Markets,01/1997-08/2004, applied to 60-min intraday data. The table shows the added results of all tradespeak at the end of the year 1999, which is followedon these markets without slippage and commissions.by a sharp drawdown in which nearly all profits weregiven away. If you then have a closer look at thesystem figures and ratios (table 1) you will get the confirmation thatHow to Improve Intraday Resultsthe result is not sufficient for trading. The profit factor of 1.09 is onlyOne reason for the failure on intraday data is the fact that Bollingerslightly positive. Although there is a high ratio of average winning/bands are derived from a moving average. It is well known that movingaverage losing trade, you can only reach an average profit per tradeaverages cannot react fast enough to some special market situations,of 32 . If you subtract now slippage and commissions (typically aboute.g. to gaps, which occur especially overnight. One possibility to50-150 , depending on the market) this result becomes negative.overcome this problem would be to introduce adaptive movingIn addition to the insufficient performance of the base systemaverages for shorter term systems e.g. Perry Kaufmans adaptivethere are further negative facts: If you try to add indicator-based filters,moving average. Another possible solution to overcome the probleme.g. a trend or volatility filter, or put in additional stops, this does notof the overnight gaps could be the usage of a “time filter”. If you restrictimprove the overall performance significantly. For example, if youthe allowed entry times to certain time spans in which you trade onallow long signals only if the current close is above its 200-day movingan intraday basis, Bollinger band results could be improved. Theaverage (analogue for the short side: restrict short signals to situationsallowed trading time would have to be chosen individually for eachwhen the current close is below its 200-day moving average) you canmarket, e.g. for the EUREX Bund futures something like from 9:00 a.m.only improve the average trade to about 80 per trade without slippageup to 12:00 a.m. and from 2:00 p.m. up to 6:00 p.m.and commissions, which is still useless in practical trading. The systemA second reason for the changing performance of our breakoutwas further tested on 5-minutes and 15-minutes data. The results onsystem on intraday data is the market volatility. If you look on thethis data showed a higher trade frequency with an even smaller averagedetailed equity curve (Figure 2) you can see that the system had it’sprofit per trade.best performance in the years 1998 and 1999. This was the time ofthe stock market bubble with the highest volatility in most financialmarkets. In an environment of higher volatility intraday systems performF2) 60 minute intraday databetter. That is why the currencies, which had a higher volatility, kept amuch better performance in the last years for short term trading770000systems. The vanishing volatility in the major stock and bond indices760000over the last years provided a more difficult environment for short750000740000term strategies.730000Results, Based on Daily /03Time (bars)The figure shows the combined equity curve of the Bollinger Band-Systemfor the portfolio of 7 Markets, 01/1997-08/2004, applied to 60-min intradaydata. The figure shows the added results of all trades on these marketswithout slippage and commissions. The detailed equity line offers greaterinsight into trading performance than a general equity curve graph. Itdisplays net profit on a bar-by-bar basis revealing equity run-ups anddraw-downs.40The Bollinger band strategy will now be applied to exactly the same 7markets with exactly the same parameters (default), but to data of adifferent time scale. Instead of 60-minute intraday data we’ll now useend-of-day daily futures data for our tests.The equity line (Figure 3) looks like a good starting point for aviable trading system. Even within the detailed equity curve, whichshows net profit on a bar-by-bar basis, the equity line is quite smoothand steady. Every minor drawdown is soon recovered. The equity curvealso rises within the last three years, which have been generally difficultfor trend-following strategies. It’s important to mention here that thesame parameters for all markets have been taken. No optimisation orFebruary 2006www.traders-mag.com
F3)
use Bollinger bands, a today widespread technical tool. Even if it is commonly known under the name of this famous US trader, it is nothing different than the practical application of the Gaussian distribution to the markets. This article shows how the results of a trading system based on Bollinger bands change from intraday data, e.g. 60 minutes, to daily data. While the system, which is .