Transcription
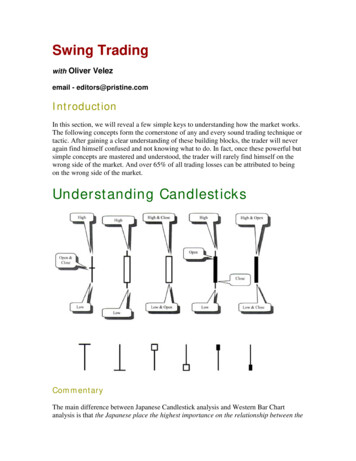
Trading withBollinger BandswithToni Turnerwww.toniturner.com
A Brief Introduction . . .Toni TurnerPresidentTrendStar Trading Group, Inc.A Beginner’s Guide to Day Trading OnlineA Beginner’s Guide to Short Selling (video)A Beginner’s Guide to Short-Term TradingWebsite: www.toniturner.com
How About You?Where are you in your trading career?What time frames do you trade?Do you use fundamental analysis as adecision support tool?Do you use technical analysis as aprimary decision support tool?Do you currently use Bollinger Bands?What additional indicators do you use?
Today’s Topic Bollinger BandsWhere they are usedTime framesBasic Concepts how they workCombining them with other indicatorsWhat they are– Identify price patterns– Confirm trends– Locate high-probability setups, entries andexits
Bollinger BandsWhat they are . . .Created by John Bollinger in early 1980’sConsist of upper and lower envelopes, orbands, plotted in and around the pricepattern of a stock or indexExpand and contract according to volatility
Bollinger Bands Ask Question: On a relative basis, areprices high, or low?Answer:– Prices are high at upper band– Prices are low at lower band
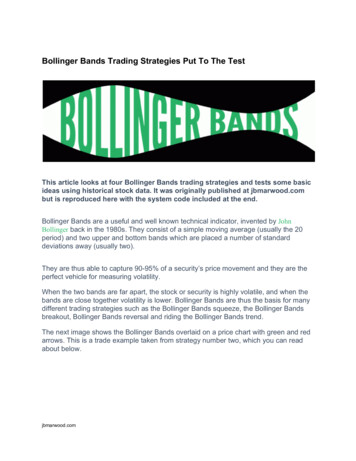
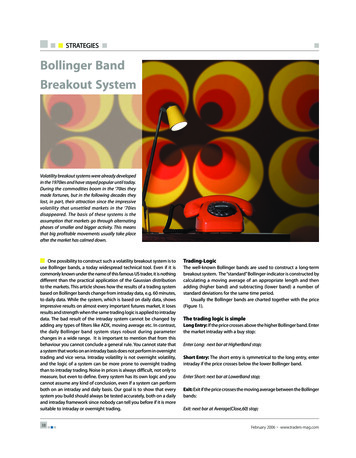
Bollinger BandsUpper bandLower band20 MAOBVRealTick graphics used with permission of Townsend Analytics, Ltd. 1986-2002. All rights reserved.
Bollinger Bands . . .Base: middle band is usually 20-period movingaverage.Upper band: spread above that MA by volatilitymeasure known as “standard deviation.” Defaultset at 2 standard deviations.Lower band: middle band less same volatilymeasure.
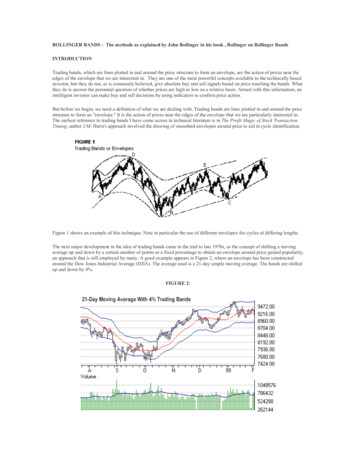
Bollinger Bands the formula
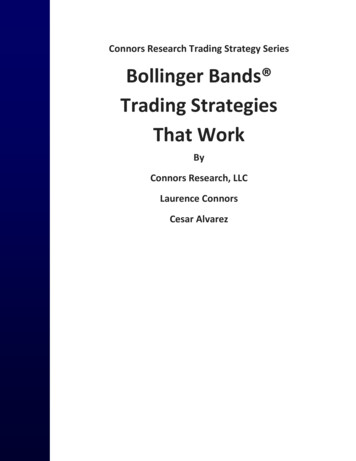
Let’s Translate That!Upper bandDefaults: 20-period MA Bandwidth 2 standard deviationsRSIOBVRealTick graphics used with permission of Townsend Analytics, Ltd. 1986-2002. All rights reserved.Lower band
Bollinger Band Applications . . .Decision Support Tool for: stocks,indices, options, commodities, financialfutures, currencies, and mutual fundsEffective Time Frames: years, quarters,months, weeks, days, hours, minutes,ticks!
Three Primary UsesPattern recognition– Recognize double tops, head-and-shoulders,double bottomsReversal signals– Identify early warning signs of reversalsTrend analysis– Detect trend continuation and conclusion
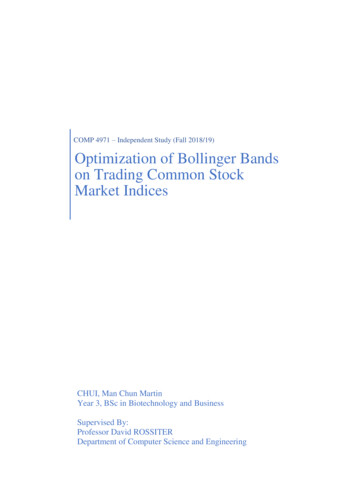
Bollinger Bands (BB)Basic Concepts . . .Used to compare price and indicatoraction to arrive at buy and sell decisionsConfirming indicators should not bedirectly related to each otherPrice can, and does, walk up the upper BBand down the lower BB
Basic ConceptsRSIOBVRealTick graphics used with permission of Townsend Analytics, Ltd. 1986-2002. All rights reserved.
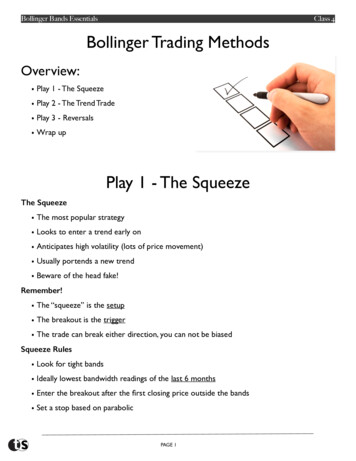
Bollinger Bands (BB)Basic Concepts . . . continuedTags of bands are not necessarily buy/sellsignalsCloses outside BBs can be continuationsignals if confirmed by other indicatorsContraction (The Squeeze) is followed byExpansion, is followed by Contraction .
Basic ConceptsRealTick graphics used with permission of Townsend Analytics, Ltd. 1986-2002. All rights reserved.
Basic Concepts . . .BBs are based on a simple movingaverage. Default is 20-period MA with 2standard deviations.Default contains 95% of price actionWorks well on most time framesLonger term: 50-period MA, 2.1 std. dev.Shorter term: 10-period MA, 1.9 std. dev.
Time Frame: Weekly ChartRealTick graphics used with permission of Townsend Analytics, Ltd. 1986-2002. All rights reserved.
Time Frame: 15-Minute ChartGulp!Check outvolumeRealTick graphics used with permission of Townsend Analytics, Ltd. 1986-2002. All rights reserved.
Time Frame: 5-Minute ChartGulp!Check outvolumeHead-and-ShouldersRealTick graphics used with permission of Townsend Analytics, Ltd. 1986-2002. All rights reserved.
Strategy: Double Bottom-BottomFishingLocate stock basing by forming a doublebottom (time frame—your choice).First bottom may penetrate lower BB.Second bottom may be lower than priorbottom (!), but may not penetrate band.
Strategy: Double Bottom-BottomFishingOther indicators must show bullishdivergence.Confirming break to upside must be onhigh volume.Place protective stop just below recentbottom.
Double Bottom-Bottom Fishing10 point day!RealTick graphics used with permission of Townsend Analytics, Ltd. 1986-2002. All rights reserved.
Double Bottom-Bottom FishingRealTick graphics used with permission of Townsend Analytics, Ltd. 1986-2002. All rights reserved.
Shorting Strategy: Double TopHead-and-ShouldersLocate stock forming Double (or Triple)Top, or Head-and-ShouldersFirst top, or left shoulder head, willpenetrate upper BBSecond top, or right shoulder, may notpenetrate upper band
Shorting Strategy: Double TopHead-and-ShouldersAdditional indicators show bearish divergenceDouble Top– Second pivot: Sell short as stock falls below low ofhigh day– Final leg: Sell fall of fall below middle pivot of “M,”or support area– Low risk: Wait for throwback rally to failHead-and-Shoulders– Sell short as stock breaks neckline– Low risk: Wait for throwback rally to fail
Sell Short Double TopThrowback rallyRealTick graphics used with permission of Townsend Analytics, Ltd. 1986-2002. All rights reserved.
Sell Short Head-and-ShouldersTagNo tagRealTick graphics used with permission of Townsend Analytics, Ltd. 1986-2002. All rights reserved.
Strategy: Identify Market TopsRealTick graphics used with permission of Townsend Analytics, Ltd. 1986-2002. All rights reserved.
Strategy: Play “The Squeeze”Locate a stock in a “tight Squeeze”Identify prevailing trendScan additional indicators to prepare forpossible entryOnce in, set trailing stop
Play “The Squeeze”Yesssssssss!Head Fake!RealTick graphics used with permission of Townsend Analytics, Ltd. 1986-2002. All rights reserved.
In Conclusion . . .Bollinger Bands help you, the traderand/or investor, to identify price patterns,trend direction, and reversals.This knowledge aids you in placing wellthought out, disciplined, low-risk trades.Remember your first priority is always toconserve your capital!
Bollinger Bands. Where they are used Time frames Basic Concepts how they work Combining them with other indicators What they are – Identify price patterns – Confirm trends – Locate high-probability setups, entries and exits. Bollinger Bands . What they are . . . Created by John Bollinger in early 1980’s Consist of upper and lower envelopes, or bands, plotted in and around the price .