Transcription
Exp Brain Res (2008) 190:475–491DOI 10.1007/s00221-008-1489-3RESEARCH ARTICLEPerformance differences in visually and internally guidedcontinuous manual tracking movementsBenjamin A. Philip Æ Yanchun Wu ÆJohn P. Donoghue Æ Jerome N. SanesReceived: 11 July 2007 / Accepted: 7 July 2008 / Published online: 23 July 2008Ó US Government 2008Abstract Control of familiar visually guided movementsinvolves internal plans as well as visual and other onlinesensory information, though how visual and internal planscombine for reaching movements remain unclear. Traditional motor sequence learning tasks, such as the serialreaction time task, use stereotyped movements and measure only reaction time. Here, we used a continuoussequential reaching task comprised of naturalistic movements, in order to provide detailed kinematic performancemeasures. When we embedded pre-learned trajectories(those presumably having an internal plan) within similarbut unpredictable movement sequences, participants performed the two kinds of movements with remarkablesimilarity, and position error alone could not reliablyidentify the epoch. For such embedded movements, performance during pre-learned sequences showed statisticallysignificant but trivial decreases in measures of kinematicerror, compared to performance during novel sequences.However, different sets of kinematic error variables changed significantly between learned and novel sequences forindividual participants, suggesting that each participantused distinct motor strategies favoring different kinematicvariables during each of the two movement types. Algorithms that incorporated multiple kinematic variablesidentified transitions between the two movement types wellB. A. Philip (&) J. P. Donoghue J. N. SanesDepartment of Neuroscience, Warren Alpert Medical School ofBrown University, Sidney Frank Hall, 185 Meeting Street,Box GL-N, Providence, RI 02912, USAe-mail: Benjamin Philip@brown.eduY. WuDivision of Applied Mathematics, Brown University,182 George Street, Providence, RI 02912, USAbut imperfectly. Hidden Markov model classification differentiated learned and novel movements on single trialsbased on the above kinematic error variables with82 5% accuracy within 244 696 ms, despite the limited extent of changes in those errors. These results suggestthat the motor system can achieve markedly similar performance whether or not an internal plan is present, as onlysubtle changes arise from any difference between theneural substrates involved in those two conditions.Keywords Motor control Reaching Human Sequence learning Hidden Markov modelsIntroductionVoluntary arm movements can be guided by visual cuesand internal plans, separately or in combination. In order tohave value as feedback, information about the currentposition of the hand or arm must be compared to a plannedposition or arm configuration. Such information can onlyproceed from current sensory (e.g., visual) input or comparison to an internal ‘plan’ generated through learning.While the more commonly used term ‘‘internal model’’(see, e.g., Shadmehr and Mussa-Ivaldi 1994; Miall andJackson 2006) refers to a forward model of arm dynamicsas modified by environmental influences, this ‘‘internalplan’’ instead refers to prior knowledge about a movementsequence or task sequence; that is, the additional information available only for a previously learned movementpattern. It may be a movement template, procedural modelof muscle activations, or memorized sequence of cues orother external guides; each of these possibilities representsone possible way in which the nervous system might storeor use this prior knowledge. Behavioral differences123
476between movements guided with and without this internalplan can provide information about the neural mechanismsof internally and sensory guided actions.Studies attempting to differentiate between trained andnovel (untrained) movement sequences have primarilyexamined simple, stereotyped movements such as the finger-tapping patterns used in the serial reaction time task(SRTT, e.g., Nissen and Bullemer 1987; for discussion seeRobertson 2007). These studies have been mainly motivated to understand the differences between explicit(declarative) and implicit (procedural) representations oflearned sequences. In contrast, motor sequence learninghas not been extensively studied in manual trackingmovements that occur in many ecologically relevant situations such as driving a car or printing letters. For both ofthese movement types, the presence of an internal planmarks the distinction between learned and unlearnedmovements; performance improvements for practicedsequences over novel sequences reveal the use of such aninternal plan in addition to on-line sensory information forcontrol. These internal plans of procedurally learnedsequences appear to depend upon element-to-elementassociations in primary motor cortex and basal ganglia,with temporal integration in supplementary motor area andpre-supplementary motor area, and rehearsal in prefrontalcortex as explicit knowledge becomes available (Asheet al. 2006). Human imaging studies have also suggestedthe involvement of various parietal regions, includingintraparietal sulcus, rostral inferior parietal, and precuneus(Grafton et al. 1998; Sakai et al. 1998; Bapi et al. 2006) inthe generation and maintenance of internal plans. How thecerebral cortex integrates these plans with visual information to control movement via specific effectors remains amajor unanswered question for understanding skilledaction generation.While the SRTT can reveal procedural learning (e.g.,Grafton et al. 1998; Bapi et al. 2000; Poldrack et al. 2005),the finger-tapping movements involved may not providerich enough data to uncover the effects of internal plans onvoluntary movement, or to uncouple such effects fromvisual information. First, the SRTT measures only reactiontime, a single component of naturalistic movements.Reaching movements allow the evaluation of many errorfeatures, such as amplitude, position, velocity and time.Multiple error features often arise from distinct cognitivechannels (Bhat and Sanes 1998), and therefore may besubserved by partially separate neural substrates. By considering kinematics in multiple variables, we might betterunderstand the effects of the internal plan on movements.Second, the SRTT shows significant performance effectsfrom stimulus-response mappings or even perceptualprobabilities as well as motor response probabilities(Lungu et al. 2004), suggesting that the SRTT is better123Exp Brain Res (2008) 190:475–491suited to abstract or general sequence learning than tomotor sequence learning per se.The use of two-dimensional reaching movementsintroduces a number of issues not faced in the SRTT orother button-pressing tasks such as the 2 9 5 task (Hikosaka et al. 1995). Traditional experimental paradigms forpoint-to-point movements (e.g., Moran and Schwartz 1999;Diedrichsen et al. 2005) have many limitations such assmall parameter spaces and strong interdependenciesbetween variables (Paninski et al. 2004; Wang et al. 2007).A pursuit tracking task (Paninski et al. 2004) overcomesthese challenges, but a stimulus with continuous randommovement may be complex for human participants tomemorize. In order to reduce learning demand whileretaining continuous reach sequences sampled widely fromthe possible space of positions and direction changes, wedeveloped a task having a continuously moving targetstimulus that moves through a consecutive series of straightlines with fixed length and a traditional bell-shapedvelocity profile, approximating the natural characteristicsof linear point-to-point movements (Morasso 1981). Theserigid control conditions reduce the sequential informationto the direction of each element line, while still requiringnaturalistic motor outputs.One reason for the dearth of studies employing complex,continuous movements could relate to an absence ofmethods to distinguish trained actions from visually guidedrandom actions in tracking tasks. Such methods wouldseem necessary toward characterizing the neural processesthat differ between these modes of action. In this study, weevaluated kinematic differences and developed Bayesianand hidden Markov classification algorithms to discriminate between untrained (i.e., guided by sensory input) andtrained (i.e., guided by both sensory input and an internalplan) movements, even when both modes occur as parts ofa single continuous sequence.When participants could use internal plan informationin addition to sensory information, we expected to participants to eliminate or reduce errors caused by the visualfeedback delay. Such performance improvement shouldappear in the form of reduced values for kinematic errormeasures such as position, velocity, and latency betweenhand cursor and target movement. However, we saw onlysubtle kinematic changes between the task’s two controlmodes, the specifics of which varied across participants.The lack of consistent changes in kinematic error variables suggests that visual and internal plan informationcombine for reaching movement control upstream of themain source of common noise. Despite the participantspecific and often subtle extent of these changes, ourhidden Markov classification algorithm could nonethelessidentify the presence of an internal plan promptly andaccurately.
Exp Brain Res (2008) 190:475–491MethodsParticipants and apparatusFourteen healthy young adults (six male, age 23 5)participated in the study. All participants were right-handedby self-report and had normal vision or corrected for normal. They gave informed consent to the procedures asapproved by the Institutional Review Board of BrownUniversity. Five of the 14 participants returned5 2 months after their initial session for a follow-up setof procedures.Participants sat in a chair positioned in front of a computer controlled LCD panel (1900 , 1,280 9 1,024 pixels)and an Intuos2 digitizing tablet (28.5 9 28.5 cm, 25.65 visual angle; Wacom Technology, Vancouver, WA, USA).A moving target (5 mm diameter, 0.45 visual angle)appeared on the LCD panel, and participants used the tablet’s cable-free electronic stylus to control a position cursor(3 mm, 0.27 of visual angle). Each point on the tabletmapped to one point on the computer screen, such thatdistances were equal on the two devices. Participants heldthe stylus in a power grip throughout the experiment andmoved the stylus only by shoulder and elbow movements,with the hand and elbow remaining in the horizontal planeatop the tablet. We determined the relative positions of thetablet and the participant’s shoulder by allowing the participant to find a comfortable position with their arm in theabove position, their hand resting on the center of the tablet.Custom software for Matlab 7.2 (The MathWorks Inc.,Natick, MA, USA) controlled stimulus presentation anddata collection; it updated target position at 62.5 Hz, andrecorded X, Y location of the response cursor at 125 Hz.Stimulus generationWe generated target trajectories using custom softwarewritten using Matlab. A trial’s trajectory comprised a seriesof target cursor positions that moved the target through aseries of straight-line movements. Each individual movement (segment) lasted 965 ms and covered 4.67 cm (4.2 visual angle), with an approximately bell-shaped velocityprofile (Fig. 1b); see below for detailed discussion of trajectory creation. Each segment’s mean tangential velocitywas 5.02 cm/s, peak 11.35 cm/s. Within each segment, thehighest target cursor velocity occurred at the segmentmidpoint. The number of segments per sequence variedbetween task conditions; the single ‘‘Repeat’’ sequence hadsix segments, the 50 ‘‘Novel’’ sequences each had sixsegments, and the 50 ‘‘Test’’ sequences had 18 segmentseach (see Task).To generate a target trajectory for a candidate Repeatsequence, we chose a starting point randomly from a477uniform distribution of X and Y coordinates within theworkspace. We chose an endpoint for that segment byrandomly selecting a movement direction from a uniformdistribution of directions that would result in endpointswithin the workspace, repeating to produce all six segments. We discarded a candidate sequence if it met any ofthe following rejection criterion: (1) it showed a significantcorrelation between X and Y position; (2) it showed acorrelation between time and X position or Y position, i.e.,its use of the workspace was unevenly distributed acrosstime; (3) if the total distribution of positions showed a nonnormal distribution around the center of the workspace ineither X or Y space. If a candidate sequence passed thisquantitative testing, we also examined it qualitatively,discarding it if it held any obvious memorable features,such as squares or other readily identifiable geometricalshapes.We generated additional six-segment candidates asabove for Novel trials, and tested them quantitatively asdescribed above. In order to create 18-segment (17.37 s)sequences for Test trials, we spliced 2–10 (mean 6) extrasegments onto the beginning of the Repeat sequence and 2–10 segments onto its end; we created each set of extrasegments using the methods above. We subjected the fullTest sequences to quantitative tests (1) and (2) only.TaskBefore the experiment, participants received instructions asto the overall task, as well as the order and content of theexperimental conditions. Throughout the experiment, aparticipant’s goal was to keep the position cursor as closeas possible to the target cursor. A trial comprised a series ofstraight-line movements of the target cursor as describedabove with corresponding pursuit tracking. Inter-trialintervals lasted a minimum of 2 s, ending when the participant held the position cursor over the new target cursorfor 1 s. Twenty or 50 consecutive trials of the same typecomprised a block, depending on the task condition asdescribed below. Intervals between blocks lasted at least6 s, but participants were encouraged to rest before startingthe first trial in the subsequent block. Trials were neverovertly numbered or labeled.A session comprised five task conditions. The first,‘‘Novel,’’ presented a different trajectory on each of 50trials, to establish baseline performance for the continuousreaching task. The second, ‘‘Novel-Generation,’’ established chance performance levels for generating trajectoriesfrom memory, by requiring the participant to recreate atrajectory seen only once previously. The third, ‘‘Repeat,’’allowed the participant to train on a single movementsequence by presenting it on each of 100 trials. The fourth,‘‘Repeat-Generation,’’ tested explicit learning by requiring123
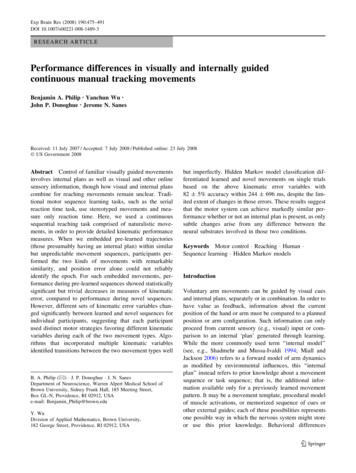
478Fig. 1 Experiment design. For illustrations of trial types (a1–3), ctarget moved continuously along path from start (circle) in motiondirection (arrow), one point per display frame (16 ms). Although thecomplete paths are shown here, participants saw the target cursor inone point at a time. All distances measured from workspace center.Novel (a1) and Repeat (a2) trials each contained six segments. Testtrials (a3) contained the Repeat path (large dots, six segments)flanked by Novel segments (small dots, 12 segments; here, six beforeRepeat and six after). Each segment has tangential velocity profiledrawn from a normal distribution (b)the participant to recreate the Repeat trajectory from theRepeat condition from memory. The final condition,‘‘Test,’’ required the participant to switch between pursuitof novel target cursor movements and familiar target cursormovements during a single long sequence.The ‘‘Novel’’ condition (Fig. 1a1) comprised a singleblock of 50 unique trials. Each trial comprised six segments (5.79 s duration). At the end of each trial,participants received error feedback in the form of thenumerical value of the trial’s root mean squared (RMS)position error in cm.The second, ‘‘Novel-Generation’’ condition comprised asingle block of 20 identical trials. The target cursor followed the last trajectory that had been shown during theNovel block; that trajectory only differed from other Noveltrials by its placement at the end of the sequence block.During Novel-Generation trials, the target cursor becameinvisible after the first 0.5 s, forcing the participant togenerate the trajectory from memory; the target cursorbecame visible again for the last 0.5 s. Participantsreceived no error feedback at the end of each trial.The third, ‘‘Repeat,’’ condition (Fig. 1a2) comprised 100repetitions of the same trajectory, performed in two consecutive blocks of 50 trials each. This trajectory containedsix segments (5.79 s duration). All participants receivedthe same movement sequence for the Repeat condition,since preliminary data (not shown) showed no significantwithin-participant performance difference for differenttrajectories. At the end of each trial, participants receivederror feedback in the form of the numerical value of thetrial’s RMS position error, in cm. The fourth, ‘‘RepeatGeneration’’ condition comprised a block of 20 identicaltrials. As in the Novel-Generation, the target cursor becameinvisible for most of the trial; however, during RepeatGeneration, the invisible target cursor always followed thesame trajectory as during the Repeat condition. Participantsreceived no error feedback at the end of each trial.The fifth, ‘‘Test’’ condition, comprised a block of 50trials, each having 18 segments (17.37 s). Each trial comprised a random number (2–10) of novel segments,followed by the entire Repeat trajectory, followed by123Exp Brain Res (2008) 190:475–491
Exp Brain Res (2008) 190:475–491another 2–10 novel segments (Fig. 1a3). This divided eachTest trial into three epochs: the first epoch of Novelmovements (Novel-1), the Repeat epoch, and the secondepoch of Novel movements (Novel-2). There were no overtdifferences between the epochs, but participants knew thateach trial would contain the Repeat sequence. Participantspressed a key with their left hand when they became awarethat they had entered or exited the Repeat sequence; i.e.,when they identified a change in epoch. After each trial,participants assigned a 1–10 subjective accuracy rating totheir key presses for the trial. Participants received no errorfeedback at the end of each trial.Condition order was not randomized; in order to optimize performance at the complex task of the Testsequences, the Test condition immediately followed theRepeat conditions.Five participants returned for a second session in orderto present a version of the Test condition including catchtrials, in order to evaluate success of classification models(see below) in the absence of any Repeat sequence. On thesecond session, participants received an abbreviated version of the above protocol, containing only two conditions.In a Repeat condition (Second-Repeat), they performed 50trials of the same Repeat trajectory they had performed ontheir first session. In a Test condition (Second-Test), theyperformed 50 trials, of which 20% (ten trials) were Catchtrials while the rest followed the Test trial format abovewithout repeating any individual trials from the previoussession. Catch trials were the same length as Test trials, butdid not contain the Repeat sequence. Participants heard atsession start that Test trials may or may not contain theRepeat sequence.Data analysisOf the 50 Test trials performed by each participant, weincluded 37.3 9.0 (median 39.5) for further analysis.Exclusion criteria, indicating participant inattention orfailure to perform the presented trial, included either of thefollowing: (1) the participant failed to press the key(marking a change in epoch) twice; (2) if the participant’sself-reported accuracy rating for the trial was more thantwo standard deviations below their own mean value; i.e.,if the trial showed unusually poor performance or attention.These criteria allowed us to focus on trials that includedconscious identification of the Repeat sequence.We calculated X position error, Y position error, Xvelocity error, Y velocity error, and RMS position errorbetween the position cursor and target cursor for eachsample point (125 Hz). We calculated instantaneousvelocity error by subtracting the response cursor velocityfrom target cursor velocity on each axis separately. Forclassification models, we smoothed these measures by479averaging from a time window of 152 ms (19 samplepoints), centered on the current sample point. We determined lag (time error) values by identifying the peak of thecross-correlogram between target cursor velocity andposition cursor velocity (904 ms width, 113 sample points)calculated at (i.e., centered on) each sample point, after thepreviously described smoothing.Because participants knew the length of the Repeatsequence, and therefore could predict the transition fromthe Repeat epoch to the Novel-2, all Test trial analysescompared the Novel-1 epoch against the Repeat epoch. Thetask’s attentional requirements differed widely betweenNovel-1 (in which the participant needed to identify thebeginning of the Repeat sequence) and Novel-2 (in whichthe participant had no such need). As such, we decided notto group Novel-1 and Novel-2 data. Data and analyses forthe transition between the Repeat epoch and Novel-2 arenot shown, and all ‘‘Novel epochs’’ refer to Novel-1, unlessotherwise specified. Furthermore, we removed the firstsegment (0.965 s) of Novel-1 from analyses to avoideffects specific to the start of movement.We generated latency times by adding the full windowlength used for data averaging to the time elapsed betweentask epoch change and estimated epoch change. ForBayesian classification (see below), we based the epochchange time on a measure of when the model identified theepoch reliably. For this purpose, we defined a reliableclassification as the start of a period of consistent classification of a calculated minimum length. We determined thatminimum length as the smallest window that produced lessthan 5% misclassifications (false positives) during theNovel epoch for that participant.We did not assess key-press data in detail due to unreliability of precise timing in Matlab time-stamp recording.During data collection, the Matlab software introducednoise while determining the time of discrete events (e.g.,key-presses and task epoch change times). We knew theground truth for task epoch change times, so we determinedthe Matlab-introduced error by comparing those valueswith the online-measured task epoch change times. Wecorrected population measures of key-press times bythe mean Matlab-introduced error for each participant(-17 99 ms across participants).All significance values represent results from t testsunless otherwise specified.Classification algorithms: BayesianBayesian maximum-likelihood classification allowed estimation of a movement’s state (control mode; trained oruntrained), based on the probability of data distributionsoccurring under each state and the probability of each stateoccurring during training. We built a model of Repeat and123
480Exp Brain Res (2008) 190:475–491Novel movements and tested this model by attempting tomake instantaneous identifications of the control modeduring a participant’s movements. We built a Gaussianmixture model using X and Y position error, X and Yvelocity error, and time lag, and estimated its parameterH {PS, lS, RS: S repeat or novel} from all trialsexcept the one currently being tested (cross-validation).See Press (1989) for a detailed discussion of Bayesianclassification theory and implementation.In order to estimate the model parameter H, we chosethe one that maximizes the joint probability [maximallikelihood estimate (MLE)]. The MLE is the empiricalfrequency for each state PS, and empirical mean l andcovariance matrix R for each Gaussian component. Giventraining data D, PS ; l ; R ¼ arg max PðD; SjPS ; RÞPS ;l;R¼ arg max PðDjS; l; RÞPðSjPS ÞPS ;l;Rwhere (S, D) are the known task states and data for alltraining trials, and * indicates an estimated value.We inferred the state (Repeat vs. Novel condition) S*using data DtestS ¼ arg max PðSjDtest ; HÞestimated transition probability from transition frequencyover time, and estimated the Gaussian means and covariance matrix from the empirical means and covariancematrix for performance variables during each condition.S1:T ¼ ðS1 ; S2 ; . . .; ST Þ denotes the sequence of internalstates and D1:T ¼ ðD1 ; D2 ; . . .; DT Þ denotes the kinematicerrors. The joint probability ofPðD1:T ; S1:T jHÞ ¼¼where H {A, l, R} are the transition probabilitybetween the different states, and the Gaussian component’smeans and variances, which specify the dependencybetween the observed kinematic error and the internal state,respectively. We estimate the optimal H* that maximizesthe joint probability PðD; SjHÞ for the training data set.After training, we decoded the optimal internal states forthe test data that maximizes the posterior probabilityS ¼ arg max PðSjDtest ; HÞS¼ arg max PðS; Dtest ; HÞSWe implemented these equations by calculating P(Dtest S)from the formulað2pÞ jRS jTð12Þ 1 1exp 2ðDtest lS Þ ðRS Þ ðDtest lS Þand drawing PS from the task design.Classification algorithms: hidden Markov modelsHidden Markov models (HMM) estimate the time of a statechange, based on the distributions and past history of statedependent variables (see, e.g., Rabiner 1989). We assumedthat the internal states formed a Markov chain; that is, thecurrent state depended only on the immediately previousstate, and generation of the observed errors depended probabilistically only on the current state. The unobservableMarkovian internal state sequence and the observable kinematic error sequence together form a HMM that provides aprincipled estimate for the occurrence of state changes.We trained the HMM on all Test trials except the onebeing evaluated (cross-validation). We trained the modelby estimating the transition probabilities for the Markovstates and the dependency parameters for distributions ofkinematic errors during each state. Because we knew theground truth of task condition for training trials, we123PðST jST 1 ; AÞPðDt jSt ; l; RÞt¼1¼ arg maxS1TYS¼ arg max PðDtest jS; HÞPðSjHÞð52ÞPðST jST 1 ; HÞPðDt jSt ; HÞt¼1SPðDtest jSÞ ¼TYTYPðSt jSt 1 ; AÞPðDt jSt ; l; RÞt¼1We achieved the decoding using the Viterbi algorithm, aparticular case of the dynamic programming algorithm(Geman and Kochanek 2001). This algorithm uses thesequential structure of the HMM, enabling us to decode theoptimal hidden states in linear time. In order to implementthis decoding, we calculated the maximal log likelihood C asCðt; St Þ ¼ max log PðStþ1 jSt ; AÞ þ log PðDt jSt ; l; RÞStþ1þ C ðt þ 1; Stþ1 Þfor each time t and possible current state S, given data Dt.We calculated this and the following formula in a tail-tohead (reversed) direction for ease of computation, since thereversed chain is also Markovian. We also save thepossible optimal state R at each instance t asRðt; St Þ ¼ arg max log PðStþ1 jSt ; AÞ þ log PðDt jSt ; l; RÞStþ1þ C ðt þ 1; Stþ1 ÞWe determined the final optimal state S* by choosing thevalues of S (that is, the columns of R) from the value of R atthe previous t, via S tþ1 ¼ R t; S t :Note that this returns state selection to a head-to-tail (forwards) direction.
Exp Brain Res (2008) 190:475–491Classification algorithms: discriminant analysisTo compare the above analyses against a simpler classification scheme, we also classified our raw data using avariant of linear discriminant analysis (LDA), which findsthe linear combination of features separating classes ofevents. To do so, we wished to classify our data basedsolely on RMS position error, a traditional kinematicmeasurement. We used Fisher’s linear discriminant (FLD)algorithm, a variant of LDA that functions even on datathat are not normally distributed, as was the case for RMSposition error here. We implemented FLD using a Matlabscript released by Nuo Li (‘‘LDAplane.m’’, esultsLearningWe first evaluated whether participants learned movementsequences through position error reduction, using a position RMS error (RMSe) measure normalized withinsubjects to the first Novel trial. Figure 2a illustrates thesuccess of participants to learn the task and the Repeatsequence. The large error reduction occurred in the first tentrials for the novel task, and did not appreciably declinefurther (Fig. 2a, thin trace) since the RMSe for the last 40trials did not differ significantly from zero slope(P [ 0.99). During the Repeat condition, mean error initially declined beyond that for the Novel task (Fig. 2a,thick trace), while the last 80 trials did not differ significantly from zero slope (P [ 0.99).Participants returning for a second session did not perform the Novel condition on that day, but still started theirRepeat trials (Second-Repeat condition; Fig. 2a, dottedtrace) at approximately the same error level as the Repeattrials on the first session; for participants who performedboth sessions, we could not distinguish mean RMSe481between the first Repeat trial and first Second-Repeat trial(P 0.187). There was some evidence of retained learningof the specific sequence, in that participants performedsignificantly better during the second session after performance stabilization; trial mean RMSe values weresignificantly lower than for the original Repeat conditionduring its stable region (P B 0.0001).We next compared performance among the last 18 trialsof Novel-Generation, Repeat-Generation and Repeat conditions to demonstrate the presence of explicit learning(Fig. 2b). We examined only 18 trials because participantssometimes misunderstood the directions for the first 1–2trials. Novel-Generation trials had a mean RMSe of45.46 28.65 mm, while Repeat-Generation had mean12.68 8.72 mm, and the Repeat trials had mean7.99 7.94 mm. Pairwise tes
Performance differences in visually and internally guided continuous manual tracking movements Benjamin A. Philip Æ Yanchun Wu Æ John P. Donoghue Æ Jerome N. Sanes Received: 11 July 2007/Accepted: 7 July 2008/Published online: 23 July 2008 US Government 2008 Abstract Control of familiar visually guided movements