Transcription
Beaconnect: Continuous Web Performance A/B Testing at ScaleWolfram Wingerath Benjamin Wollmer Markus Bestehornwolle@uni-oldenburg.deUniversity of Oldenburg, Germanybenjamin.wollmer@uni-hamburg.deUniversity of Hamburg, Germanybestem@amazon.chAmazon Web Services, SwitzerlandStephan SuccoSophie FerrleinFlorian Bücklersss@baqend.comBaqend, Germanysf@baqend.comBaqend, Germanyfb@baqend.comBaqend, GermanyJörn DomnikFabian PanseErik Wittjd@baqend.comBaqend, Germanyfabian.panse@uni-hamburg.deUniversity of Hamburg, Germanyew@baqend.comBaqend, GermanyAnil Sener†Felix GessertNorbert Rittersenera@amazon.comAmazon Web Services, UKfg@baqend.comBaqend, Germanynorbert.ritter@uni-hamburg.deUniversity of Hamburg, GermanyABSTRACTContent delivery networks (CDNs) are critical for minimizing accesslatency in the Web as they efficiently distribute online resourcesacross the globe. But since CDNs can only be enabled on the scopeof entire websites (and not for individual users or user groups),the effects of page speed acceleration are often quantified with potentially skewed before-after comparisons rather than statisticallysound A/B tests. We introduce the system Beaconnect for collectingand analyzing Web performance data without being subject to theselimitations. Our contributions are threefold. First, Beaconnect isnatively compatible with A/B testing Web performance as it is builtfor a custom browser-based acceleration approach and thus doesnot rely on traditional CDN technology. Second, we present our continuous aggregation pipeline that achieves sub-minute end-to-endlatency. Third, we describe and evaluate a scheme for continuousreal-time reporting that is especially efficient for large customersand processes data from over 100 million monthly users at Baqend.PVLDB Reference Format:Wolfram Wingerath, Benjamin Wollmer, Markus Bestehorn, Stephan Succo,Sophie Ferrlein, Florian Bücklers, Jörn Domnik, Fabian Panse, Erik Witt,Anil Sener, Felix Gessert, Norbert Ritter. Beaconnect: Continuous WebPerformance A/B Testing at Scale. PVLDB, 15(12): 3425 - 3431, e the importance of content delivery networks (CDNs) forfast page loads is generally undisputed, accurately measuring theirimpact is inherently difficult: Since a CDN is integrated as a reverseThis work is licensed under the Creative Commons BY-NC-ND 4.0 InternationalLicense. Visit https://creativecommons.org/licenses/by-nc-nd/4.0/ to view a copy ofthis license. For any use beyond those covered by this license, obtain permission byemailing info@vldb.org. Copyright is held by the owner/author(s). Publication rightslicensed to the VLDB Endowment.Proceedings of the VLDB Endowment, Vol. 15, No. 12 ISSN 2150-8097.doi:10.14778/3554821.3554833 Wolfram† AuthorWingerath and Benjamin Wollmer contributed equally to this work.was affiliated with Amazon Web Services, Inc. during contribution period.3425proxy via Domain Name System (DNS) rules, it can only be enabledor disabled for all users of a given website at once and uplift measurements are therefore only possible via before-after comparison.Even though statistically clean A/B testing is the default in manyother areas of Web optimization (e.g. user interface design [46] ormarketing campaign planning [5]), the best practice for evaluatingpage speed is naturally distorted by effects like fluctuating onlineactivity or different marketing campaigns being active over time.We argue that skew in uplift measurements can be avoided in thecontext of page speed acceleration and therefore present Baqend’sapproach towards achieving and measuring website acceleration.Baqend’s architecture for content delivery relies on two maincomponents: While Beaconnect is the pipeline for aggregating andreporting real-user performance data, it has been developed for usewith Speed Kit [41] as the technology for page speed acceleration.Speed Kit is a novel technology for website acceleration that uses aCDN internally, but is controlled through a JavaScript library. Inconsequence, its configuration is more flexible than simple DNSrules pointing to a CDN: Being a browser-based approach, SpeedKit can be enabled and disabled for individual users and is therefore naturally compatible with statistically sound A/B testing. Toquantify website acceleration with Speed Kit, it is enabled for onlya certain share of website visitors (e.g. 50%) while data is collectedfrom all of them. By collecting data in this fashion, it is possibleto compare measurements from users on the stock website withmeasurements from users on the accelerated website – collectedover the same timeframe and under otherwise identical conditions.A particularly challenging aspect of operating Speed Kit is toreport all relevant metrics accurately while minimizing latency andprocessing overhead. Tracking tools like Google Analytics [30] orAdobe Analytics [6] are unsuitable for this purpose as they relyon data sampling [28] and incur a processing latency of hours oreven days [29]. Real-user monitoring solutions such as mPulse [8]or Dynatrace RUM [21] do provide low latency and avoid datasampling, but would require tight integration into Speed Kit forsufficient data coverage which is prohibitively complex.
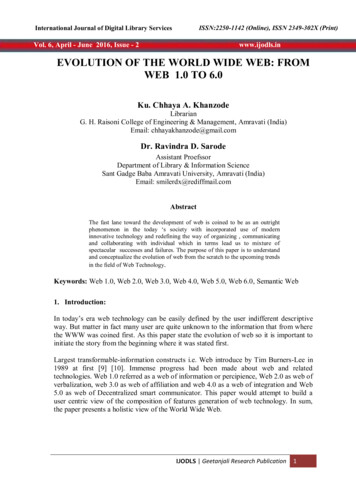
1.1Contributions & OutlineWe developed Beaconnect to capture Web performance with SpeedKit in realtime and A/B testing it at scale. Our pipeline handles morethan 650 million individual page impressions (PIs) from over 100million unique users monthly. We make the following contributions: We discuss related work in Section 2 before explainingBeaconnect’s unique aptness for A/B testing and deriving requirements for simultaneously providing offline datawarehouse analytics and real-time reporting in Section 3. In Section 4, we present Beaconnect’s aggregation strategyfor continuous real-time reporting with sub-minute latency. We finally describe our production system and present experimental results in Section 5, share developer experiencesin Section 6, and conclude in Section 7.2RELATED WORKIn this section, we provide an overview over related work.Page Speed & User Satisfaction. E-commerce researchershave shown that users of websites expect response times of 2 seconds or less [17, 32]. Failure to meet this standard results in decreaseduser satisfaction [13], and potential business loss [44]. To meet this2-second requirement, websites rely on content delivery networks(CDN) [35, 36] such as Akamai [1], Fastly [24], Cloudflare [2], orAmazon Cloudfront [10]: CDNs operate hundreds of endpointsdistributed across the globe and each of these endpoints replicateswebsite content that originates on the Web servers of the website.This allows serving content to users with less latency as less network traffic has to travel from the aforementioned Web servers tothe user and instead is delivered by a CDN endpoint close1 to theuser. While the use of CDNs is well established, measuring theirachieved performance uplift in skew-free fashion is inherently hard.Web Performance Monitoring. Web performance monitoringrefers to the process of observing the state of Web services or Webapplications over time by employing either external or internalmonitoring or measuring artifacts [20]. The two prevalent waysto collect performance data are to either generate synthetic dataor to perform real-user monitoring (RUM). Synthetic approaches[3, 4, 18] use artificially generated Web traffic to simulate websiteinteractions. While synthetically generated data is easier to produceat scale, it has the potential of missing important properties of realworld behavior as it is limited to measuring purely technical metrics[20]. Business metrics such as conversion rate2 or session durationtherefore cannot be captured by synthetic approaches.RUM uses data generated by real-user behavior to monitor awebsite. There is a large body of work dealing with analytics aswell as data management in RUM: [19] tries to determine failureprobabilities in large systems using end-to-end traces and a hierarchical clustering method. Similarly, [7] uses statistical models tofind latency bottlenecks in communication paths and [15, 16] usedata mining to predict performance. In many cases, the analysisoccurs offline or with significant delay in the order of hours or evendays which is an issue particularly in the context of split testing1 CDNshave different algorithms to find the most suitable endpoint. In general, theendpoint is chosen so that the latency is minimal.2 This is typically the ratio of transactions in a store vs. the number of visitors/sessions.3426Figure 1: Beaconnect continuously aggregates data beaconsinto page impressions (PIs).as we show next. Beaconnect implements RUM using data beacons emitted asynchronously by Speed Kit [41] via a light-weightJavaScript that is executed in the browser of users. Contrary tothe aforementioned approaches, this beacon-based approach alsoallows capturing business metrics. Section 3 describes our data collection and Section 4 provides details for near-real-time analytics.There are also tools like Google Analytics (GA) [30] and mPulse[8] that can be used to monitor real-user performance. Similarlyto the statistical approaches mentioned above, GA samples dataand thus introduces inaccuracy. Furthermore, the reporting delayfor metrics can be significant depending on the traffic volume thatoccurs on a website [29]. Akamai’s mPulse delivers performancemetrics with low latency through a tight integration with the Akamai CDN [1]. However, A/B-testing CDN performance remainsinherently challenging due to the inherent limitations of CDN technology mentioned in Section 1 and described below.Web Performance & Split Testing. For feature developmentand deployment, A/B testing (also known as split testing) has beena de-facto standard for more than a decade in e-commerce sites[23, 33, 34, 38]: Before rolling out a new website feature for allusers, the traffic is split into two groups where one group of theusers gets to use the new feature and the other group keeps usingthe status quo. This mechanism allows measuring the effects ofincremental improvements as user behavior with and without it canbe compared side-by-side. For example, it is possible to determinewhether a new functionality on an e-commerce website resultsin more sales or whether changing the position of a particularbutton increases the likelihood of it being clicked. The underlyingrequirement for split testing is that multiple versions of a websitecan be delivered to separate sets of randomly chosen users.Implementing these random sets of users is challenging in thecontext of CDNs as they can only be enabled or disabled for allusers. Theoretically, round-robin DNS load-balancing could be usedto create a split test setup in which the domain of a website is associated with multiple IP addresses, some of which belong to a CDN andsome of which do not. However, such a setup would be extremelydifficult to control due to a number of potential side effects thatare out of the CDN provider’s hands (e.g. skew introduced by DNSresolvers or caches, mid-session group changes because of expiringDNS caches, or a wide range of other side effects occurring when abrowser establishes more than one connection to the website). Weare not aware of a single implementation of such a test setup andconsider the chances of generating meaningful results slim at best.In combination with CDNs, performance-related metrics arehence only available using a before-after approach, i.e. comparingperformance metrics collected before a change was deployed withmetrics from after the change. This introduces delays and makes itdifficult to correlate measurable changes in performance metrics
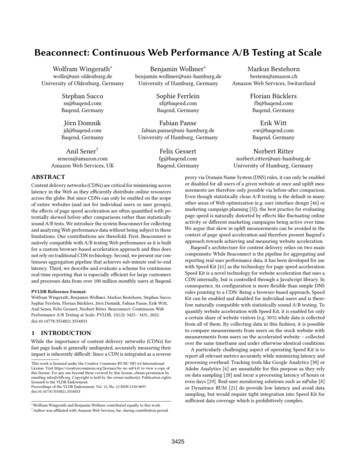
with a specific deployment (especially for large e-commerce websites where multiple changes occur on any given day). Beaconnectavoids this issue as it natively supports A/B testing and reportsnon-sampled performance and business metrics in realtime.3APPLICATION DOMAIN & REQUIREMENTSIn this section, we provide an overview of data collection in thebrowser (Speed Kit) and the required backend processing (Beaconnect) to derive relevant technical and business insights. Weclose the section with a brief discussion of requirements for Beaconnect’s data aggregation pipeline.Par al Page Impressions (PPIs)Enhanced Data BeaconsTimeBrowserLanguageTest GroupFirst Contentful Paint (FCP)11:05:04.578FirefoxEnglishSpeed n. Time WindowsIntermediate Aggregates (Storage)11:0511:06BrowserLanguageTest GroupFirst Contentful Paint (FCP)(Histogram)FirefoxEnglishSpeed Kit{200ms: 1, 500ms: 2}FirefoxEnglishOriginal{600ms: 2, 800ms: 5}SafariGermanOriginal{1100ms: 1}FirefoxEnglishSpeed Kit{200ms: 3}ChromeEnglishSpeed Kit{400ms: 2}OperaFrenchOriginal{700ms: 1, 1300ms: 2}SafariGermanOriginal{600ms: 4, 900ms}Arbitrary Time WindowsReal-Time Repor ng (Dashboard Queries)11:05–11:06BrowserLanguageTest GroupFirefoxEnglishSpeed KitFirst Contentful Paint (FCP)(Histogram){200ms: 4, 500ms: 2}Figure 2: Beaconnect’s continuous aggregation pipelinewrites data summaries to an intermediate storage. Queriesover this intermediate storage can be evaluated efficiently asthey touch fewer records than queries over raw data would.Split Testing Web Performance With Speed Kit. Contrasting traditional CDNs, Speed Kit [41] is a browser-based technologythat makes split testing straightforward. It is designed as a code plugin for (e-commerce) websites and can be included as a JavaScriptsnippet in the website’s HTML. Relying on the Service WorkerWeb standard [9], Speed Kit is implemented as a proxy withinthe browser that redirects certain browser requests to a specializedcaching infrastructure rather than the (comparatively slower) originWeb server. On the very first website visit, the browser downloadsand executes Speed Kit like any other third-party library. SpeedKit’s behavior is then controlled through a configuration that isretrieved on the very first visit and updated in the backgroundthereafter. During a split test, Speed Kit chooses one of the testgroups with a probability respecting the configured split and correspondingly either activates the acceleration feature or not. By3427collecting data from both test groups, the effects of page speedacceleration can thus be measured in a statistically clean way.Data Granularity: Beacons, PIs & Sessions. While page impressions (PIs) seem like the atomic unit to reason about in thecontext of Web performance monitoring, data is actually collectedat a finer granularity within the browser. Sending multiple databeacons for every PI minimizes data loss as information is sentas early as possible, but also requires connecting all data beaconsto full PIs later on and thereby increases complexity for backendprocessing. As illustrated in Figure 1, Speed Kit emits three kindsof data beacons on multiple occasions throughout the page load.Static information such as the target URL or the current timestampcan be sent away as soon the navigation starts (navigation beacon),whereas values obtained from the browser’s Performance API [45]cannot be sent until very late in the load process (load beacon),including the time it took to load the page and the time until thefirst or largest contentful paint (FCP and LCP, respectively). Certain events may even occur long after the page load has completedand are therefore handled via dedicated and optional transmissions(event beacons). For example, a user may read the product description first and then put an item into the shopping cart, thus triggeringa new transmission. As another example, JavaScript errors mayoccur at any point in time and also need to be reported.3.0.1 Backend Aggregation: Connecting Beacons. Sending partialinformation on PIs obviously avoids data loss through deliberatedelays, but also requires connecting all data beacons to full PIs lateron and thereby increases complexity for backend processing. Thisprinciple of connecting beacons is eponymous to Beaconnect. Databeacons for the same PI usually occur in relatively short successionand no new data beacons will be generated once the user has movedonto the next page. We therefore close aggregation windows forany given PI or session after 30 minutes of inactivity which achievesgood results in practice and is in line with industry best practices(e.g. Google Analytics [27]).Requirements for Analytics & Reporting. There are two usecases for data aggregation in the context of Web performance monitoring and tuning that have largely incompatible requirements. First,the fully aggregated PIs need to be retained for exploratory analysisand debugging individual user sessions. This use case requires highdata resolution, but executing queries offline is acceptable. Afterall, deep-dive analyses typically revolve around reported issuesand rarely target data from ongoing sessions. Second, though, dataaggregates (i.e. summaries) need to be reported continuously foreffective operations monitoring and validating certain metrics onnew deployments during and immediately after rollout: Contrastingthe analytics use case, real-time reporting thus critically dependson low latency, but does not require support for arbitrary analyses. This paper is focused on the second use case, i.e. continuousaggregation that enables efficient real-time reporting. We refer to[25, 40] for details on our data warehousing approach.4REAL-TIME REPORTING EFFICIENCYIntuitively, all high-level performance metrics can be computedon top of fully aggregated PIs. However, this approach incurs significant delays in reporting due to the 30-minute timeout for thePI aggregation window and an additional delay for aggregating
session-based data. To minimize the time it takes for data to becomevisible after collection, Beaconnect’s continuous real-time summaryaggregation produces output without waiting for the PI timeout.Partial PIs: Data Beacons PI & Session Dimensions. Thebasic idea is to pre-aggregate the incoming data by different attributes to speed up standard analyses via executing queries overthe intermediate aggregates instead of the raw data. The continuousaggregation therefore buffers data beacons for every PI only for ashort time until the attributes required for pre-aggregation havebeen observed: Once these dimension attributes have been attachedto a beacon, we call this beacon a partial PI to make the distinction from a raw data beacon explicit. Dimension attributes thatare typically stable are buffered for the entire session (e.g. browseror test group), while potentially volatile dimension attributes arebuffered on PI-level (e.g. the currently selected language). Once alldimensions for a PI have been observed, all subsequent beacons ofthat PI contribute to intermediate aggregates without any delay.Histogram Summaries for Performance Timers. As shownin Figure 2, all partial PIs are collected over a small tumbling window (e.g. 1 minute) and then aggregated by different dimensionattributes such as browser, language, test group, and others. Although not illustrated, the intermediate aggregates also containadditional attributes such as the number of observed beacons andthe number of PIs. To avoid storing a great number of raw performance timers, metrics such as the first contentful paint (FCP) arebucketed into histograms. We chose histograms for compressingraw timer values, because averages and quantiles can be computedon their basis3 . For queries over arbitrary time windows, using theintermediate aggregates instead of the raw PI data can accelerateruntime significantly (cf. Section 5). While the intermediate aggregation does incur a certain delay, end-to-end latency is usuallysmaller than aggregation window size: For a 1-minute window under constant beacon inflow, for example, a beacon is only delayedfor 30 seconds on average as the actual buffering time depends onwhen the beacon arrives and when the aggregation window closes.5PRODUCTION DEPLOYMENT & TRAFFICAs of January 2022, Beaconnect handles over 3 billion data beacons per month, which corresponds to more than 650 million PIsfrom over 200 million user sessions and over 100 million uniqueusers. To avoid load skew, we partition the data by user session IDsthat are randomly generated in the browser. But since most of ourcustomers are based in northern Europe, the amount of incomingdata still fluctuates heavily throughout the day with a factor ofabout 14x between minimum and peak traffic. Scaling up and downour pipeline without service interruption is therefore required forefficiency, but also challenging as our aggregation scheme requiresholding every active user session in memory.Deployment as a Service. Our production system is hostedas a collection of fully managed services on Amazon Web Services(AWS) to enable elastic scaling [43]. We chose Flink [26] for executing our workload as it is suitable for running with large stateand is a native stream processor, thus delivering better latencyPI Distribution Within Each Tenant 0MSmallMediumFigure 3: A Tukey box plot for the distribution of tenant sizesmeasured by the monthly traffic in page impressions. Mediantraffic in the Small, Medium, and Large tenant segments isseparated by one order of magnitude each.than systems such as Spark [47] or Spark Streaming [48] which arebased on processing (micro) batches [42, Ch. 5]. The data beaconsare streamed into an Amazon Kinesis [11] data stream which isthen consumed by our Flink application for further processing. Thefirst processing step is data cleaning to prepare the beacon datafor downstream aggregation and write off invalid beacons for laterproblem analysis. The user agents [14, Sec. 10.15] are then resolvedto human-readable data artifacts which are added as additional attributes such as the device type or browser name. We also monitortraffic for suspicious behavior to identify bots and scrapers: The associated user agents are stored in DynamoDB [39], so that the staterequired for identifying such synthetic traffic is persistent and independent of Flink snapshots. Finally, the cleaned and enriched databeacons are fed into our dual aggregation pipeline as outlined inSection 4: The intermediate summary aggregates are ingested intoan Elasticsearch [22] cluster for real-time reporting via Kibana [31]dashboards, whereas the fully assembled PI data stream is persistedin S3 [12] block storage for historical data analysis and operationaltroubleshooting with our data warehouse built on Presto [37].Tenants by Traffic: 3 Orders of Magnitude. The amount ofbeacon data being collected and processed for real-time reportingnaturally depends on the actual number of user traffic on the specific tenant’s website. Figure 2 illustrates how our tenants can beclassified into three segments by their respective monthly PIs (justreferred to as PIs throughout the rest of this section): Large withat least 10M PIs, Medium with 1M to 10M PIs, and Small with lessthan 1M PIs4 . The Large and Medium segments dominate overalltraffic with a share of 78.5.% and 20.5%, respectively, leaving theSmall segment’s traffic at a mere 1%. Our system design is thereforestreamlined to optimize efficiency for traffic-heavy tenants.Efficiency vs. Visibility Delay. As described in Section 4, ourdata model is designed to make reporting as efficient as possible bygrouping PI data along different dimension attributes over smalltime windows of configurable size. Increasing window size naturallyincreases the end-to-end processing delay, but also improves thecompression ratio (CR) as shown in Equation 1:𝐶𝑅 1 3 The bucketing in our production system is more fine-grained than illustrated in Figure4 We2 as it varies with size of timer values to increase precision for smaller measurements(1ms-buckets up to 500ms, 10ms-buckets up to 5s, 100ms-buckets up to 60s, and so on).Large intermediate aggregates PIs (1)exclude tenants with less than 100k PIs in our analysis as they typically do notuse our real-time reporting service and do not contribute to overall traffic significantly.3428
Compression Ratio d5dFigure 4: CR by aggregation window size: Increasing windowsize also increases efficiency, but gains eventually diminish.The CR is a pivotal metric for performance in our reportingscheme, because it directly represents the efficiency of our dashboarding queries: With a CR of 70%, for example, a query executedover the intermediate aggregates touches 70% fewer records thana query over raw data would. Figure 4 shows the compression ratio (CR) for the three tenant segments under varying aggregationwindow sizes from 1 minute up to 5 days (logarithmic x-scale). Compared with raw storage, our aggregation scheme with the baseline1-minute windows provides an efficiency improvement of 37% forLarge and 27% for Medium tenants. In contrast, Small tenants have anegative baseline efficiency (-6%) and only benefit from a minimumof 2-minute windows (21%). This is intuitively plausible as the number of PIs in a given timeframe (denominator in Equation 1) is bydefinition larger for traffic-heavy tenants. Inversely, compressionis less efficient for tenants with little traffic per se, simply becausefewer PIs are reported at any given time and therefore fewer PIs arewritten into the same bucket per aggregation window. As anotherfactor for decreased efficiency with Small tenants, data collectedfor a single PI can also be assigned to multiple aggregates when itsbeacons arrive during the rollover from one intermediate aggregateto the next: This effect may drag down CR for low-traffic tenants asit can lead to the creation of multiple aggregates for single PIs whenthere are no other PIs falling into the same bucket in a given timewindow. However, the amount of intermediate aggregates writtento our database (numerator in Equation 1) depends not only onthe number of PIs and the chosen aggregation window, but also onthe dimension attributes. Adding an additional dimension alwaysincreases the number of intermediate aggregates written per timeinterval and thus decreases compression efficiency. The concretedimension attributes in our evaluation differ for each tenant as theydepend on the individual requirements.Across all tenant segments, increasing aggregation window sizecan have a dramatic effect on CR especially for small time windows:For example, choosing 2- instead of 1-minute windows improves CRby over 31% for Large and Medium tenants and still by 26% for Smalltenants. But efficiency gains eventually diminish with increasingwindow size: For example, doubling aggregation windows alreadygreater than 1 day only leads to CR improvements below 2%, irrespective of the tenant’s traffic numbers. While CR approaches 100%for very large aggregation windows in all segments, traffic-heavytenants naturally reach high CR values faster: The average Largetenant reaches a CR of 80% with a window size of 1 hour, whiletypical tenants in the Small segment would have to tolerate delays3429upwards of 16 hours to reach the same level of efficiency. This is animportant aspect to consider as window size also corresponds tothe granularity in which data can be queried. Choosing excessivelylarge aggregation windows is therefore impractical not only dueto a huge visibility delay, but also because it translates to low resolution for data analyses. In other words, you cannot analyze dailyperformance in the dashboard with 1-week aggregation windows.Summary & Discussion. The analysis confirms that our approach scales well with traffic and offers particularly high efficiencyfor the Medium and Large tenants which are responsible for themajority of overall traffic in production. The CR further depends onaggregation window size and can be traded off against the time thatdata is buffered for aggregation: Better compression thus comeswith a certain visibility delay as data can only be queried after thecurrent aggregation window has closed. Our aggregation schemefor real-time reporting is particularly efficient for larger tenants,because more PIs are compressed into the individual intermediateaggregates when there is more traffic to begin with. We thus achievea good CR for these tenants with 1-minute aggregation windowsalready. Although increasing window size beyond this baseline stillenables significant efficiency gains, further increasing window size(and thus visibility delay) does not provide much benefit when aggregation windows are already large. By processing real-time datain small aggregation windows first (e.g. 1-minute windows) andrecompressing it later (e.g. by hour or day), a low visibility delaycan be combined with a high CR. However, the incurred processingoverhead should be taken into account here as recompression maygenerate substantial load on the storage system.6DEVELOPER EXPERIENCESIn this section, we would like to highlight two rather simple yetpivotal insights we gathered from using Beaconnect in production.6.1Alignment With External Tooling is HardWhile Beaconnect is optimized for measuring the effects of pageload acceleration via A/B testing, the reporting stack of most SpeedKit customers is not. In consequence, the measurements taken withthe customers’ existing monitoring are often skewed between testgroups: When pages load faster, beacons are transmitted earlierand the chance of beacons getting lost is reduced. But since bothtest groups load with different speeds, this effect can distort resultsas certain data points (e.g. early bounces) only become visible forone of the two groups. While accelerating the page load may thusintroduce skew by improving data quality for only one of the twotest groups, the opposite is also true: Accelerating the navigationfrom one page to the next can also increase the rate of droppeddata beacons, because it also reduces the time available f
occurs on a website [29]. Akamai's mPulse delivers performance metrics with low latency through a tight integration with the Aka-mai CDN [1]. However, A/B-testing CDN performance remains inherently challenging due to the inherent limitations of CDN tech-nology mentioned in Section 1 and described below. Web Performance & Split Testing.