Transcription
Anderson et al. BMC Public Health(2019) EARCH ARTICLEOpen AccessPrevalence of diabetes and pre-diabetes inrural Tehri Garhwal, India: influence ofdiagnostic methodPam Anderson1, Nathan Grills1, Rajesh Singh2, Rajkumari Singh2, Roger G. Evans3, Paramita Sengupta4 andAmanda G. Thrift5*AbstractBackground: There are few available data regarding the prevalence of diabetes in the sub-Himalayan region ofIndia. The aim of this study was to determine the prevalence of pre-diabetes and diabetes in rural Garhwal basedon glycosylated hemoglobin.Methods: In a cross-sectional survey of 500 adults from five randomly selected villages in Chamba, a mountainousTehri Garhwal district in Uttarakhand in north-west India, we determined the prevalence of diabetes (hemoglobin(Hb) A1c 6.5%) and pre-diabetes (5.7% HbA1c 6.4%). In a sub-sample of those diagnosed with diabetes or prediabetes (n 140), fasting blood glucose (FBG, n 117) or postprandial blood glucose (PBG, n 23), and bloodhemoglobin concentration, was measured at follow-up.Results: Based on HbA1c, 10.0% had diabetes and 56.4% pre-diabetes. Of those diagnosed as diabetic by HbA1c, 10 of16 (62.5%) were diagnosed as diabetic by FBG ( 125 mg/dL) or PBG ( 200 mg/dL). In those diagnosed as pre-diabeticby HbA1c, only 55 of 124 (44.4%) were diagnosed as pre-diabetic by FBG (100–125 mg/dL) or PBG (140–199 mg/dL). Alarge proportion of these 140 individuals (67.1%) were moderately to severely anemic (Hb 11.4 mg/dL). Thediagnostic gap for pre-diabetes between HbA1c and FBG/PBG was similar for the groups with and without moderate tosevere anemia.Conclusions: HbA1c and FBG/PBG have similar diagnostic performance for diabetes in this population. However, manyindividuals were diagnosed with pre-diabetes by HbA1c but not FBG/PBG. The relative excess diagnosis of pre-diabeteswith HbA1c does not appear to be explained by anemia, an endemic condition in India. The prognostic significance ofdiagnosis of pre-diabetes by HbA1c but not FBG/PBG remains unknown, but merits investigation.Keywords: Anemia, Diabetes, Disadvantage, Fasting blood glucose, Glycosylated hemoglobinIntroductionWorldwide, diabetes is a major contributor to morbidityand mortality [1]. In India the prevalence of diabetesand pre-diabetes is a growing public health concern.There are more than 69 million people with diabetesand this is estimated to increase to 80 million individualsby 2030 [2]. Despite the large number of people withdiabetes there are few data about this condition in ruralnorth India [3]. Most available data regarding the* Correspondence: amanda.thrift@monash.edu5Department of Medicine, School of Clinical Sciences at Monash Health,Monash University, Clayton, Victoria 3800, AustraliaFull list of author information is available at the end of the articleprevalence of diabetes in India come from populationsin urban or southern regions [4–8]. But little is knownabout the mountainous regions of the north where poverty and poor access to health care facilities may exacerbate the problem.Another factor that hampers studies of the prevalenceof type 2 diabetes is the diagnostic methods available.The main diagnostic tests for diabetes include (1) fastingblood glucose; (2) random blood glucose; (3) glycosylated hemoglobin (HbA1c); and (4) the oral glucose tolerance test (OGTT). Each test has benefits anddisadvantages. HbA1c is now widely accepted for diagnosis [9, 10], providing a measure of glycemic control over The Author(s). 2019 Open Access This article is distributed under the terms of the Creative Commons Attribution 4.0International License (http://creativecommons.org/licenses/by/4.0/), which permits unrestricted use, distribution, andreproduction in any medium, provided you give appropriate credit to the original author(s) and the source, provide a link tothe Creative Commons license, and indicate if changes were made. The Creative Commons Public Domain Dedication o/1.0/) applies to the data made available in this article, unless otherwise stated.
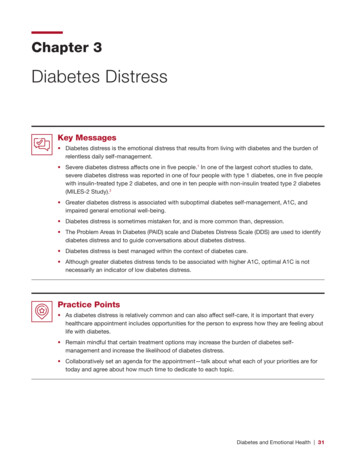
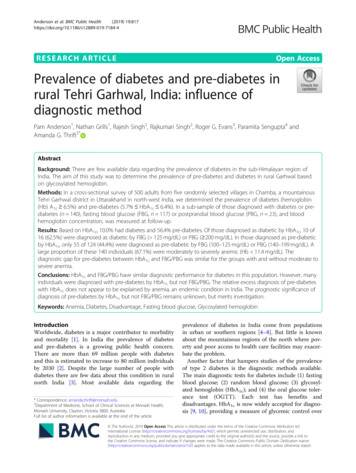
Anderson et al. BMC Public Health(2019) 19:817the prior 3 months [11, 12], but is relatively expensiveand has limited availability in some middle to low income countries [9]. While random blood glucose ismore affordable and convenient as it requires no fasting,it is not recommended as a single diagnostic test unlessclassic symptoms of diabetes are present [9]. Fastingblood glucose and OGTT have been widely used as thestandard diagnostic methods [13]. However, both testshave their limitations. The FBG test requires fasting,hence it can be problematic in an outpatient settingwhereas OGTT is relatively expensive and has low reproducibility [13]. In reality, a mix of these screeningtests are used in the diagnosis of diabetes in regionssuch as rural North India. It is unclear whether there aredifferences in the prevalence of diabetes in such settingsaccording to the diagnostic test used.HbA1c is rapidly becoming the test of choice. TheAmerican Diabetes Association has recommended thatHbA1c may be used as a substitute to fasting blood glucose for diagnosing diabetes [9]. As the costs comedown and the availability increases in India it is anticipated that these tests will become more widely used.Yet, in the context of North India, it is unknown howthis test might perform. There is some evidence thatanemia, and in particular consumptive anemias, mayaffect the HbA1c result [14]. In particular, iron deficiencyanemias may result in a spurious increase in HbA1c [15],leading to a potential over-estimate of the prevalence ofdiabetes and pre-diabetes. Given that the proportion ofpeople with anemia can approach 50% in this area [16],it is critical to determine whether anemia might affectHbA1c in these mountainous regions in north-westIndia.We aimed to determine the prevalence of pre-diabetesand diabetes in rural Garhwal based on glycosylatedhemoglobin. Our primary hypothesis was that diabetesand pre-diabetes are highly prevalent in the region.Based on our initial finding of relatively high prevalenceof both diabetes and pre-diabetes, we then aimed to testthe hypothesis that HbA1c over-diagnoses diabetes andpre-diabetes when compared to FBG. In addition, considering the presence of endemic anemia in India [17]and the possible confounding effect of anemia on HbA1cas a diagnostic marker of diabetes [14], we also aimed todetermine whether anemia is associated with overdiagnosis of pre-diabetes and diabetes.MethodsStudy designWe randomly selected five villages from 58 villages located on the west side of Chamba, in the mountainousTehri District in the Garhwal region of the state ofUttarakhand in northern India (May to July 2015), usingrandom number generation. We undertook a cross-Page 2 of 8sectional survey of adults in each village for between 8and 10 days, with the aim of obtaining approximately100 participants per village. As we did not have a censusfor each village, randomization of individual participantswas not possible. Health staff, including a nurse andhealth workers, recruited participants following full informed consent. Ethical approval was obtained from theGarhwal Community Development and Welfare Society,and written informed consent was obtained before anydata were collected from each participant.Initial survey (time 1)We trained Accredited Social Health Activists (ASHAs),health-workers who reside in most villages in rural India,to administer a questionnaire and to conduct all theclinical and biochemical tests for this study. The ASHAsused questionnaire-based assessments to obtain detailson age, sex, education, and monthly per-capita household income. ASHAs also measured height (Seca,Germany), weight (Salter, UK), and waist and hip circumference (Gulick, Patterson Medical, USA). Screeningfor diabetes and pre-diabetes was undertaken in 499participants, using HbA1c measured by the AfinionAnalyzer (Alere, Oslo; Fig. 1). Staff from ChambaHospital and a trained nurse were in the field to ensureclinical markers were properly measured.Follow-up (time 2)Approximately 3 months after the initial survey, a subsetof individuals with diabetes or pre-diabetes werefollowed up with tests of fasting blood glucose and/orpost-prandial blood glucose, and blood hemoglobin concentration (Fig. 1). As our aim was to provide management for people with diabetes and pre-diabetes, weaimed to follow-up only those with an HbA1c 5.7% atthe initial visit. The FBG test was conducted after fasting8 to 10 h and the PBG was taken 2 h after a meal (75 gof glucose powder). Both FBG and PBG were assessedusing an AccuSure glucometer (MicroGene, New Delhi).Using the same finger-prick blood samples for measuring FBG, blood hemoglobin concentration was assessedwith a hemoglobinometer (Sahli’s type) by staff fromChamba Hospital.Clinical definitionsDiabetes and pre-diabetes were defined according to theAmerican Diabetes Association’s cut points [9]. Participants with 5.7% HbA1c 6.4% were classified as prediabetic and those with HbA1c 6.5% were classified asdiabetic. Pre-diabetes was also defined as 100 mg/dL FBG 125 mg/dL or 140 mg/dL PBG 200 mg/dL. Diabetes was defined as a FBG 125 mg/dL or PBG 200mg/dL. Levels of HbA1c and FBG were recoded into normal, pre-diabetes and diabetes based on these
Anderson et al. BMC Public Health(2019) 19:817Page 3 of 8Fig. 1 Study Flow Diagram. *HbA1c at Time 1 was missing for 1 case, Average interval between Time 1 and Time 2 100 days, HbA1c:Glycosylated hemoglobin, FBG: Fasting blood glucose, PBG: Post-prandial blood glucosedefinitions. Moderate to severe anemia was defined ashemoglobin 11.4 mg/dL adjusted for high altitude according to the World Health Organization’s criteria [18].Hemoglobin concentration levels above the cut-off wereclassified as normal to mild anemia.to compare the proportions of diabetes and pre-diabetesbased on HbA1c and glucose-based tests.ResultsBaseline characteristicsStatistical analysisAll analyses were conducted using Stata version 14 (StataCorp., Texas). Age, weight, height, waist, hip, body massindex (BMI) and monthly income per capita (householdmonthly income/household size) are presented as mediansand quartiles (Q1, Q3). Categorical variables (sex and education) are presented in percentages.We assessed the crude prevalence of pre-diabetes anddiabetes among the participants using HbA1c measuredduring the initial survey (time 1). Age and gender specific prevalence of diabetes were compared using Pearson’s Chi-square test. Similarly, we compared agespecific percentages of diabetes and pre-diabetes basedon the FBG and/or PBG obtained in time 2 using Pearson’s Chi-square test.The high prevalence of pre-diabetes at the initial survey prompted us to consider that anemia may have contributed to this surprising finding. To test whetherHbA1c over-diagnoses pre-diabetes and diabetes, wecompared the proportions of the two conditions at time1 with those determined by glucose tests taken at time 2(August – October 2015) using McNemar’s Chi-squaretest. In the majority of cases, FBG was used (n 117,84%), but in those instances where this was unavailable(n 23, 16%), PBG was used. We excluded one case whobegan treatment for diabetes between time 1 and time 2(Fig. 1).To further understand the influence of hemoglobin concentration on the level of HbA1c, we used McNemar’s testOf the 500 participants, 61% (303) were female and 39%(197) male. The median age of all participants was 50years (IQR 42–60 years). More than half of the participants (61.4%) had no formal schooling or no more than6 years of education. The median monthly income percapita was 1000 rupees (500–3000 rupees, n 400 dueto missing values for the number of people in the household). One person had missing information on HbA1c(Fig. 1). There was a similar number of people recruitedto each village (Additional file 1: Table S1).There were notable differences in most of the anthropometric measures between individuals who werenon-diabetic and those who were either pre-diabetic ordiabetic according to HbA1c. Kruskal Wallis tests (set at0.05 significance level) show that those with pre-diabetesor diabetes were progressively heavier, with greater BMI,waist and hip circumference, and waist-hip ratio (Additional file 2: Table S2).Prevalence of diabetes in rural GarhwalBased on HbA1c, the overall prevalence of diabetes was10% (95% CI 7.6–13%) and pre-diabetes 56.4% (95% CI52–60.7%). Prevalence of pre-diabetes and diabetes waslowest in the youngest age group (Table 1).There was a strong association between diabetes statusand age (χ2 13.3; p 0.01), but we were unable to detecta statistically significant association between gender andprevalence of pre-diabetes or diabetes (χ2 1.07; p 0.59).
Anderson et al. BMC Public Health(2019) 19:817Page 4 of 8Table 1 Diabetes status based on HbA1c at Time 1, accordingto age groupAge groupPrevalence (95% CI)NormalaPre-diabetesbDiabetesc0–44 years44.3 (36.7 to 52.2)48.7 (41.0 to 56.6)7.0 (3.9 to 12.2)45–59 years29.8 (23.8 to 36.4)58.0 (51.1 to 64.7)12.2 (8.3 to 17.5) 60 years27.2 (20.3 to 35.4)63.2 (54.7 to 70.9)9.6 (5.6 to 15.9)Values represent percentages of cases within each age group with 95%confidence intervals in parentheses; n 499; HbA1c is missing for one caseaNormal was defined as HbA1c 5.7% (n 168)bPre-diabetes was defined as 5.7% HbA1c 6.4% (n 282)cDiabetes was defined as HbA1c 6.5% (n 49)Glycosylated hemoglobin vs fasting blood glucose/postprandial blood glucoseAmong the 140 people we followed-up, we could detectno significant change in anthropometric variables between the times of measurement of HbA1c and FBG/PBG (Table 2). Of these 140 people, 124 (88.6%) werepre-diabetic according to HbA1c cut-offs compared to 56(40.0%) using FBG/PBG (Table 3). This corresponds to a48.6% greater percentage of pre-diabetes using HbA1cthan by FBG/PBG (95% CI: 39.3 to 57.7%) (McNemar’schi-square 66.1; p 0.001).There was no evidence that diabetes was overdiagnosed when HbA1c was used as the diagnostic criterion. The difference in proportions of diabetes assessedby HbA1c and FBG/PBG was 0.02 (95% CI: 0.07 to0.05; McNemar’s χ2 0.29; p 0.79).Hemoglobin, HbA1c and fasting blood glucoseIn both people with and without moderate to severeanemia, a much smaller proportion were diagnosed withpre-diabetes by FBG/PBG than HbA1c (Table 4). Thedifference between the two diagnostic criteria wasconsistent across the two categories of hemoglobinconcentration [no anemia or mild anemia: 0.48 (0.37–0.61); McNemar’s χ2 44.1; p 0.01; moderate to severe anemia: 0.48 (0.31–0.64), McNemar’s χ2 22; p 0.01]. Similarly, the proportions categorized by HbA1cand FBG/PBG as diabetic did not differ markedlyaccording to category of blood hemoglobin concentration (Table 4).DiscussionThe prevalence of both pre-diabetes and diabetes in ourstudy sample was generally much higher than otherstates of India and other South Asian countries [4, 19].We observed a large disparity between proportions ofthe sample diagnosed with pre-diabetes based on HbA1cand FBG/PBG. However, we were unable to detect a difference in the proportions of diabetics diagnosed by thetwo tests. It has been suggested that anemia can influence HbA1c levels, and thus the performance of thisdiagnostic test [14]. However, our data indicate that thediagnostic gap between pre-diabetes based on HbA1cand FBG/PBG is unlikely to be attributable to confounding by the high prevalence of anemia in the populationwe studied.Table 2 Age, anthropometric and biochemical characteristics of participants with HbA1c and glucose-based testTime 1aTime 2ap-value52 (18)NANAHbA1c (%)5.9 (5.8–6.2)NANAHeight, cm154.5 (149.5–161.3)bAs for Time 1NA55.0 (46.6–63.4)0.0622.3 (19.6–25.7)b0.08Age, yearsbWeight, kg56.0 (48.8–64.0)Body mass index, kg/m222.7 (19.8–25.7)cWaist, cm80.7 (70.0–89.6)81.3 (71.5–89.8)0.22Hip, cm93.0 (88.2–97.8)92.8 (88.0–97.5)0.24Waist-hip ratio0.87 (0.8–0.9)0.88 (0.8–0.9)0.79FBG, mg/dLNA104 (95–114)dNAPBG, mg/dLNA130 (111–152)eNAHemoglobin, g/dLNA11 (10–12)NAData show median of baseline characteristics with interquartile range in parenthesesn 140, excluding 18 subjects with normal HbA1c results (HbA1c 5.7%)p-values were based on Wilcoxon’s signed-rank testaDiagnostic test for diabetes at Time 1: HbA1c; at Time 2: FBG/PBG testbTime 1 Height & Weight; Time 2 BMI: n 139cTime 1 BMI: n 138dTime 2 FBG: n 117eTime 2 PBG: n 135BMI body mass index, HbA1c glycosylated hemoglobin, FBG fasting blood glucose, PBG post-prandial blood glucose, NA not applicable/available
Anderson et al. BMC Public Health(2019) 19:817Page 5 of 8Table 3 Diabetic status based on fasting blood glucose or postprandial glucose, among those diagnosed as pre-diabetic ordiabetic using HbA1cDiagnosisbased onFBG/PBGbDiagnosis based on HbA1caPre-diabetesDiabetesTotalNo Diabetes61 (49.2%)5 (31.2%)66Pre-diabetes55 (44.4%)1 (6.3%)56Diabetes8 (6.5%)10 (62.5%)18Total124 (100%)16 (100%)140Values are number of cases and column percentagesHbA1c glycosylated hemoglobin, FBG fasting blood glucose, PBG post-prandialblood glucoseaTested at time 1; pre-diabetes was defined as 5.7% HbA1c 6.4%; diabeteswas defined as HbA1c 6.5%bTested at time 2; pre-diabetes was defined as 100 mg/dL FBG 125 mg/dLor 140 mg/dL PBG 200 mg/dL; diabetes was defined as FBG 125 mg/dL orPBG 200 mg/dLIn the instances where FBG was not available, diagnosis was based on PBGProportions of diabetes and pre-diabetesOur findings indicate that HbA1c has comparable performance to FBG/PBG with regard to diagnosis of diabetes in this rural population. HbA1c and glucose testsboth detected very similar proportions of diabetes in thesample we studied. Our finding is consistent with thoseof two recent studies, one in an out-patient clinic inChina and another in a tertiary care setting in India [20,21]. However, substantial disparities between diagnosesbased on HbA1c and glucose-based tests have previouslybeen reported [4, 22–26]. In some cases HbA1c diagnosed much larger proportions of diabetes than did FBG[4, 23–25] while in other studies HbA1c diagnosedsmaller percentages of diabetes than did FBG [22, 26].These studies varied in settings ranging from generalcommunities as well as sea-level and high-altitude settings, covering various ethnic groups including Arabs,Asian-Americans, Native Hawaiians and Peruvians.Table 4 Diabetic status based on glycosylated hemoglobin andglucose-based tests, according to anemia statusNo/Mild Anemiaan 46HbA1cbFBG/PBGcNo Diabetes–Pre-diabetes39 (84.8%)Diabetes7 (15.2%)Moderate/Severe Anemiaan 94HbA1cbFBG/PBGc21 (45.7%)–45 (47.9%)17 (37.0%)85 (90.4%)39 (41.5%)8 (17.4%)9 (9.6%)10 (10.6%)Only cases with both HbA1c at Time 1 and FBG/PBG at Time 2 were includedin analysis; n 140, excluding 18 subjects with normal HbA1cresults (HbA1c 5.7%)aNo/mild anemia was defined as Hb 11.4 g/dL; moderate/severe anemia wasdefined as Hb 11.4 g/dLbPre-diabetes was defined as 5.7% HbA1c 6.4%; diabetes was defined asHbA1c 6.5%cPre-diabetes was defined as 100 mg/dL FBG 125 mg/dL or 140 mg/dL PBG 200 mg/dL; diabetes was defined as FBG 125 mg/dL orPBG 200 mg/dLIn the instances where FBG was not available, diagnosis was based onPBG (n 23)Given that there is evidence of HbA1c levels being associated with both genetic factors [11, 27, 28] and geographical settings [23] further investigation of HbA1cFBG relationship in rural mountainous regions arerequired.In contrast to the diagnosis of diabetes, 49% ofstudy subjects who were diagnosed with pre-diabetesbased on HbA1c were classified as normal by measurement of FBG/PBG. Our findings are consistentwith those of two recent studies which indicate considerable proportions of individuals who are prediabetic based on HbA1c criteria have normal FBG results [24, 25]. However, others found that smallerproportions of pre-diabetics were identified by HbA1cthan glucose-based methods [26, 29]. The divergenceis unlikely to reflect device measurement errors, giventhe evidence that the point-of-care device used in ourstudy has comparable performance to a laboratorybased HbA1c test [30, 31]. Despite the fact that FBGand OGTT have both been widely used as the goldstandards for diagnosing diabetes, there is still nouniform definition of pre-diabetes [32–35]. Markeddiscordance between pre-diabetes by HbA1c and FBG/PBG criteria in the present study therefore does notnecessarily imply false positives. In fact, there is someevidence that HbA1c and glucose-based diagnosesidentify different populations within the hyperglycemic category [27, 29]. Both tests may offer uniquelyimportant prognostic information.The presence of a large proportion of individuals diagnosed as having pre-diabetes based on HbA1c but withnormal glucose-based results may have important prognostic implications. HbA1c’s ability to predict major clinical complications such as cardiovascular disease is ofmajor prognostic significance [36–38]. For example,HbA1c levels were able to predict lipid profile, a key determinant of cardiovascular heart disease [37, 38]. Indeed, in a community-based study of non-diabetic,middle-aged adults in four U.S. communities, Selvin andcolleagues observed that elevated HbA1c ( 6%) wasstrongly associated with the risks of cardiovascular disease, all-cause mortality and ischemic stroke [38]. Theassociations remained strong and significant after adjusting for baseline FBG levels. Moreover, in individualswith stable coronary artery disease, HbA1c values of6.3% or greater were linked with adverse cardiovascularoutcomes [36]. There is also evidence that reducingHbA1c by 0.2% can lead to a 10% reduction in risk ofmortality within 12 months [37]. Whether the increasedrisk of cardiovascular diseases associated with elevatedHbA1c is due to pre-diabetic conditions or the subsequent development of diabetes remains unclear [39, 40].However, the additional clinical information provided bya measurement of HbA1c in the pre-diabetic range may
Anderson et al. BMC Public Health(2019) 19:817render HbA1c a more cost-effective option than FBG orOGTT, particularly in areas where comprehensive medical tests are less accessible and populations are morepredisposed to cardiovascular diseases. Further researchon this subject should be pursued in order that this additional prognostic benefit can be fully realized.Another possible prognostic implication of prediabetes diagnosed by HbA1c but not FBG/PBG lies inthe prediction of progression to diabetes. In a systematicreview of studies investigating the performance of HbA1cin predicting progression to diabetes among adults aged18 years and over, Zhang and colleagues observed thatHbA1c 6.0% was associated with a very high risk ofsubsequent development of diabetes [41]. Pre-diabetesidentified by fasting glucose and oral glucose tolerancetests, on the contrary, had limited ability to predict progression to diabetes [42]. On the other hand, othersfound similar rates of progression to diabetes in thoseidentified as pre-diabetic by a single FPG test comparedto a HbA1c test [43, 44]. Regardless, our current findingsindicate that the prevalence of pre-diabetes in ruralGarhwal is much higher than the national rural prevalence [4]. Given that timely lifestyle changes can be effective in preventing or delaying progression to diabetes[33], the advantages of using HbA1c for mass screeningof pre-diabetes in low-income rural areas may outweighits disadvantages in the long run.Association with hemoglobinConsumptive anemia can confound the relationship between HbA1c level and glycemic control [14, 45]. Thus,it could potentially account for the observed differencein diagnoses of pre-diabetes by HbA1c and FBG. However, we found that both the pattern and magnitude ofdifferences in the proportions of pre-diabetes and diabetes diagnosed by HbA1c compared with FBG/PBG,were independent of anemia status. There is prior evidence of substantial changes in HbA1c levels in the presence of anemia [14, 15]. In a recent systematic review ofthe effects of anemia and abnormalities of erythrocyteindices on HbA1c, the authors suggested that iron deficiency, and particularly iron deficiency anemia, may leadto an increase in HbA1c [14]. In addition, relatively larger divergence was found between diagnoses of prediabetes and diabetes based on HbA1c and OGTT, in asubgroup of young anemic adults who were deficient iniron, B12 and folic acid, when compared to a referencegroup [15]. The association between HbA1c andhemoglobin concentration was also found to vary according to the forms of anemia. While iron deficiencyanemia was associated with elevated HbA1c [15], someforms of anemia were found to be linked with diminished HbA1c level. A typical example is hemolyticanemia, in which the lifespan of erythrocytes isPage 6 of 8shortened, causing a drop in HbA1c [14]. Other conditions which may decrease levels of HbA1c include acutehemorrhage and hemoglobinopathies [46]. However, sofar there is no consistent evidence regarding the influence of anemia and hemolytic disorders on HbA1c.LimitationsBecause of the difference in timing between HbA1c andFBG tests, caution should be applied in the interpretation of these data. Participants were told their level ofHbA1c immediately after the test. Thus, some of the disparity between diagnosis of pre-diabetes by HbA1c andFBG/PBG may be due to altered behavior between thetwo time points. However, lifestyle changes, if any, wereunlikely to have contributed to the large disparity, giventhe minor differences in weight, body mass index andwaist-hip ratio between time 1 and time 2. Furthermore,because we did not follow-up people who were categorized as having a normal HbA1c at baseline, we will havemissed detecting anyone who was negative for diabetesand pre-diabetes at the first assessment, but who werethen positive using the glucose-based definition. Thismay mean that the differences that we observed areoverestimated. We also acknowledge that our conclusions may not be generalizable across the whole regionof Tehri-Garhwal because only five villages were surveyed. However, our findings provide preliminary evidence for a particularly high prevalence of diabetes andpoor glycemic control in the sub-Himalayan region.They therefore provide the impetus for larger studies, including sampling of participants in a manner that represents the wider population of the region, to fullycharacterize the prevalence of diabetes in mountainousareas of North India.ConclusionsOur study is one of the few in which HbA1c has beenutilized to diagnose diabetes in the mountainous ruralcommunities in North India. The remarkably highprevalence of diabetes and pre-diabetes indicates theneed for more in-depth research, including identificationof the underlying determinants of diabetes and prediabetes in this region. More region-specific studies areneeded in North India, especially where poverty and ethnic diversity are more pronounced. In view of themarked disparity in diagnosis of pre-diabetes betweenHbA1c and FBG, health-care professionals should bewell-informed of the complex determinants of HbA1c tomaximize the benefits of the HbA1c test. From a policyperspective, there is a pressing need for advocacy of effective, tailor-made public health initiatives to preventand respond to this imminent diabetes crisis in the ruralmountainous regions of North India.
Anderson et al. BMC Public Health(2019) 19:817Additional filesAdditional file 1 Table S1. Distribution of participants according tovillage. (DOCX 14 kb)Additional file 2 Table S2. Age, anthropometric and biochemicalcharacteristics of participants at baseline, according to diabetes status asmeasured by HbA1c. (DOCX 18 kb)AbbreviationsASHAs: Accredited Social Health Activists; BMI: Body mass index; FBG: Fastingblood glucose; HbA1c: Glycosylated hemoglobin; OGTT: Oral glucosetolerance test; PBG: Post-prandial blood glucoseAcknowledgementsThe authors would like to acknowledge the participation of the villagers inthe region.Authors’ contributionsPA analysed and interpreted data, and drafted manuscript. NG contributedto the design and concept, interpreted the data, and reviewed and editedmanuscript. RS (Rajesh) contributed to the study design and training of staff,reviewed and edited manuscript. RS (Rajkumari) contributed to the trainingof staff, reviewed and edited manuscript. RGE contributed to the design andmethods, interpreted the data, and reviewed and edited manuscript. PScontributed to the training of staff, reviewed and edited manuscript. AGTdeveloped the concept of the research, designed this study, interpreted thedata, and reviewed and edited manuscript. All authors have read andapproved the manuscript.FundingThis research was supported by funding from Monash University. AGT wassupported by a National Health & Medical Research Council fellowship (grantno. 1042600). The funding bodies had no role in the design of the study, incollection, analysis, and interpretation of data, nor in writing the manuscript.Availability of data and materialsThe datasets generated and/or analysed during the current study are notpublicly available because these are small communities and publication ofsuch data would compromise anonymity. However, a limited dataset,without age and other potentially identifying information, is available fromthe corresponding author on reasonable request.Page 7 of 82.3.4.5.6.7.8.9.10.11.12.13.14.15.16.17.Ethics approval and consent to participateEthics approval was obtained from the Garhwal Community Developmentand Welfare Society. Written informed consent was obtained from eachparticipant before any data were collected.18.19.Consent for publicationNot applicable.20.Competing interestsThe authors declare that they have no competing interests.21.Author
Analyzer (Alere, Oslo; Fig. 1). Staff from Chamba Hospital and a trained nurse were in the field to ensure clinical markers were properly measured. Follow-up (time 2) Approximately 3months after the initial survey, a subset of individuals with diabetes or pre-diabetes were followed up with tests of fasting blood glucose and/or