Transcription
THE 10TH ANNUALAP Reportto the NationSTATE SUPPLEMENTFEBRUARY 11, 2014Vermont
T H E 1 0 T H A N N U A L A P R E P O RT T O T H E N AT I O N · V E R M O N T S U P P L E M E N TTable of Contents3State Strategies6Fostering AP Participation and Success8A Closer Look at Equity Gaps in AP Participation and SuccessAbout This ReportThis report provides educators and policymakers with informationthey can use to celebrate their successes, understand their uniquechallenges, and set meaningful goals to increase opportunity for allstudents. It’s important to note that while AP Exams are validmeasures of students’ content mastery of college-level studies inspecific academic disciplines, AP results should never be used asthe sole measure for gauging educational excellence and equity.Because reliable demographic data for nonpublic schools are notavailable for all states, this report represents public school studentsonly. Additionally, this report looks at students’ entire experiencewith AP — tracking exams taken by graduates throughout their highschool careers — as opposed to reporting exam results from aparticular calendar year.Additional data are available at apreport.collegeboard.org.Note: Throughout this report, public high school graduates represent projectionssupplied in Knocking at the College Door (Western Interstate Commission forHigher Education, 2012).2The redesigned courses, Biology, Latin, and Spanish Literature and Culture,began in fall 2012, and the first AP Exam based on those redesigned courseswas administered in May 2013. As a result, the data in this report reflect a blendof the old and redesigned exam results.
T H E 1 0 T H A N N U A L A P R E P O RT T O T H E N AT I O N · V E R M O N T S U P P L E M E N TS TAT E S T R AT E G I E SVermont has made progress in recent years in improving student accessand supporting student performance in AP . Just as we do in the nationalreport, we wanted to take an opportunity to applaud your efforts and offeradditional strategies for your consideration.Current PictureCongratulations. You are already using these strategies to build arobust AP Program. You:Celebrate the 4 districts that have earned a spot on the 4thannual AP District Honor Roll through their hard work anddedication to increasing participation and success in AP,particularly for underrepresented students.See page 5 for more details.Encourage your educators to participate in the developmentof the AP Program, such as by becoming AP Exam Readers orparticipating in AP course and exam development committees.See page 5 for more details.3
T H E 1 0 T H A N N U A L A P R E P O RT T O T H E N AT I O N · V E R M O N T S U P P L E M E N TS TAT E S T R AT E G I E SOpportunitiesThe following strategies have been proven effective. To build aneven stronger AP program, you could: Develop policies that allow AP course work and exam scores forsophomores and juniors to substitute for statewide graduationrequirements and/or end-of-course assessments. Fund professional development for teachers in underservedareas of the state. Provide targeted assistance and resources to schools servingtraditionally underserved populations and regions. For example,funding for materials, supplies, outreach efforts, and tutoringprograms. Invest in resources for schools and districts to supportresearch-based programs that build content knowledge andskills — particularly in literacy and math — to prepare students forsuccess in AP course work, and in college and careers. Create opportunities for other schools and districts to learn fromyour AP Honor Roll winners. Ensure that public colleges and universities develop AP Examcredit and placement policies based on institutional goals,alignment with corresponding courses, and objective outcomesresearch. Promote online opportunities for students to participate in APthrough the Vermont Virtual Learning Cooperative. Include AP in the state accountability system. Establish AP participation and performance indicators. Set clear, measurable statewide goals toward improvement. Maximize the use of AP Potential to identify students whomay not be identified by traditional methods for AP courses(targeting AP STEM) through the PSAT/NMSQT .4
T H E 1 0 T H A N N U A L A P R E P O RT T O T H E N AT I O N · V E R M O N T S U P P L E M E N TS TAT E S T R AT E G I E SHighlightsThe following information dives a little deeper into the details ofyour efforts.Participation in the Development of AP2013 Reading participants — Total: 42Vermont represents 0.4% of all Readers AP High School Teachers: 24 College and University Faculty: 182013 AP Professional Development Leaders — Total: 42013 AP Development Committee Members — Total: 2European HistoryEnvironmental ScienceUniversity of VermontUniversity of VermontThe AP Honor RollThe AP Honor Roll recognizes and honors those outstandingschool districts that simultaneously increase access to AdvancedPlacement course work while increasing the percentage ofstudents earning scores of 3 or higher on AP Exams. Achievingboth of these goals is the ideal scenario for a district’s APprogram because it indicates that the district is successfullyidentifying motivated, academically prepared students who arelikely to benefit most from rigorous AP course work.4th Annual Honor Roll Districts in Vermont: 4Harwood Union Middle/High School*Montpelier School District 45Vergennes Union High SchoolWoodstock Union High School and Middle School* District has achieved the honor for multiple years.5
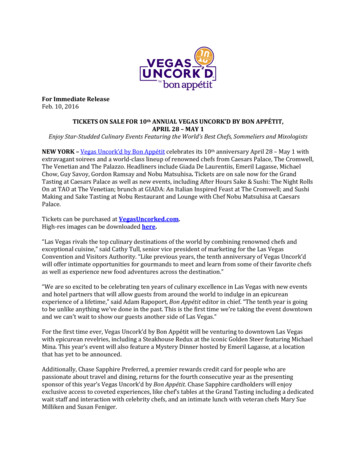
T H E 1 0 T H A N N U A L A P R E P O RT T O T H E N AT I O N · V E R M O N T S U P P L E M E N TF O S T E R I N G A P PA R T I C I PAT I O N A N D S U C C E S SFIGURE 1Growth in AP Participation and SuccessMore graduatesNumber of graduates leaving high school having taken an AP ExamNumber of graduates scoring 3 on an AP Exam during high 1220132003FIGURE 2Participation in and Success on AP Exams in the Class of 2013Percentage of graduates leaving high school having taken an AP ExamPercentage of graduates scoring 3 on an AP Exam during high schoolArts30%1.3%16.6%EnglishEnglish Language and Composition, andEnglish Literature and Composition11.6%Comparative Government and Politics, European History,Human Geography, Macroeconomics, Microeconomics,Psychology, United States Government and Politics,United States History, and World History15.7%History andSocial Sciences10.3%13.8%Calculus AB, Calculus BC, Computer Science A,and Statistics9.2%13.9%SciencesBiology, Chemistry, Environmental Science, Physics B, Physics C: Electricity and Magnetism, and Physics C: Mechanics8.7%WorldLanguagesAnyDiscipline60%Art History, Music Theory, Studio Art: Drawing,Studio Art: 2-D Design, and Studio Art: 3-D Design0.9%Mathematics andComputer ScienceEnglishhad the greatest number of studentsachieving a score of 3 or higherPercentage of Vermont Graduating Class0%Chinese Language and Culture, French Language andCulture, German Language and Culture, Italian Languageand Culture*, Japanese Language and Culture, Latin,Spanish Language, and Spanish Literature and Culture3.1%2.0%30.8%* AP Italian Language and Culture was discontinuedafter the 2008-09 school year, and was reinstated in2011-12.21.4%Total Number of Graduates: 6,6046are succeeding on AP Exams today thantook them in 2003
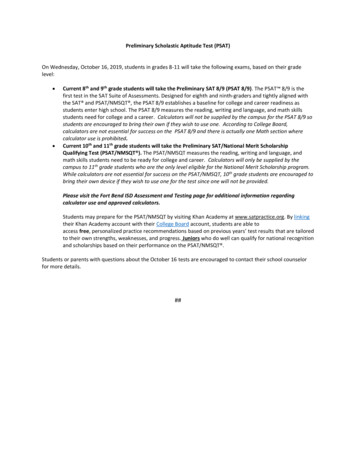
T H E 1 0 T H A N N U A L A P R E P O RT T O T H E N AT I O N · V E R M O N T S U P P L E M E N TF O S T E R I N G A P PA R T I C I PAT I O N A N D S U C C E S SFIGURE 3Score Distributions of AP Exams Taken by the Class of 2013 During High SchoolTen Most Popular AP ExamsRankSubjectNo. of Exams% of Exam Scores 100%Physics C: Electricity and Magnetism980%60%40%20%Music Theory214.8 9.53315.2Calculus BC95Microeconomics5083English Language and Composition5447United States Government and Politics2758.418.2World History1436.320.336.4English Literature and Composition81426.336.44Biology5252Calculus AB635Studio Art: 2-D Design20European History1385United States s B18021.117.86Statistics3178Chemistry262Comparative Government and Politics1416.111810418.326.9Art History1118.227.3Physics C: Mechanics77Studio Art: 3-D Design5Chinese Language and Culture2German Language and Culture3Human Geography4Italian Language and Culture*0Japanese Language and Culture0Latin0Spanish Literature and Culture022.027.3 Due to rounding, percentages do not always add up to 100.0.* AP Italian Language and Culture was discontinued after the 2008-09 school year, and was reinstated in 2011-12.Subjects with fewer than five AP Exam takers were omitted from this figure.60.022.0 11.618.721.521.516.7 11.133.319.230.619.822.918.225.0 5.020.3 5.828.228.6 7.1Spanish Language22.837.724.3Environmental Science25.3 11.435.030.2 10.714.322.1 10.718.415.21026.6 .224.413.725.914.825.922.321.037.225.616.3 8.221.79.360%14.36.3 9.54.040%22.211.1 11.1Computer Science AFrench Language and Culture20%Studio Art: Drawing170%9.814.528.617.8 11.930.8 10.613.545.5 9.124.716.940.013.00.0100%
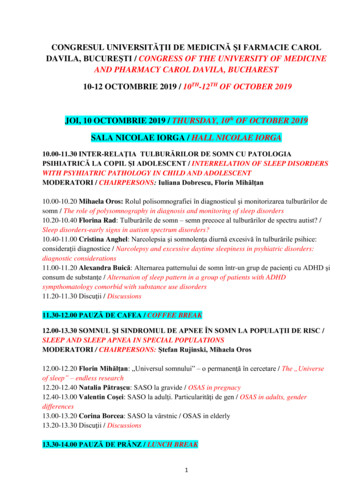
T H E 1 0 T H A N N U A L A P R E P O RT T O T H E N AT I O N · V E R M O N T S U P P L E M E N TA C L O S E R L O O K AT E Q U I T Y G A P S I N A P PA R T I C I PAT I O N A N D S U C C E S SLow IncomeFIGURE 4Trends in AP Exam Participation and Success471The percentage or number of . K–12 students eligible for free or reduced-price lunch* graduates leaving high school having taken an AP Exam who are from low-income backgrounds graduates scoring 3 on an AP Exam during high school who are from low-income backgroundsAP Exams were taken by low-incomegraduates in the class of 612190%P E R C E N TA G E O F S P E C I F I C P O P U L AT I O 52008G R A D U AT I N G C L A S S8201120122013* Estimates reflect the percentage of K–12 public schoolstudents eligible for free or reduced-price lunch.SOURCE: U.S. Department of Education, National Centerfor Education Statistics, Digest of Education Statistics:2008 (Table 42), 2009 (Table 42), 2010 (Table 44), 2011(Table 45), and 2012 (Table 46).** The numbers of students in the graduating classeswho are eligible for free or reduced-price lunch are notavailable.
T H E 1 0 T H A N N U A L A P R E P O RT T O T H E N AT I O N · V E R M O N T S U P P L E M E N TA C L O S E R L O O K AT E Q U I T Y G A P S I N A P PA R T I C I PAT I O N A N D S U C C E S SBlack/African AmericanFIGURE 5Trends in AP Exam Participation and Success22The percentage or number of . students in the graduating class graduates leaving high school having taken an AP Exam graduates scoring 3 on an AP Exam during high school. who are black/African Americanblack/African American graduates in theclass of 2013 took an AP Exam duringhigh 90%P E R C E N TA G E O F S P E C I F I C P O P U L AT I O .7%1.1%0.7%2.3%1.1%0.6%0%20032008G R A D U AT I N G C L A S S920122013
T H E 1 0 T H A N N U A L A P R E P O RT T O T H E N AT I O N · V E R M O N T S U P P L E M E N TA C L O S E R L O O K AT E Q U I T Y G A P S I N A P PA R T I C I PAT I O N A N D S U C C E S SHispanic/LatinoFIGURE 6Trends in AP Exam Participation and Success29The percentage or number of . students in the graduating class graduates leaving high school having taken an AP Exam graduates scoring 3 on an AP Exam during high school. who are Hispanic/LatinoHispanic/Latino graduates in theclass of 2013 took an AP Examduring high %P E R C E N TA G E O F S P E C I F I C P O P U L AT I O .2%1.2%0.7%1.6%1.4%1.1%0%20032008G R A D U AT I N G C L A S S1020122013
T H E 1 0 T H A N N U A L A P R E P O RT T O T H E N AT I O N · V E R M O N T S U P P L E M E N TA C L O S E R L O O K AT E Q U I T Y G A P S I N A P PA R T I C I PAT I O N A N D S U C C E S SAmerican Indian/Alaska NativeFIGURE 7Trends in AP Exam Participation and Success9The percentage or number of . students in the graduating class graduates leaving high school having taken an AP Exam graduates scoring 3 on an AP Exam during high school. who are American Indian/Alaska NativeAmerican Indian/Alaska Nativegraduates in the class of 2013 took anAP Exam during high school100%20032008201220134347231537119*36390%P E R C E N TA G E O F S P E C I F I C P O P U L AT I O .5%0.4%0.3%0.4%0.2%0.2%0%20032008G R A D U AT I N G C L A S S1120122013* Success data omitted when fewer than five graduatestook an AP Exam.
T H E 1 0 T H A N N U A L A P R E P O RT T O T H E N AT I O N · V E R M O N T S U P P L E M E N TA C L O S E R L O O K AT E Q U I T Y G A P S I N A P PA R T I C I PAT I O N A N D S U C C E S SAsian/Asian American/Pacific IslanderFIGURE 8Trends in AP Exam Participation and Success85The percentage or number of . students in the graduating class graduates leaving high school having taken an AP Exam graduates scoring 3 on an AP Exam during high school. who are Asian/Asian American/Pacific IslanderAsian/Asian American/Pacific Islandergraduates in the class of 2013 took anAP Exam during high 06190%P E R C E N TA G E O F S P E C I F I C P O P U L AT I O .2%3.7%1.8%4.3%4.2%2.0%0%20032008G R A D U AT I N G C L A S S1220122013
T H E 1 0 T H A N N U A L A P R E P O RT T O T H E N AT I O N · V E R M O N T S U P P L E M E N TA C L O S E R L O O K AT E Q U I T Y G A P S I N A P PA R T I C I PAT I O N A N D S U C C E S SWhiteFIGURE 9Trends in AP Exam Participation and Success1,850The percentage or number of . students in the graduating class graduates leaving high school having taken an AP Exam graduates scoring 3 on an AP Exam during high school. who are whitewhite graduates in the class of 2013took an AP Exam during high ,1275,8911,2721,8871,9481,8508801,2801,2891,295P E R C E N TA G E O F S P E C I F I C P O P U L AT I O N80%70%60%50%40%30%20%10%0%20032008G R A D U AT I N G C L A S S1320122013
A BOU T T H E C O L LEG E B O A R DThe College Board is a mission-driven not-for-profitorganization that connects students to college successand opportunity. Founded in 1900, the College Boardwas created to expand access to higher education.Today, the membership association is made up of over6,000 of the world’s leading educational institutionsand is dedicated to promoting excellence and equity ineducation. Each year, the College Board helps morethan seven million students prepare for a successfultransition to college through programs and services incollege readiness and college success — includingthe SAT , and the Advanced Placement Program . The organization also serves the education community throughresearch and advocacy on behalf of students, educators,and schools.For further information, visit www.collegeboard.org. 2014 The College Board. College Board, Advanced Placement, AdvancedPlacement Program, AP, SAT and the acorn logo are registered trademarks ofthe College Board. AP Potential is a trademark owned by the College Board.PSAT/NMSQT is a registered trademark of the College Board and NationalMerit Scholarship Corporation. All other products and services may betrademarks of their respective owners. Visit the College Board on the 14
THE 10TH ANNUAL AP REPRT T THE NATIN VERMNT SUPPLEMENT STATE STRATEGIES The following strategies have been proven effective. To build an even stronger AP program, you could: Develop policies that allow AP course work and exam scores for sophomores and juniors to substitute for statewide graduation requirements and/or end-of-course assessments.