Transcription
Indian Journal of 66-9ORIGINAL ARTICLEComputer‑Assisted Surgery Enables Beginner Surgeons, Under ExpertGuidance, to Achieve Long‑Term Clinical Results not Inferior to Thoseof a Skilled Surgeon in Knee ArthroplastyRicardo Larrainzar‑Garijo1,2 · Elisa M. Molanes‑López3 · Miguel Cañones‑Martín1 · David Murillo‑Vizuete1 ·Natalia Valencia‑Santos2 · Raul Garcia‑Bogalo1 · Fernando Corella‑Montoya1,2Received: 29 January 2022 / Accepted: 23 May 2022 The Author(s) 2022AbstractPurpose The purpose of this study is to determine whether the use of a surgical navigation system in total knee replacement (TKR) enables beginner and intermediate surgeons to achieve clinical PROM outcomes as good as those conductedby expert surgeons in the long term.Methods We enrolled 100 consecutive patients whose total navigated knee arthroplasty (TKA) was performed in our institution from 2008 to 2010. According to the principal surgeon's surgical experience, the patients were divided into three groups:(1) beginner surgeons, with no more than 30 previous knee replacement performances, (2) intermediate surgeons, with morethan 30 but not more than 300, and (3) expert surgeons, with more than 300 knee replacements. Demographic data collectedon the cohort included gender, laterality, age, and body mass index (BMI). The outcome measures assessed were ForgottenJoint Score (FJS), implant positioning, limb alignment, and prosthesis survival rate. A margin of equivalence of 18.5 pointsin the FJS scale was prespecified in terms of the minimal clinically important difference (MCID) to compare the FJS resultsobtained in the long period between the groups of interest.Results The mean follow-up was 11.10 0.78, 10.86 0.66, and 11.30 0.74 years, respectively, for each of the groups. Thelong-term FJS mean score was 80.86 21.88, 81.36 23.87, and 90.48 14.65 for each group. The statistical analysis provednoninferiority and equivalence in terms of the FJS results reported in the long term by patients in Groups 1 or 2 comparedto those in Group 3. More specifically, it has been proved that the mean difference between groups is within the interval ofequivalence defined in terms of the MCID. The overall prostheses survival rate was 93.7%.Conclusion Navigated assisted TKA, under expert guidance, can be as effective when performed by beginner or intermediate surgeons as performed by senior surgeons regarding the accuracy of implant positioning, limb alignment, and long-termclinical outcome.Keywords Knee prosthesis · Arthroplasty · Replacement · Knee · Computer-assisted · Kinematic · Femorotibial mechanicalangle · Dynamic alignmentIntroduction* Ricardo .orgFernando edic and Trauma Department, Hospital UniversitarioInfanta Leonor, C/ Gran Via Este 80, 28031 Madrid, Spain2Departamento Cirugía, Facultad de Medicina, UniversidadComplutense Madrid, Madrid, Spain3Unidad Departamental de BioestadísticaDepartamento deEstadística e Investigación Operativa, Facultad de Medicina,Universidad Complutense Madrid, Madrid, SpainIn any human activity requiring learning, repetitionimproves results, especially in manual activities. Surgery isa clear example of this situation. Therefore, we assume thata surgical learning curve is always present and that surgicalexpertise can only be achieved after many years of clinicalpractice [1–4].Computer-assisted navigated knee replacement providessurgeons with quantitative measurement tools for real-timeassessing lower limb alignment and kinematics [5, 6]. It isa powerful instrument for intraoperatively supporting and13Vol.:(0123456789)
Indian Journal of Orthopaedicsguiding the surgeon in the adequate postoperative soft tissuebalance of the knee [7–10].Patient-reported outcome measures (PROMs) are standardized, validated questionnaires completed by patients tomeasure their perception of their functional well-being andhealth status. No single instrument has established itself asthe 'gold standard' for measuring patient status. Each toolmeasures different dimensions of health, uses different scoring levels, and references different periods [11]. The Forgotten Joint Scores (FJS) comprise measures for assessingjoint-specific patient-reported outcomes [12]. These PROquestionnaires focus on patients' awareness of a specificjoint in everyday life and pick up subtle differences betweenpatients and follow-up time points.This study aims to determine if the use of a surgical navigation system enables beginner and intermediate surgeons toachieve long-term clinical PROM outcomes and postoperative implant positioning and limb alignment as good as thoseperformed by an expert surgeon. We conducted a retrospective cohort study design based on a consecutive case seriesfocused on the alternative hypothesis that the long-term FJSachieved by surgeons with less surgical experience is noninferior by a prespecified amount conducted by a skilledsurgeon in navigated assisted total knee replacement. Morespecifically, the null hypothesis of inferiority specifies thatthe FJS between a less experienced surgeon and a skilledone is worse by at least a prespecified acceptable marginof 18.5 points, corresponding to the average of the smallestand largest minimal clinically important difference (MCID)estimates given by Ingelsrud et al. [13].The main objective is to assess the long-term FJS resultby comparing three surgeon's knowledge outlines: (1) nomore than 30 previous knee replacement performances, (2)between 31 and 300, and (3) more than 300 knee replacements. Secondary objectives are to assess the postoperativeHip Knee Ankle Angle, implant position, and survival ratebetween the groups.Materials and MethodsWe enrolled in this study 100 consecutive patients in whichnavigated total knee arthroplasty (TKA) was performed inour institution from 2008 to 2010. Seventeen patients haddied during the follow-up period until 12/31/2020. Theinclusion criteria were patients with primary osteoarthriticknee joints and receiving a posterior stabilized total kneereplacement (Columbus, BBraun Aesculap) due to substantial pain and loss of functionality with any degree of deformity. Of the 83 living patients, five were excluded due theyhad prostheses revision surgery. We could not contact fourother patients by phone or mail, resulting in a final sampleof 74 patients (Fig. 1).13Fig. 1 Patient flow diagram. TKA total knee arthroplastyAll patients provided written informed consent, and theHospital Committee for Medical and Health Research Ethics approved the study. (Hospital General UniversitarioGregorio Marañón. Madrid. Spain. Protocol 1-04. V-02).All procedures performed followed the 1964 Declaration ofHelsinki and its later amendments.It is estimated that prosthetic knee surgeons must performabout 30 procedures a year to maintain their skills [14]. We,therefore, grouped surgeons into those who had not evenreached the first thirty prostheses, those who had between31 and 300, and more experienced surgeons with more than300 implanted prostheses at the beginning of the study.According to the principal surgeon's surgical experience,the patients were divided into three groups: (1) no more than30 previous knee replacement performances, (2) between 31and 300, and (3) more than 300 knee replacements. A totalof 14 surgeons were involved in the study.Demographic data collected on the cohort included gender, laterality, age, and body mass index (BMI).Baseline characteristics of the study population arereported in Table 1.Surgical TechniqueThe surgical procedure was performed following a navigated gap-balancing technique (Columbus PS. Orthopilotversion 4.2; Braun Aesculap, Tuttlingen, Germany) in aregular fashion [5, 9]. A distal femoral cut was planned at90 sagittal and coronal plane to the hip center. The tibialcut was planned at 90 coronal and 2 posterior slope sagittalto the ankle center. Femoral and tibial components were allcemented, and no patella was replaced.Outcome MeasuresImplant Positioning and Limb AlignmentThe navigation system assessed the coronal and sagittalHKAA (Hip Knee Ankle Angle) at the surgical procedure’sbeginning and end once the cementation process was completed and the tourniquet was deflated. The joint orientation
Indian Journal of OrthopaedicsTable 1 Study populationbaselinePatients characteristicsGroup 1n 22Group 2n 37Group 3n 15GlobalN 74p valueFemale: n (%)Male: n (%)Right knee: n (%)Left knee: n (%)Agea (years): mean SDBMI (kg/m2): mean SD14 (63.6)8 (36.4)12 (54.5)10 (45.5)69.91 8.6731.64 3.5930 (81.1)7 (18.9)24 (64.9)13 (25.1)72.00 4.8033.17 4.5911 (73.3)4 (27.7)5 (33.3)10 (66.7)69.40 7.4834.39 5.4055 (74.3)19 (25.7)41 (55.4)33 (44.6)70.85 6.7132.96 4.54n.s.n.s.n.s.n.s.n.s.n.s.n.s. no significantaPatient age at the moment of the knee replacementangles in the frontal and sagittal planes were evaluatedaccording to Paley [15].Femoral and tibial component position, joint line height,and gaps at 0 and 90 were calculated after all bone cutswere done. The navigation system referenced to the preoperative posterior condyle axis measured the final femoralimplant rotation.Knee BalancingTo allow comparison of final knee balance between the threegroups of surgeons, the authors classified the relationshipbetween the medial and lateral gap, both in extension andflexion.According to the most restrictive criterion, a knee is adequately balanced when there is no more than 2 mm difference in any of the four gap measurements (Flexion MedialGap, Extension Medial Gap, Flexion Lateral Gap, Extension Lateral Gap). Two less restrictive criteria were definedsimilarly, considering three and four millimeters difference.Any value greater than five was regarded as inadequate kneebalance.Forgotten Joint ScoreAll eligible patients were asked to complete the FJS questionnaire at the end of the follow-up period. The FJS wasassessed by the same author (NVS). The FJS is used toevaluate patients' ability to forget their artificial joints indaily life. It consists of 12 questions, and the score rangesfrom 0 to 100. The higher the score, the more favorable theoutcome. The score was calculated under the original publication [12].Survival RateProsthetic failure is defined as any clinical circumstance thatremoves the prosthesis, either due to aseptic loosening orprosthetic infection. All patients were evaluated until theend of the follow-up period:12/31/2020.Statistical AnalysisTraditional tests for differences were used to comparepatients’ baseline characteristics, postoperative implant positioning, and limb alignment. For quantitative variables, oneway ANOVA was used under the assumption of Normality.For non-normally distributed data, the Kruskal–Wallis testwas used instead. The premise of Normality was checkedusing the Shapiro–Wilk test.For the primary quantitative outcome, one-sided testswere used to test for noninferiority between each group ofless experienced surgeons and the group of more skilledsurgeons. Due to the non-normality of the FJS values, theseone-sided tests were based on a robust version of the twosample Student t test that uses trimmed summary statistics,allowing for heterogeneity and deviations from Normality(the Yuen–Welch t test with a 5% trimming at both ends ofthe data). Given that there are two comparisons of interest (Group 1 versus Group 3 and Group 2 versus Group 3),Holm's sequential Bonferroni (HB) correction was used tocontrol the family-wise error rate at the prespecified significance alpha level [16].The HB method is a less conservative approach than theBonferroni method that compares the k-ranked p value to thenominal significance level divided by (n k 1), whereinin this case, n 2 (the number of comparisons of interest)and k 1, 2.The FJS-12 has a minimally clinically significant difference (MCID) of 14–23 points, as estimated by Ingelsrudet al. [13] Based on the average of these two most extremeMCID estimates, we define the interval of equivalence forthe difference of FJS mean scores to be in the range from 18.5 to 18.5 points; that is, the margin of noninferiorityis given by delta 18.5. For the interval of equivalencepreviously defined and the nominal alpha level of 5%, 15patients are required per group to prove the equivalencebetween groups of less experienced surgeons and the groupof more skilled surgeons, with a statistical power of 80%.This sample size was calculated assuming an expected population standard deviation of 16.72 on the FJS-12 scale.13
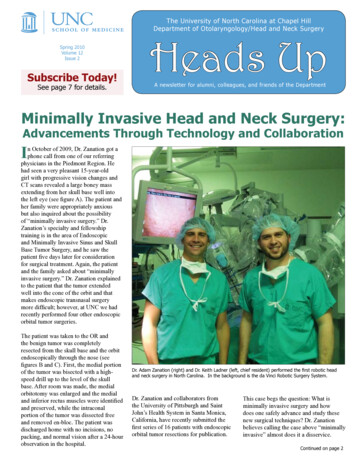
Indian Journal of OrthopaedicsFinally, Kaplan–Meier curves were obtained to describethe survival of the prostheses, according to the principalsurgeon's surgical experience.The analyses were carried out using two statistical packages: SPPS version 25 and R version 4.0.4. A significancealpha level of 0.05 was set for all statistical tests.ResultsLimb AlignmentNo statistically significant differences between the groupswere demonstrated in the preoperative coronal and sagittal HKAA, making them comparable. There were nostatistically significant differences in comparing postoperative coronal and sagittal HKAA between the groups.Table 2 describes the preoperative and postoperativecoronal and sagittal KHAA between the three groupsglobally.Figure 2 graphically expresses, through a boxplot, thehomogeneity in the coronal and sagittal alignment (greencolor) between the different surgical experience groups.It can be seen that all the surgeons achieved close to neutral alignment in the coronal plane. At the same time, theHKAA was lightly recurvatum in the sagittal plane, especially between the most experienced surgeons, despite nostatistically significant differences.There was no outlier value in the coronal and sagittalpostoperative alignment in any group.Table 2 Comparison of preoperative and postoperative coronal and sagittal KHAA between the three different groupsLimb alignmentGroup 1n 22Preoperative coronal HKAA 175.77 5.98 (173.12;178.43)175.50 (172, 178)Preoperative sagittal HKAA 177.32 7.11 (174.16;180.47)177.50 (176, 180)Postoperative coronal180.32 1.49 (179.66;HKAA180.98)180 (179, 182)Postoperative sagittal181.95 3.33 (180.48;HKAA183.43)181.5 (180, 185)Group 2n 37Group 3n 15GlobalN 74174.62 5.92 (172.65;176.60)175.00 (172, 176)178.27 6.95 (175.95;180.59)180.00 (175, 182)180.27 1.47 (179.78;180.76)180 (179, 181)183.81 2.93 (182.83;184.79)184 (182, 186)175.00 5.96 (171.70;178.30)175.00 (171, 177.5)177.53 6.46 (173.96;181.11)177.00 (173.5, 182)179.93 1.22 (179.26;180.61)180 (179, 181)183.93 3.26 (182.13;185.74)183 (181.5, 186.5)175.04 5.89 (173.68;176.40)175.00 (172, 178)177.84 6.82 (176.26;179.42)178.00 (175, 182)180.22 1.42 (179.89;180.54)180 (179, 181)183.28 3.20 (182.54;184.02)183 (181, 185)Summary statistics are: mean SD, (95% CI) and median (Q1, Q3). There were no statistically significant differences in the comparison of postoperative coronal and sagittal HKAA between the groupsFig. 2 Coronal and sagittal alignment. The horizontal line in the boxrepresents the median value. The height of the box is the interquartilerange, Q1–Q3, i.e., where the central 50% of the most representativevalues are found. The vertical outbox lines represent the minimum13and maximum of the non-outliers; when a value deviates from the topor bottom of the box more than 1.5 or 3 times the interquartile range,it is identified as an outlier or extreme outlier and expressed as a circle or a star
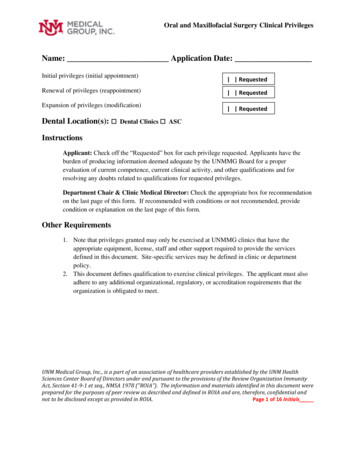
Indian Journal of OrthopaedicsImplant PositioningOnly femoral component rotation showed statistically significant differences. The more experienced surgeons groupprovided more external rotation to the femoral componentwith a non-clinically relevant mean difference of 1 . Table 3shows the implant position description according to the different surgical experience groups globally.Long‑Term Forgotten Joint ScoreSeventy-four patients completed the FJS at the end of thefollow-up period. FJS scale scores showed a non-normalitydistribution of the data. For a more robust statistical analysis of the FJS values, 5% trimmed summary statistics wereconsidered (Table 4).The statistical analysis proved noninferiority (and equivalence) for Groups 1 and 2 for Group 3, representing clinicallythat the beginner and intermediate surgeons achieved longterm clinical PROM results not inferior (and equivalent) tothose of a skilled surgeon. As can be seen in Fig. 3, for bothcomparisons of interest, the corresponding 90% CIs for themean difference (derived from the Yuen–Welch t test) areinside the interval of equivalence given by ( 18.5, 18.5),with first ranked p value 0.0185 0.025 and second-rankedp value 0.0354 0.05 (proving equivalence at a 5% significance level, based on the Holm–Bonferroni correction).Note that the score on the FJS scale is a favorable or beneficial outcome and, consequently, the higher the values,the better.The most experienced surgeons tend to achieve betterscores at FJS with less dispersion between values, representing a more consistent outcome. (Fig. 4).Survival RateSeventeen patients died before the long-term assessment.It was impossible to contact another four patients. None ofthese twenty-one patients required knee revision, accordingto clinical records.Table 3 Implant positioning descriptive evaluation between the three different groupsVariableGroup 1n 22Group 2n 37Group 3n 15GlobalN 7489.91 0.92 (89.50; 90.32) 90.16 0.90 (89.86; 90.46)90 (89, 90)90 (90, 91)Femoral implant rotation1.45 1.41 (0.83; 2.08)1.51 1.39* (1.05; 1.98)2 (0, 3)2 (1, 2)Tibial implant slope87.55 1.47 (86.89; 88.20) 87.65 1.40 (87.18; 88.12)87 (87, 89)88 (87, 88)Joint line height 1.23 2.31 ( 2.25; 0.20) 0.08 2.09 ( 0.78; 0.61) 1 ( 2, 0)0 ( 1, 1)90.40 0.91 (89.90; 90.90)90 (90, 91)2.47 0.83* (2.00; 2.93)3 (2, 3)87.40 1.24 (86.71; 88.09)87 (86.5, 88) 1.07 3.03 ( 2.75; 0.61) 1 ( 2.5, 1)Extension medial gap1.93 2.09 (0.78; 3.09)2 (0.5, 2.5)2.60 1.92 (1.54; 3.66)2 (1.5, 3.5)3.67 1.40 (2.89; 4.44)4 (2, 5)3.20 1.86 (2.17; 4.23)3 (2, 4)90.14 0.91 (89.92; 90.35)90 (90, 91)1.69 1.34 (1.38; 2.00)2 (1, 3)87.57 1.38 (87.25; 87.89)88 (87, 89) 0.62 2.40 ( 1.18; 0.07) 1 ( 2, 1)1.50 1.77 (1.09; 1.91)1 (0, 2)2.14 1.88 (1.70; 2.57)2 (1, 3)3.47 2.29 (2.94; 4.00)3 (2, 5)3.15 2.05 (2.67; 3.62)3 (2, 4)Femur implant slopeExtension lateral gapFlexion medial gapFlexion lateral gap1.86 1.78 (1.07; 2.65)2 (1, 2)1.95 1.91 (1.11; 2.80)2 (0, 3)3.91 2.99 (2.58; 5.24)3 (2, 5)3.27 2.69 (2.08; 4.47)3 (2, 4)1.11 1.58 (0.58; 1.63)1 (0, 2)2.05 1.86 (1.44; 2.67)2 (1, 3)3.14 2.10 (2.44; 3.83)3 (2, 4)3.05 1.70 (2.49; 3.62)3 (2, 4)These variables were obtained from the navigation system's final report provided by default. Summary statistics are: mean SD, (95% CI), andmedian (Q1, Q3)*Only femoral component rotation showed statistically significant differences p 0.05Table 4 FJS scores between thethree different groupsFJS-12Group 1n 22Group 2n 37Group 3n 15GlobalN 74Mean SD5% trimmedmean SD80.86 21.8883.61 12.6681.36 23.8782.38 20.5590.48 14.6590.48 10.1583.06 21.7785.08 16.72Summary statistics are mean SD, and 5% trimmed mean SD13
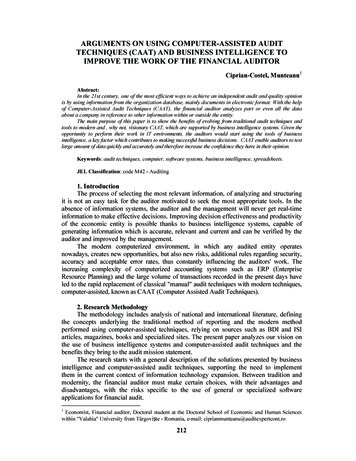
Indian Journal of OrthopaedicsFig. 3 The noninferiority of the scores on the FJS scale graphically,considering Group 3 as a reference. Groups have been defined in“Material and Methods”. The alternative hypothesis (H1) states thatthe scores on the FJS scale cannot be worse than 18.5 points lowerthan in Group 3 (the group of skilled surgeons). According to theMinimal Clinically Important Difference, the pre-established margin of noninferiority is defined as the mean between the smallest andlargest estimate of the MCID following Ingelsrud et al. [13]. Thus,any value located in the blue area (H0) represents clinical inferiorityconcerning Group 3Fig. 4 FJS. The horizontal line in the box represents the medianvalue. The height of the box is the interquartile range, Q1–Q3, i.e.,where the central 50% of the most representative matters are found.The vertical outbox lines represent the minimum and maximum ofthe non-outliers; when a value deviates from the top or bottom of thebox more than 1.5 or 3 times the interquartile range, it is identified asan outlier extreme outlier and expressed as a circle or a star. Groupshave been defined in “Material and Methods”. For example, group Bhas the greatest dispersion between the values in the FJS, but it is alsothe one with the most assigned patients. Note that the least experienced surgeons achieve the worst median FJS scoreThe overall prostheses survival rate with a follow-upgreater than ten years is 93.7%. Five patients required revision surgery related to aseptic loosening during the followup period. There were no diagnosed prosthetic infections.The mean follow-up was 11.10 0.78, 10.86 0.66, and11.30 0.74 years, respectively.Figure 5 shows the Kaplan–Meier survival curves. Theneed for revision surgery occurs mainly in the first threeyears after surgery.Discussion13The most important finding of the present study is thatlong-term outcomes are equivalent between surgeons withdifferent clinical experiences. The common denominatorin all surgeries was using a surgical navigator to assist thesurgeon during the procedure.
Indian Journal of OrthopaedicsFig. 5 Kaplan–Meier graph showing prostheses survival. Groups have been defined in “Material and Methods”. Color code (1 blue, 2 green,3 red). Five patients required knee revision, two of them in the first two years and corresponding to groups 1 and 2In 2008 our hospital was opened with a mix of surgeonswith different previous experiences. All procedures are performed in our department, assisted by a navigation system.This unusual situation has allowed us to determine whether asurgical navigator can equalize results among surgeons. Wemeasured the outcomes of interest in two different moments.We assessed the implant placement, alignment, and prosthetic stability at the end of the surgical procedure. In contrast, the long-term outcome was measured through a PROMassessment after more than ten years of follow-up.There are many ways to measure clinical outcomes[17, 18], and any evaluation of the effectiveness of TKAdepends on the definition of "successful". Previous studieshave shown that 10–25% of patients are dissatisfied withthe outcome of knee replacement at one to three years [19,20]. In this situation, it is necessary to focus on quantifying the success of these procedures using patient-reportedoutcome measured (PROMS). The most popular PROMSassessing TKA outcomes are the WOMAC, Knee Injury andOsteoarthritis Outcome (KOOS) Score, and the Oxford KneeScore (OKS). Despite their many similarities, when usingPROMs to assess TKA outcomes, the statistical significance(a p value) must be reported, and the clinical importanceusing the minimum clinically important difference (MCID)reported in the literature. The most crucial advantage of noninferiority and equivalence trials is that both designs allowcomparison with currently existing, clinically accepted treatment, even if there is a ceiling effect [18].The Forgotten joint score represents a valid and sensiblePROM score with a low ceiling effect [12]. The low ceilingeffect limits other scores such as WOMAC and OKS whendetecting small clinical changes in patients who report goodresults.Ingelsrud et al. reported an MCID of the FJS-12 inTKA between 14 and 23 points [13]. Defining the margin of equivalence as the average of these two values((14 23)/2 18.5), we have proven equivalence of thebeginner and intermediate surgeons concerning the expertgroup, with mean scores on the FJS scale of 80.86 21.88,81.36 23.87, and 90.48 14.65, respectively. In thissense, we believe our study demonstrates a similar outcomebetween beginners and experienced surgeons with a followup that exceeds ten years. The same observer (NVS) carriedout all the patient interviews. The global results are slightlyhigher than those reported in the literature. This differencemay be due to some positive bias. If this scale use bias werepresent, it would be uniform across the three groups. Ourwork does not want to compare the results obtained in ourseries with other published ones but rather to compare thesurgeons in our study.There were no statistically significant differences betweenthe groups regarding the final alignment and the position13
Indian Journal of Orthopaedicsof the femoral and tibial components. The overall result ofa knee replacement depends on many factors, almost allrelated to the implant placement. The navigation systemacts as a support tool, displaying real-time implant positionand limb alignment, allowing the beginner surgeon to accessconsistent and relevant information through the procedure[5, 9, 10, 21, 22].Although we have not found statistically significant differences between postoperative alignment, it should be notedthat the sagittal HKAA is closer to neutral in the less experienced surgeon group.There was no statistically significant correlation betweenimplant alignment and position and the patient's subjectivesatisfaction measured on the FJS scale. This situation mayindicate that both measures (objective clinical and subjective satisfaction) are complementary when evaluating thepostoperative success of the prosthesis [18].Good knee balancing is traditionally related to an excellent clinical outcome [23]. However, there is no direct correlation between a balanced prosthesis and an excellent clinical result [21, 24]. For objectivity, we used the principles ofsymmetry and congruence between the flexion and extensiongaps to establish the comparison between the groups. It isremarkable that regardless of the measure, two, three, or fourmillimeters apart, an inexperienced surgeon, assisted by anavigation system, can achieve the same balance parametersas an experienced one, as shown in Fig. 3.The overall prostheses survival rate with a follow-upgreater than ten years is 94%. This value is slightly higherthan that published in the registries [25] and may be basedon the fact that, as mentioned, a surgical navigation systemwas used in all cases [26, 27]. As expected [20], most revision surgeries were indicated in the first three years.The findings of this study will enable healthcare professionals to understand better the impact of implementingnavigated assisted TKA on the surgical workflow, especiallyamong less experienced surgeons or in those centers witha low volume of annual surgeries. Prosthetic knee surgeryhas changed in the last decade from a technique performedexclusively by experienced arthroplasty surgeons to almosta fundamental demand for any orthopedic surgeon. Wemust not forget that nearly all revision surgeries occur inthe first two years after implantation and directly relate tothe surgeon [20]. We have proven that relying on an externalnavigation system for intraoperative decision-making allowsthe surgeon to perform it as safely and efficiently as an experienced surgeon. Hospital managers should consider thesefindings, which would finance these systems, especially ifthe volume of prostheses per year is not very high.There are several limitations to this study. First, there wasno randomization between the allocation of cases and surgeons. The surgeries were performed consecutively and distributed according to the daily workload. We have conducted13extensive statistical analyses to compare demographic valuesand prior alignment between patients. There are no statistically significant differences between them, affirming thatthe groups are comparable. Second, we have not consideredthe learning curve effect for navigation for each surgeon[14]. At least one experienced navigational surgeon in allthe surgeries as part of the team. We sincerely believe thatthe presence of this surgeon in the team does not invalidatethe results obtained since the role he played was secondary,leaving the leading surgeon to make decisions. We highlightthis limitation through an express mention in the title andconclusion to provide the reader with a truthful judgmenton the applicability of the study results. Recently it has beenreported that Robotic-arm-assisted total knee arthroplastyhas a learning curve of seven cases for integration into thesurgical workflow but no learning curve effect for accuracyof implant positioning [28, 29]. It is more than possible thatthe same happens in navigation-assisted surgery since itsdata collection and surgery workflow have many similarities.ConclusionNavigated assisted TKA, under expert guidance, can be aseffective when performed by beginner or intermediate surgeons as performed by senior surgeons regarding the accuracy of implant positioning, limb alignment, and long-termclinical outcome.Acknowledgements We acknowledge Mr. Gregori for his revision ofthe manuscript.Author contributions RLG is the guarantor. Conceptualisation: RLG,EML, NVS, MCM, DMV. Methodology: EML. Writing (originaldraft): RLG. Writing (review and editing): MCM, DMV, NVS, RGB,FCM Supervision: RLG, EML. Project administration: RLG.Funding Open Access funding provided thanks to the CRUE-CSICagreement with Springer Nature.Availability of Data and Materials The datasets generated during and/oranalyzed during the current study are available from the correspondingauthor on reasonable request.DeclarationsConflict of Interest The author R. Larrainzar-Garijo is a paid consultant who receives royalties from B-Braun Aesculap. The other authorshave no conflicts of interest to declare concerning this study.Ethical approval Ethics approval was obtained from the Hospital ethics committee. All procedures performed in studies involving humanparticipants were in accordance with the ethical standards of the institutional
navigated total knee arthroplasty (TKA) was performed in our institution from 2008 to 2010. Seventeen patients had died during the follow-up period until 12/31/2020. The inclusion criteria were patients with primary osteoarthritic knee joints and receiving a posterior stabilized total knee replacement (Columbus, BBraun Aesculap) due to substan-tial pain and loss of functionality with any .