Transcription
CROSSMARK logo 3 Test1/1ORIGINALARTICLEPrecision and Future Medicine .00114pISSN: 2508-7940 · eISSN: /v2.0/logos/CROSSMARK Color square.svg 2017-03-16The associations between bone mineral densityand cerebral white matter hyperintensity inelderly stroke patientsJi-Sun Kim1, Minjik Kim1, Sung Hoon Kang1, Kyungmi Oh1, Sangil Suh2, Woo-Keun Seo3,4Department of Neurology, Korea University Guro Hospital, Korea University College of Medicine, Seoul, Korea1Department of Radiology, Korea University Guro Hospital, Korea University College of Medicine, Seoul, Korea2Department of Neurology, Samsung Medical Center, Sungkyunkwan University School of Medicine, Seoul, Korea3 Department of Digital Health, Samsung Advanced Institute for Health Sciences & Technology (SAIHST), Sungkyunkwan University,4Seoul, KoreaReceived: July 20, 2018Revised: July 29, 2018Accepted: August 1, 2018Corresponding author:Woo-Keun SeoDepartment of Neurology,Samsung Medical Center,Sungkyunkwan UniversitySchool of Medicine, 81 Irwon-ro,Gangnam-gu, Seoul 06351, KoreaTel: 82-2-3410-0799E-mail: mcastenosis@gmail.comABSTRACTPurpose: Osteoporosis is an important senile disease and has significant relationship withischemic stroke and cerebral small vessel disease (SVD). Correlation between bone mineral density (BMD) and cerebral white matter hyperintensity on magnetic resonance imagingwere analyzed to investigate the relationship between osteoporosis and cerebral SVD.Methods: Medical records of acute stroke patients with age 65 years were retrospec-tively collected from single center. Cerebral white matter hyperintensity was classifiedinto two categories, periventricular white matter hyperintensity (PWMH) and deepwhite matter hyperintensity (DWMH), and the severity was graded according to maximal lesion size. Association between the clinical factors including BMD and the severityof cerebral white matter hyperintensity was analyzed.Results: Four hundred eight patients were included in the study. High severity grade ofboth MWMH and DWMH was independently correlated with low BMD. Additionally, highPWMH grade was correlated with old age and high serum homocysteine. High DWMHgrade was correlated with old age, atrial fibrillation history and high serum total calcium.Conclusion: Low BMD was associated with a high severity of cerebral white matter hyperintensity in elderly Asian stroke patients, independent of other clinical factors.Keywords: Bone density; Cerebral white matter hyperintensity; Small vessel diseaseThis is an Open Access articledistributed under the terms of theCreative Commons AttributionNon-Commercial License NTRODUCTIONOsteoporosis is a huge burden of the elderly population that annually causes millions of fractures worldwide [1]. In addition, osteoporosis has close relationship with systemic vasculardiseases such as ischemic stroke. Ischemic stroke and osteoporosis have mutual relationshipin that osteoporosis could deteriorate by stroke and stroke patients with osteoporosis showedCopyright 2018 Sungkyunkwan University School of Medicine117
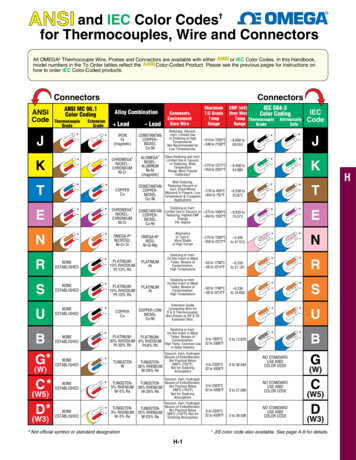
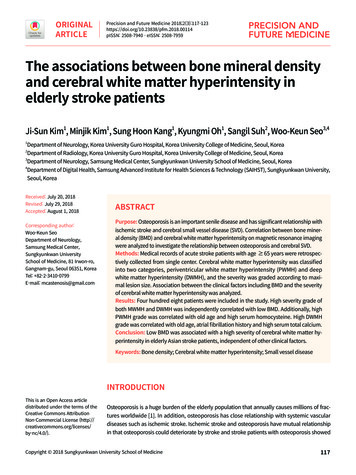
Osteoporosis and cerebral white matter hyperintensitypoor clinical outcome [2-4]. A resent epidemiologic study re-KUSR were presented in elsewhere [10]. In brief, KUSR haveemic stroke and accompanied meta-analysis also verifieddays from the onset of the stroke such as demographic data,vealed that osteoporosis was associated with the risk of ischthe association between osteoporosis and the risk of ischemic stroke [5].Osteoporosis also had association with cerebral small ves-collected the data about acute stroke patients within sevenvascular risk factors, laboratory findings, and imaging features.Diagnosis of stroke is based on focal neurological symptomswith relevant brain imaging findings. Among the patient regis-sel disease (SVD), a important cause of ischemic stroke. A re-tered in KUSR during study period, we selected the patientsassociation with cerebral SVD [6]. Other study demonstratedof BMD, and available fluid attenuated inversion recoverycent population-based study showed osteoporosis have anthe association between osteoporosis and cerebral whitematter changes conducted based on computed tomography(CT) findings [7]. Although the rating scale of cerebral whitematter changes applicable to both CT and magnetic reso-nance imaging (MRI) was available, MRI is still superior insensitivity especially for detecting small sized changes [8].Thus, more detailed validations using MRI is requested.Cerebral white matter hyperintensity is one of the import-who met the following criteria; age 65 years, measurement(FLAIR) images on MRI. We sequentially excluded patients whohad been prescribed for anti-osteoporotic medications such asalendronate, cholecalciferol, calcitriol, calciumcitrate, or calciumcarbonate. The study protocol was approved and supervised by the Institutional Review Boards of Korea UniversityMedical Center (KUGH-15111). Informed consent was waivedby the committee because of the retrospective study design.ant MRI findings of cerebral SVD [9]. This study aimed to in-Bone densitometry and magnetic resonance imagesSVD, by analyzing correlation of bone mineral density (BMD)logic Discovery A, Belford, MA, USA) for lumbar spine and pre-vestigate the association between osteoporosis and cerebraland severity of cerebral white matter hyperintensity on MRI.sented as T-score: T-score (individual BMD–reference BMD)/reference SD. MRI examination was performed using 1.5 TeslaMETHODSmagnetic resonance (MR) equipment (Sonata, Siemens, Erlan-gen, Germany) or 3.0 Tesla MR equipment (TrioTim, Siemens).SubjectsData were extracted from a prospectively collected hospital-based stroke registry (Korea University Stroke Registry-Guroarm; KUSR-G) from January 2008 to September 2014. Details ofAE118BMD was measured by dual-energy X-ray absorptiometry (Ho-BFAll patients underwent FLAIR imaging (TR 10,000 ms, TE 95ms, slice thickness 5 mm, FOV 384 218, no gap for 3.0 TeslaMR; or TR 8,000 ms, TE 108 ms, slice thickness 5 mm, FOV 256 192, no gap for 1.5 Tesla MR).CDFig. 1. Measuring method and grading of cerebral white matter hyperintensity in fluid attenuated inversion recovery (FLAIR) images.(A-C) These were the examples of periventricular white matter hyperintensity (PWMH), grade 1, 2, and 3, respectively. Among the periventricular caps, longest one is selected and used for the grading.(D-F) These were the examples of deep white matter hyperintensity(DWMH), grade 1, 2, and 3 serially. When measuring PWMH and DWMH,acute infarcted areas were excluded. In case of (D), the subject had acuteinfarction in right temporo-occipital lobes; hence, FLAIR high signallesions within the infarcted area were not used for the measurement.http://pfmjournal.org
Ji-Sun Kim, et al.Measurement of white matter hyperintensity on MRI10 to 24 mm), or D3 (confluent lesion, 25 mm). Infarctionpublished semiquantitative scale (Fig. 1) [11,12]. FLAIR imagethe assessment. Lacunar infarction was also excluded, de-White matter hyperintensity was assessed using previouslywas used for the assessment and the hyperintensity wasclassified into two categories, those in periventricular whitematter and those in deep white matter. When a periventricu-lesions, both acute and chronic state, were excluded fromfined as following; size 3 to 15 mm, T2 high signal, FLAIR lowsignal with gliotic rim, and T1 low signal [9].lar cap or band was found, those lesions were defined asStatistical analysisof the cap was measured along the longest length from thewere tested with one way analysis of variance (ANOVA) forperiventricular white matter hyperintensity (PWMH). The sizeanterior or posterior horn on a perpendicular axis. The size ofthe band was measured along the longest length from thelateral wall of the ventricle on the horizontal axis. Both capand band were rated as P1 ( 5 mm), P2 (5 to 9 mm), or P3( 10 mm). Deep white matter hyperintensity (DWMH) wasdefined as white matter hyperintensity lesion found abovethe second cut from the upper margin of the ventricle onFLAIR images, or close to the lateral ventricle with normalwhite matter between them. DWMH was rated as D1 (smalland large foci, 10 mm), D2 (beginning of a confluent lesion,The differences of clinical characteristics between subgroupscontinuous variables and chi-square test for categorical vari-ables. To investigate associations between the clinical factorsand cerebral white matter hyperintensity, both univariableand multivariable ordinal regression analysis were performed.In multivariable ordinal regression analysis model, variableswith P 0.10 in univariable analysis and clinically importantfactors such as BMD, alkaline phosphatase (ALP), phosphorus,calcium, and glomerular filtration rate (GFR) were includedand backward elimination method was used. All statisticalanalyses were performed using SPSS version 20.0 (IBM Co., Ar-Table 1. Clinical characteristics of subject subgroups according to PWMH and DWMH gradeCharacteristicAge (yr)Grade 173.48 5.40PWMHGrade 275.21 5.90Grade 377.39 6.59Male sex74 (59.7)81 (52.3)58 (45.0)Weight (kg)62.42 9.9060.50 9.9559.23 11.02Height (cm)162.07 8.30 160.32 8.94 159.27 8.84BMI (kg/m2)23.63 2.8923.37 2.9523.26 2.99BMD (T-score)–2.06 1.16–2.43 1.12–2.82 1.05Clinical historyHypertension84 (68.3)126 (81.3)103 (79.8)Diabetes mellitus44 (35.8)63 (40.6)42 (32.8)Atrial fibrillation40 (32.3)31 (20.0)26 (20.2)Smoking31 (25.2)37 (23.9)29 (22.7)Previous stroke14 (11.3)13 (8.4)18 (14.0)Laboratory testALP (IU/L)77.89 27.37 72.49 20.07 80.94 27.47Phosphorus (mg/dL)3.13 0.633.21 0.483.16 0.51Total calcium (mg/dL)8.85 0.378.95 0.468.86 0.44GFRb) (mL/min)89.80 16.41 83.01 16.69 81.13 16.88LDL-C (mg/dL)105.38 28.22 105.80 32.47 108.56 29.69HDL-C (mg/dL)45.24 10.32 44.83 11.10 45.30 11.95Triglyceride (mg/dL)98.88 39.57 117.46 55.68 105.38 49.28Homocysteine (μmol/L)9.78 3.2711.12 4.0912.39 4.61Lipoprotein-α (mg/dL)3.62 1.543.74 1.383.68 1.46P-value 0.001a)0.0640.0530.038a)0.610 076 0.001a)0.6610.9260.007a) 0.001a)0.803Grade 1DWMHGrade 2Grade 374.07 5.4475.75 6.2478.55 6.88148 (72.9)80 (39.4)57 (28.1)54 (26.6)19 (9.4)109 (79.6)49 (36.0)27 (19.6)32 (23.5)15 (10.9)56 (83.6)20 (29.9)13 (19.4)11 (16.4)11 (16.4)123 (60.6)66 (47.8)24 (35.8)61.69 10.04 59.52 10.10 60.13 11.51161.90 8.38 159.38 9.00 158.61 8.8823.40 2.9523.20 2.7223.93 3.33–2.17 1.16–2.65 1.09–2.82 1.0676.25 25.823.17 0.588.93 0.4186.12 17.32104.90 29.3445.37 10.61106.15 48.6510.85 4.063.63 1.5276.16 26.563.18 0.518.87 0.4683.46 17.23106.23 31.5644.31 12.31113.33 52.1311.48 4.243.75 1.4879.72 19.103.15 0.488.81 0.4481.57 15.20112.11 30.4245.92 10.10102.35 47.2811.16 4.253.70 1.45P-value 0.001a)0.001a)0.1540.005a)0.277 450.5570.2670.3970.756Values are presented as mean standard deviation or number (%). Analysis of variance (ANOVA) for continuous variables and chi-square test forcategorical variables were performed.PWMH, periventricular white matter hyperintensity; DWMH, deep white matter hyperintensity; BMI, body mass index; BMD, bone mineral density;ALP, alkaline phosphatase; GFR, glomerular filtration rate; LDL-C, low density lipoprotein cholesterol; HDL-C, high density lipoprotein cholesterol.a)P 0.05; b)Calculated with creatinine, age, sex, and weight.https://doi.org/10.23838/pfm.2018.00114119
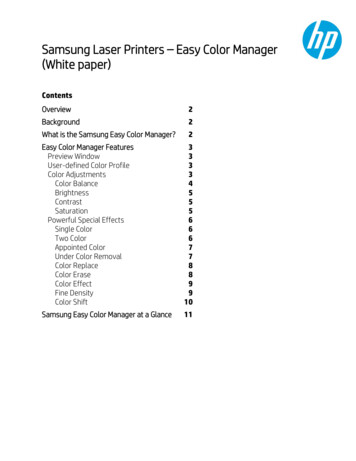
Osteoporosis and cerebral white matter hyperintensitymonk, NY, USA), R language version 3.01 (R Foundation forStatistical Computing, Vienna, Austria), or SAS version 9.1 (SASInstitute Inc., Cary, NC, USA), and P-values 0.05 were regarded as significant.cantly correlated with both PVMH (odd ratio [OR], –0.416; 95%confidence interval [CI], –0.654 to –0.178; P 0.001) and DVMH(OR, 0.306; 95% CI, –0.546 to –0.067; P 0.012) (Table 2). Chang-es of PWMH and DWMH grades exert synergistic effect on BMD(Fig. 2). In addition, several factors showed significant correla-RESULTStions; old age and high serum homocysteine for high PWMHFinally, 408 patients were included in the study; 75.37 6.17years old and 213 (52.2%) were male. Mean BMD T-score wasgrade; old age, AF history, and high serum total calcium for highDWMH grade.–2.439 1.15 and 202 (49.5%) had osteoporosis, T-score low-er than –2.5. Distribution of PWMH subgroup was as follows;124 for grade 1, 155 for grade 2, and 129 for grade 3. Distribu-–2.0for grade 2, and 67 for grade 3. In comparison of clinical char-–2.2tion of DWMH subgroup was as follows; 203 for grade 1, 138acteristics among PWMH subgroups, age, height, BMD, hypermocysteine, ALP, and GFR were significantly different. Incomparison of clinical characteristics among DWMH sub-–2.4BMDtension history, atrial fibrillation (AF) history, triglyceride, ho-–2.6groups, age, sex, height, and BMD were significantly different–2.8(Table 1).In univariable regression analysis of PWMH as a response–3.0variable, age, sex, weight, height, BMD, hypertension history,AF history, GFR, and homocysteine showed significant association with P-value less than 0.1 (Supplementary Table 1). Inunivariable regression analysis of DWMH as a response variable, age, sex, weight, height, BMD, hypertension history, AFhistory, total calcium, and GFR showed P-value less than 0.1(Table 1). In multivariable regression analysis, BMD was signifi-Grade 1Grade ona),b)Atrial sphorusb)a),b)Total –0.0040.1230.001–0.146PWMH95% CIP-value–0.387 to 0.831–0.022 to 0.045–0.654 to –0.199–0.199 to 0.761–0.909 to 0.037–0.020 to 0.0110.063 to 0.182–0.008 to 0.010-0.4750.508 0.001c)0.2510.0710.592 0.001c)0.820-0.002 to 0.073–0.022 to 0.0451radee2GGrad3eHGradDWMFig. 2. Mean bone mineral density (BMD) of subgroups, classified withthe grade of periventricular white matter hyperintensity (PWMH) anddeep white matter hyperintensity (DWMH). According to increase ofgrade, BMD tends to decrease. There was no subjects with PWMHgrade 1 and DWMH grade 3.Table 2. Relationships between clinical factors and subtypes of cerebral white matter hyperintensityVariableGrade 4–0.0090.002–0.147–0.474DWMH95% CIP-value–0.108 to 0.910–0.006 to 0.041–0.563 to –0.088–0.243 to 0.756–1.124 to –0.145–0.022 to 0.004–0.006 to 0.010–0.543 to .021 to 0.092–0.945 to –0.0020.002c)0.049Multivariable ordinal regression analysis was performed.PWMH, periventricular white matter hyperintensity; DWMH, deep white matter hyperintensity; OR, odd ratio; CI, confidence interval; BMD, bonemineral density; GFR, glomerular filtration rate; ALP, alkaline phosphatase.a)Variables for PWMH; b)Variables for DWMH; C)P 0.05 was presented as bold characters.120http://pfmjournal.org
DISCUSSIONJi-Sun Kim, et al.In the present study, severity of cerebral white matter hyperin-risk of cardiovascular disease such as myocardial infarction orstroke [21,22]. Bisphosphonate has been suggested to reducecardiovascular disease by the following mechanisms; inhibi-tensity on MRI showed significant associations with BMD, com-tion of intimal hyperplasia, macrophage-related inflamma-significant association between presence of osteoporosis andta-analysis showed different results that bisphosphonate dopatible results with the previous study. Previous study showedcerebral SVD on CT [7]. Although other previous study statedno significant correlation between SVD and low BMD, the studyused phalynx rather than femur neck as measuring site of BMD[13]. Because phalynx is not a recommended site for BMD measuring to assess osteoporosis in clinical practice, BMD mea-sured in phalynx maybe insufficiently reflect the presence ofosteoporosis [14].It is suggested that sharing of risk factor might explain theassociation between osteoporosis and cerebral SVD [7]. Tra-tion, and vascular calcification [22,23]. However, recent me-not act as beneficial or harmful factor on atherosclerosis [24].Meanwhile, calcium supplements may be harmful to cardio-vascular disease [25,26]. Contrast to daily calcium intake dose,artificial calcium supplements lead to significant increase ofserum calcium level. The increased calcium level is associatedwith increased cardiovascular risk [25,27,28]. Whether activetreatment of osteoporosis reduces the risk of cerebral SVD isnot clear and careful approach is needed.In addition to BMD, several factors were associated with ce-ditionally, cerebral SVD that refers to atherosclerosis hasrebral SVD. Age was independent risk factor for both PWMHsion, diabetes mellitus, dyslipidemia, smoking, or homocys-ly correlated with DWMH (P 0.011; OR, –0.634). Although sta-been known as having risk factors such as aging, hypertenteine [15]. Osteoporosis has several risk factors similar to cerebral SVD in part, like smoking and old age. However, in thisand DWMH, as reported in previous study [29]. AF was inversetistically not significant, PWMH also showed tendency of nega-tive association with AF (P 0.071; OR, –0.436). The results canstudy, the association between cerebral white matter hyper-be explained by the following. The study was performed withthe association could not be explained by risk factors shar-oembolic stroke, and patients with cardioembolic stroke haveintensity and BMD was independent of such risk factors, thusing. Although the underlying pathophysiologic mechanismsbetween osteoporosis and cerebral SVD are still on debate,one of the possible explanations is that osteoporosis-relatedabnormal calcium metabolism could increase vascular calcification and arterial wall stiffness [5,16]. Vascular calcifica-tion has been suggested as a marker of cerebral SVD in recent observations [17,18]. The association may also be explained by common pathophysiology of the two conditions.Atherosclerosis, a main pathology of cerebral SVD, and oste-acute symptomatic stroke patients. AF is a major cause of cardi-smaller cerebral white matter hyperintensity volume thanthose with large artery atherosclerosis or small vessel occlusion[30,31]. Homocysteine showed significant association withPVMH but not with DVMH. In the contrast, serum calcium levelis associated with DVMH only. Discrepancy of significant association factors between PWMH and DWMH may indicate that thetwo categories have different pathomechanism in part, whichis not clearly identified, and reserved for future investigation.The present study has several limitations. First, the studyoporosis are known to have common pathogenesis like bonepopulation consisted of a single-race, was selected from hos-factor-kappaB ligand (RANKL)/RANK/osteoprotegerin (OPG)were not included. Thus there are some limitations to gener-morphogenetic proteins, the receptor activator of nuclearpathway, matrix Gla protein (MGP) and vitamin K [19]. Lowvitamin D level also is known to be associated with increasedvascular risk [20].If osteoporosis is an independent risk factor of cerebral SVD,we can assume that treatment of osteoporosis reduces the occurrence or progression of cerebral SVD. However, such con-cept should be considered with caution. Two well-establishedagents for treating osteoporosis, bisphosphonate, and calci-um, showed a dissimilar influence to atherosclerosis. Therehas been no consensus about the effect of bisphosphonate onatherosclerosis. Several observational studies demonstratedthat bisphosphonate treatment had benefit on reducing d symptomatic stroke patients and healthy subjectsalize the results. Second, subjects taking osteoporosis medications were excluded for the study. The strict inclusion crite-ria was unavoidable due to more homogeneous study populations; however, subjects with severe or symptomatic osteoporosis may be eliminated from the study and it can attenuate the results. Finally, MRI equipment used for the study wasnot identical to each other, one was 1.5 Tesla and the otherwas 3.0 Tesla. Because measurement of cerebral white matter intensities is a precision task and requires high resolutionimages, heterogeneity of MRI equipment may influence tomeasured size of cerebral white matter intensities. However,possible missing or mis-sized lesions on low tesla MRI are of121
Osteoporosis and cerebral white matter hyperintensityten small-sized; hence, they do not significantly influence tograding of cerebral white matter hyperintensity, because thegrade in the study was decided by size of biggest lesion [32].In conclusion, low BMD was associated with a high severityof cerebral white matter hyperintensity in elderly Asian strokepatients. This association was independent of a shared etiol-ogy of osteoporosis and cerebral SVD. Osteoporosis could be10. Alagiakrishnan K, Hsueh J, Zhang E, Khan K, Senthilsel-van A. Small vessel disease/white matter disease of thebrain and its association with osteoporosis. J Clin MedRes 2015;7:297-302.11. Kim DH, Rogers JR, Fulchino LA, Kim CA, Solomon DH,Kim SC. Bisphosphonates and risk of cardiovascularevents: a meta-analysis. PLoS One 2015;10:e0122646.linked to dementia or stroke through cerebral SVD, it would12. Foley RN, Collins AJ, Ishani A, Kalra PA. Calcium-phos-fect of osteoporosis treatment on cerebral SVD is still on de-ty-dwelling adults: the Atherosclerosis Risk in Communi-be important to screen osteoporosis in advance. But the efbate and further longitudinal studies are requested.CONFLICTS OF INTERESTNo potential conflict of interest relevant to this article was reported.REFERENCESphate levels and cardiovascular disease in communities (ARIC) Study. Am Heart J 2008;156:556-63.13. Kang JH, Keller JJ, Lin HC. A population-based 2-year follow-up study on the relationship between bisphospho-nates and the risk of stroke. Osteoporos Int 2012;23:25517.14. Noh Y, Lee Y, Seo SW, Jeong JH, Choi SH, Back JH, et al. Anew classification system for ischemia using a combination of deep and periventricular white matter hyperintensities. J Stroke Cerebrovasc Dis 2014;23:636-42.1. Prevention and management of osteoporosis. World15. Rost NS, Rahman RM, Biffi A, Smith EE, Kanakis A, Fitz-2. Minn YK, Suk SH, Do SY. Osteoporosis as an independentcreased in small vessel stroke subtypes. Neurology 2010;Health Organ Tech Rep Ser 2003;921:1-164.risk factor for silent brain infarction and white matterchanges in men and women: the PRESENT project. Osteoporos Int 2014;25:2465-9.3. Lampropoulos CE, Papaioannou I, D’Cruz DP. Osteoporo-patrick K, et al. White matter hyperintensity volume is in75:1670-7.16. Choi JY, Seo WK, Kang SH, Jung JM, Cho KH, Yu S, et al.Statins improve survival in patients with cardioembolicstroke. Stroke 2014;45:1849-52.sis: a risk factor for cardiovascular disease? Nat Rev17. Seo WK, Lee JM, Park MH, Park KW, Lee DH. Cerebral mi-4. Bolland MJ, Avenell A, Baron JA, Grey A, MacLennan GS,stiffness in stroke patients. Cerebrovasc Dis 2008;26:618-Rheumatol 2012;8:587-98.Gamble GD, et al. Effect of calcium supplements on riskcrobleeds are independently associated with arterial23.of myocardial infarction and cardiovascular events: me-18. Mussolino ME, Madans JH, Gillum RF. Bone mineral den-5. Santos LL, Cavalcanti TB, Bandeira FA. Vascular effects of19. Hong NR, Seo HS, Lee YH, Kim JH, Seol HY, Lee NJ, et al.ta-analysis. BMJ 2010;341:c3691.bisphosphonates-a systematic review. Clin Med InsightsEndocrinol Diabetes 2012;5:47-54.6. Kang JH, Keller JJ, Lin HC. Bisphosphonates reduced therisk of acute myocardial infarction: a 2-year follow-upstudy. Osteoporos Int 2013;24:271-7.7. Carda S, Cisari C, Invernizzi M, Bevilacqua M. Osteoporo-sis after stroke: a review of the causes and potentialtreatments. Cerebrovasc Dis 2009;28:191-200.sity and stroke. Stroke 2003;34:e20-2.The correlation between carotid siphon calcification andlacunar infarction. Neuroradiology 2011;53:643-9.20. Poole KE, Reeve J, Warburton EA. Falls, fractures, and osteoporosis after stroke: time to think about protection?Stroke 2002;33:1432-6.21. Wardlaw JM, Smith C, Dichgans M. Mechanisms of sporadic cerebral small vessel disease: insights from neuroimaging. Lancet Neurol 2013;12:483-97.8. Meyer JS, Kawamura J, Terayama Y. White matter lesions22. Frost ML, Grella R, Millasseau SC, Jiang BY, Hampson G, Fo-9. Wardlaw JM, Brindle W, Casado AM, Shuler K, Hendersonrotic plaque and arterial stiffness to bone mineral densityin the elderly. J Neurol Sci 1992;110:1-7.M, Thomas B, et al. A systematic review of the utility of 1.5versus 3 Tesla magnetic resonance brain imaging in clinical practice and research. Eur Radiol 2012;22:2295-303.122gelman I, et al. Relationship of calcification of atheroscleand osteoprotegerin in postmenopausal women referredfor osteoporosis screening. Calcif Tissue Int 2008;83:11220.http://pfmjournal.org
Ji-Sun Kim, et al.23. Jorde R, Sundsfjord J, Fitzgerald P, Bonaa KH. Serum cal-and neurodegeneration. Lancet Neurol 2013;12:822-38.cium and cardiovascular risk factors and diseases: the28. Golob AL, Laya MB. Osteoporosis: screening, prevention,24. Iijima K, Akishita M, Ouchi Y. Coronary artery calcification29. Beveridge LA, Witham MD. Vitamin D and the cardiovas-Tromso study. Hypertension 1999;34:484-90.and cerebral small vessel disease. Association of systemic atherosclerosis. Circ J 2011;75:272-3.25. Lee SB, Cho AH, Butcher KS, Kim TW, Ryu SY, Kim YI. Lowbone mineral density is associated with poor clinical outcome in acute ischemic stroke. Int J Stroke 2013;8:68-72.and management. Med Clin North Am 2015;99:587-606.cular system. Osteoporos Int 2013;24:2167-80.30. Wahlund LO, Barkhof F, Fazekas F, Bronge L, Augustin M,Sjogren M, et al. A new rating scale for age-related whitematter changes applicable to MRI and CT. Stroke 2001;32:1318-22.26. Myint PK, Clark AB, Kwok CS, Loke YK, Yeong JK, Luben RN,31. Bolland MJ, Barber PA, Doughty RN, Mason B, Horne A,pean prospective investigation into cancer-norfolk popula-ceiving calcium supplementation: randomised controlledet al. Bone mineral density and incidence of stroke: Euro-tion-based study, systematic review, and meta-analysis.Stroke 2014;45:373-82.27. Wardlaw JM, Smith EE, Biessels GJ, Cordonnier C, FazekasF, Frayne R, et al. Neuroimaging standards for researchinto small vessel disease and its contribution to ageinghttps://doi.org/10.23838/pfm.2018.00114Ames R, et al. Vascular events in healthy older women retrial. BMJ 2008;336:262-6.32. Chutinet A, Biffi A, Kanakis A, Fitzpatrick KM, Furie KL,Rost NS. Severity of leukoaraiosis in large vessel atherosclerotic disease. AJNR Am J Neuroradiol 2012;33:1591-5.123
Supplementary Table 1. Univariable regression analysis between clinical factors and cerebral white matter hyperintensity subtypesVariableAgeORPWMH95% CIP-value0.070 to 0.7900.019a)0.0790.048 to 0.109Weight–0.022–0.040 to –0.004BMI–0.031–0.093 to 0.0320.4830.056 to 0.911SexHeightBMDClinical historyHypertensionDiabetes mellitus0.430–0.026–0.438–0.047 to –0.006–0.602 to –0.275–0.016–0.034 to 0.002–0.057 to –0.0130.002a)a) 0.001–0.414–0.583 to –0.245 0.001a)0.027a)0.4610.010 to 0.9120.045a)0.332ALP0.004–0.003 to 0.0110.269Total calcium0.026–0.393 to 0.4450.902Laboratory eLipoprotein-α0.095–0.355 to 0.787–0.237 to 0.4270.088a)–0.0350.5730.2130.706 0.001a)0.013a)–0.193 to 0.349Previous stroke 0.001a)0.015a)0.078Smoking0.332 to 1.0800.048 to 0.1100.615–0.919 to –0.073P-value0.079–0.467 to 0.276–0.49695% CI 0.001a)–0.095Atrial fibrillationORDWMH0.021–0.264–0.043 to 0.085–0.650 to 0.1220.5210.1800.022–0.443–0.887 to 0.0020.051a)0.4590.421–0.157 to 0.9980.153a)–0.173–0.457 to 0.1100.2300.003–0.005 to 0.0100.494–0.451–0.887 to –0.0140.043a)0.573–0.029–0.371 to 0.3120.867–0.022–0.033 to –0.011 0.001–0.011–0.022 to 0.0000.042a)0.000–0.016 to 0.0160.964–0.001–0.018 to 0.0150.881 0.001a)0.0240.0020.0020.1130.017–0.004 to 0.008–0.002 to 0.0050.066 to 0.160–0.108 to 0.143a)0.4230.3660.7880.0040.0000.038–0.002 to 0.011–0.003 to 0.004–0.021 to 0.068–0.092 to 0.1670.1580.8300.3030.568Univariable ordinal regression analysis was performed.PWMH, periventricular white matter hyperintensity; DWMH, deep white matter hyperintensity; OR, odd ratio; CI, confidence interval; BMI, bodymass index; BMD, bone mineral density; ALP, alkaline phosphatase; GFR, glomerular filtration rate; LDL-C, low density lipoprotein cholesterol;HDL-C, high density lipoprotein cholesterol.P 0.1.a)
Results: Four hundred eight patients were included in the study. High severity grade of both MWMH and DWMH was independently correlated with low BMD. . School of Medicine, 81 Irwon-ro, Gangnam-gu, Seoul 06351, Korea Tel: 82-2-3410-0799 . Belford, MA, USA) for lumbar spine and pre-sented as T-score: T-score (individual BMD-reference BMD)/ .