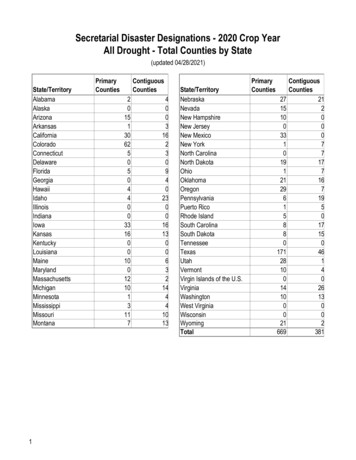
Transcription
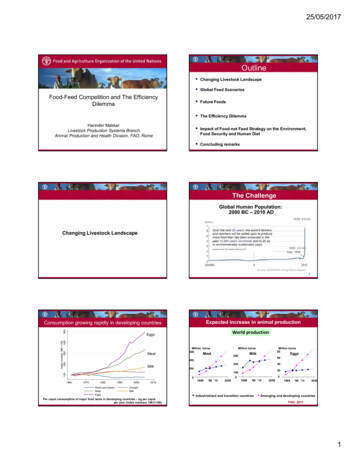
25/05/2017OutlineFood-Feed Competition and The EfficiencyDilemmaHarinder MakkarLivestock Production Systems BranchAnimal Production and Health Division, FAO, Rome Changing Livestock Landscape Global Feed Scenarios Future Feeds The Efficiency Dilemma Impact of Food-not Feed Strategy on the Environment,Food Security and Human Diet Concluding remarksThe ChallengeGlobal Human Population:2000 BC – 2010 AD2050: 9.6 blnBillionChanging Livestock Landscape1950: 2.6 blnApp. 1850Source: IUCN/WWF Living Planet Report4Expected increase in animal production500Consumption growing rapidly in developing countriesWorld productionIndex number:1961 100200300400EggsMeatMillion tonne300Million tonneMeatMillion 701980Roots and tubersMeatEggs199020002010001968‘98 ‘1520501968‘98 ‘1520501968‘98 ‘152050CerealsMilkPer caput consumption of major food items in developing countries – kg per caputper year (index numbers 1961 100)Industrialized and transition countriesEmerging and developing countriesFAO, 20111
25/05/2017Monogastrics progress faster than ruminantsGlobal livestock productionWorld production of main categories of meatPoultryPig8South Asia dominates growth in milk productionSouth AsiaMeat production is growing, with striking regionaldifferencesEast and South East AsiaLatin AmericaNENA(NENA)Relationship between animal protein and incomeOilcakes and cereal use as feedPer capita animal protein supply (gr/day)120Cereal ( 40%)1008060Oilcakes ( 60%)40200010,00020,00030,00040,00050,000Per capita GDP (US PPP)60,00070,00080,0002
25/05/2017Fuel-feed competitionFood-feed competition2012–2013: 795 million tonnes cereals (1/3 total cereal) - animal feedA continued rapid expansionof biofuel up to 2050Of the total cereal use in livestock sector6 90018 4001 280 680Sugar ed pre-schoolchildrenCane/beetmolasses142 50065%40%Sugar beet292 300Cereal energy used for meat production,if fed directlyFreshcassavameetAnnual calorie need of 3.5 billion peopleNellemann et al. (2009), UNEPEU: 53%Future Feed ResourcesAfrica and South Asia being3 and 1.7 million higher thanFAO (2009)otherwiseX 1000 tonnes FAO (2013)Other (whey,beveragewaste, etc.)2010 world feedstock usage for fuel ethanol (thousand tonne)6 900 1 280 68018 400Sugar caneGrains (gross)*Food-not Feed ResourcesApproximately 1/3 ofgrain for fuel ethanolproduces animal feedco-productsCane/beetmolasses142 500Sugar beet292 300Fresh cassavaOther (whey,beverage waste,etc.)47.5 million tonnesGrowth & anticipated world expansion of biodiesel productionNew feed resources Glycerol (7.2 million tonnes) Fatty acid distillate (0.6 million tonnes)Source: F.O. Licht, 2011Protein isolate for monogastrcs from unconventional feeds Palm kernel cake Pongamia seed cake Rapeseed cake Sunflower cake Camelina seed cake Green leuminous foragesIso-electric pHProtein isolate (80-90%CP)SOURCE: National Biodiesel Board, 20083
25/05/2017Protein hydrolysate using green chemistry Pongamia seed Rapeseed Sunflower seed Camelina seed Jatropha kernelsSeaweeds (macro-algae)OilBrown algaeup to 14% CPRed Algaeup to 50% CPGreen algaeup to 30% CPRich in bioactive compounds (reduction inenteric methane)Enzyme assistedoil extractionPre-biotics: alginates, mannitol, laminarin,fucoidanSource of organic mineralsHydrolysed proteinsSeaweed polysaccharides have positive effect onRed seaweed:Asparagopsisreducing digestive infections in calves, prevent-a star performerketosis, boost immunity and reduce metabolic disordersMakkar et al. (2016) Future areas of work: Develop large scaleproduction, harvesting and drying methodsCastor mealJatropha curcas kernel meals & oil from non‐toxic genotype: Safe for animal consumptionNon-toxic JatrophaJatropha curcas mealCastor seeds 1.2 million tonnes (Gujarat, Andhra Pradesh and Rajasthan)Potential meal: 0.6 million tonnesJatropha platyphylla(non-toxic)Jatropha curcas(non-toxic)Detoxification process: AvailableJatropha mealUpscaling and economical viability studies neededHistopathologicalandblood studiesNo adverseeffects10% availability of oil seed cakes (india)Camelina sativa meal and LupinCamelina sativa or false flax - the Brassica (Cruciferae) family Crude protein: 36-40%By-products from fruit and vegetable and other agroprocessing plantsCan’t be dumped on waste land/rivers -- Results in environmental pollutionBaby corn plantBrewers grainsApple pomace(rich in EAA including lys & meth)Saag waste for disposNeed to makethem mainstream feedsLupinus angustifolius, Lupinus luteus, Lupinus albus Crude protein: 36-40 % (low in EAA including lys & meth)Citrus pulpAssess:MustardSpinach- what, how much is available,- cost involved in transport (economical viabilityhinges on transport cost)- drying costs- study pellet formation or direct use in a complete feed4
25/05/2017Insect as feed for poultry, pigs and fishMoringa – a novel feed resourceDense cultivationof Moringa oleiferaYieldYield(tons/ha/yr)Concentration(% DM)DM aggots: larvae of the housefly Musca domestica20% leaf meal i.e. 25 tonnes; has 25% proteinTotal protein yield/ha 6.4 tonnesSoyabeanVs.Soybean 3.5 tonnes/haProtein 35 %Total protein yield/haBlack Soldier Fly or Hermetia illucens 1.23tonnesGrowing trees asintensively cultivatedfodder plants:Leucaena, Mulberry,Gliricidia, Thithonia Protein quality is generally high, similar to otheranimal meat sources Protein content: ca 50% Fat content is variable, but in general a goodsource of essential polyunsaturated fatty acids. A significant source of iron, zinc and vitamin A.Challenges: Mass production at an industrial scale,safety issue and regulatory aspectsSource: Makkar et al (2014): AFSTThorn-less cactus (Opuntia ficusindica) as animal feedBrazil200 – 260 tonnes/haIntensive systemA multipurpose plantSmallholder systemCactus:a cash-cropOnly 250 litres/kgTunisia (alley farming)30 – 100 tonnes/haFootprint of food wastage (1.3‐1.6 Gt/year)3.3 Gt CO2eq/year 3rd largest emitter,if food wastage was acountryFruit and Vegetable Wastes to Animal Feed305 km3/year 3 times lake GenevaCO2Carbon WaterLand1.5 billion ha used togrow food that is wasted 30% of agricultural landSource: FAO, 2013. Food Wastage Footprint: Impactson Natural ResourcesUSD 1.578trillionUSD 1 055billion1.3-1.6 Gt (30% of total)Wasted per yearSocio-environmentalcosts (under-estimate)Food processing sector(organized): Losses in Fruit &Vegetable (million tons)Economic costs (2012)Full cost of Food WastageInsect rearingMakkar et al. (2014)India 1.81China 32.0USA 15Silage productionBakshi, Wadhwa and Makkar (2013)5
25/05/2017Reduce losses of feed resourcesMaking of densified total mixed ration blocksLoss of valuable resourcesAir pollutionLoss in soil biodiversityForageWheat straw, paddy straw,sorghum stalks, Sugarcanetops, bagasse etc.ConcentrateOilseed cakes,urea, molassesor other energysources,MixesVitamin mix, mineral mix,probiotics, additives,anti-oxidants,antitoxins, etc.South-South partnershipsMachine for mixing of chopped straw andconcentrateHydraulic press for making densifiedblocksAdvantages of Densified straw-based blocksLess wastageHigher productivityGood feed for emergency situationsThinking efficiency in multi-dimensionsEasier to feed by farmersEasier and safer to transport& storeSetting up of National Feed Grid & Fodder Bankspossible.Can discourage straw burningEnhanced public-private partnership will increase adoption of thestraw-based total mixed ration technology35Estimated global emission intensities (Ei)Human edible protein output‐input ratioLivestock commoditieskg CO2-eq per kg 00.00150.00100.008013050.00BeefCattle milkSmall ruminantSmall ruminantmeatmilkPorkChicken meat Chicken eggsFAO 2013Mean based on data from India, Pakistan, Bangladesh, Thailand, Bhutan, Mongolia.6
25/05/2017Livestock Protein BalancesAddressing efficiency dilemmaOne lactationEmission intensity (kg CO2 eq./kg milk), at farm gateIndia smallholder dairy farms: up to 2.07 (C), 3.73 (B)(lactation, feed prod.) . Garg et al. 2016Kenya smallholder farms 2.8 (up to 9)FAO (2015)India: Net contributionequivalent to proteinneeds for 150 millionpeopleSwedish dairy farm0.90–1.04van der Werf et al., 2009French dairy farm1.04van der Werf et al., 2009W. Europe1.47 (herd basis & feed prod.)FAO (2013)North America1.33 (herd basis & feed prod.)FAO (2013)Human edible protein output/human edible protein inputShould we consider only emission intensity?Anticipated:Emission intensity(kg CO2 eq./kg milk)on the label !!!!India, milk10.9Jordan, milkUSA, milkUK, milk0.601.811.41FAO/NIANP (2016)Vs.Hawileh, 2015Baldwin, 1984; CAST, 1999)Wilkinson, 2011Addressing an efficiency dilemmaWe need to think of efficiency in multiple dimensionsUnits of efficiencyNeed to reconsider the units used to measure efficiency – Ei an importantNeed to BUTgeneratedataparameter and must be monitoredit can’tjust be EiEfficiency in Social DimensionNeed to include, for exampleFamilies lifted outof povertyImprovement-- Land use changeimpacting soil CQuantity of animal productin child health-- Competition for arable land withAn ideal situationNo. of childrenWater usegrain cropsschoolArable landtouse/Land use change-- Water use associated with feeds Human edible proteinoutput/human edible protein-- Disruption inEmploymentnitrogen cyclesinputWomen empoweredgenerated-- Use of P8 Nov 2016, Nature Climate ChangeEi (GHG)Quantity ofproductDisruption of globalnitrogen cycleQuantity of productSetting the sceneFeed and EnvironmentExpected increase in environmental impactsExample of non-CO2 GHGMt eq-CO2Developed countries6000Mt eq-CO26000400040002000200000CH4livestockCH4 riceFeedingpracticesDeveloping countriesFeed productionandprocessing: 45 %70–90% of Feed Pto ManureN2OIPCC, 2007Enteric methaneFAO (2013)7
25/05/2017Feed is the driver of livestock productionProductquality &safetyReproductiveefficiency ingbiodiversityFeedCalfmanagementLand use andland itecontrolFeedmanagementWater use &water pollutionAnimal healthFeed-fuelcompetitionNeed for holistic approach- better farm profitHealthmanagementAnimalreproductionand breedingmanagementEconomic viability(driver of production systems)Family in USA, Weekly food budget of US 300Rationalization of consumption of animal products: Food-not Feed ScenariosAverage consumption of protein of animal origin (without fish): 24 g/capita/dLowest (Burundi) 1.7 g/capita/dTotal protein intake 42.5g/capita/daMaximum (USA) 69 g/capita/dTotal protein intake 120 g/capita/d1. Base year:– Current situation 2005-2009 (mean value), 2763 kcal/cap/dayConverge to20 g protein of animal origin 7.3 kg protein/capita/annum ca 52 kg of meat equivalentRationalization of consumptionof animal productsDecrease use of natural resources&Sustainability to LPS2. Reference scenario:– Situation in 2050 based on FAO calculations– 9.2 billion people– Food demand patterns, 3027 kcal/cap/day– Permanent grassland areas constant at global levelSchader et al. 2015488
25/05/2017Overview of resultsTake Home MessagesSeveral human-inedible resources are available and a number of suchnovel feed resource will be available in the future. Research isrequired to increase availability of such feed resourcesOpportunities exist to convert food waste and loss to animal feedand to learn from East Asian countriesWe need to think efficiency in multi-dimension (taking efficiencyunits in all three-P dimensions), so that LPS can be presented inthe right perspective.49Take Home MessagesImproving efficiency of animal food production, distributionand use as well as decreasing their consumption would besome important steps towards sustainable food productionsystems of the futureOnly Sound Science can Lead to Sound PoliciesResearch and innovations towards use of human-inediblefeeds without compromising animal production would leadto more sustainable food systems9
Seaweeds (macro-algae) Future areas of work: Develop large scale production, harvesting and drying methods Brown algae up to 14% CP Red Algae up to 50% CP Green algae up to 30% CP Rich in bioactive compounds (reduction in enteric methane) Makkar et al. (2016) Pre-biotics: alginates, mannitol, laminarin, fucoidan Source of organic minerals