Transcription
11Emulsion Formation, Stability, and RheologyTharwat F. Tadros1.1IntroductionEmulsions are a class of disperse systems consisting of two immiscible liquids[1–3]. The liquid droplets (the disperse phase) are dispersed in a liquid medium(the continuous phase). Several classes may be distinguished: oil-in-water (O/W),water-in-oil (W/O), and oil-in-oil (O/O). The latter class may be exemplified by anemulsion consisting of a polar oil (e.g., propylene glycol) dispersed in a nonpolaroil (paraffinic oil) and vice versa. To disperse two immiscible liquids, one needs athird component, namely, the emulsifier. The choice of the emulsifier is crucial inthe formation of the emulsion and its long-term stability [1–3].Emulsions may be classified according to the nature of the emulsifier or thestructure of the system. This is illustrated in Table 1.1.1.1.1Nature of the EmulsifierThe simplest type is ions such as OH that can be specifically adsorbed onthe emulsion droplet thus producing a charge. An electrical double layer can beproduced, which provides electrostatic repulsion. This has been demonstratedwith very dilute O/W emulsions by removing any acidity. Clearly that process isnot practical. The most effective emulsifiers are nonionic surfactants that can beused to emulsify O/W or W/O. In addition, they can stabilize the emulsion againstflocculation and coalescence. Ionic surfactants such as sodium dodecyl sulfate (SDS)can also be used as emulsifiers (for O/W), but the system is sensitive to the presenceof electrolytes. Surfactant mixtures, for example, ionic and nonionic, or mixturesof nonionic surfactants can be more effective in emulsification and stabilization ofthe emulsion. Nonionic polymers, sometimes referred to as polymeric surfactants,for example, Pluronics, are more effective in stabilization of the emulsion, but theymay suffer from the difficulty of emulsification (to produce small droplets) unlesshigh energy is applied for the process. Polyelectrolytes such as poly(methacrylicEmulsion Formation and Stability, First Edition. Edited by Tharwat F. Tadros. 2013 Wiley-VCH Verlag GmbH & Co. KGaA. Published 2013 by Wiley-VCH Verlag GmbH & Co. KGaA.
21 Emulsion Formation, Stability, and RheologyTable 1.1Classification of emulsion types.Nature of emulsifierStructure of the systemSimple molecules and ionsNonionic surfactantsSurfactant mixturesIonic surfactantsNonionic polymersPolyelectrolytesMixed polymers and surfactantsLiquid crystalline phasesSolid particlesNature of internal and external phase: O/W, W/O—Micellar emulsions (microemulsions)MacroemulsionsBilayer dropletsDouble and multiple emulsionsMixed emulsions——acid) can also be applied as emulsifiers. Mixtures of polymers and surfactantsare ideal in achieving ease of emulsification and stabilization of the emulsion.Lamellar liquid crystalline phases that can be produced using surfactant mixturesare very effective in emulsion stabilization. Solid particles that can accumulate atthe O/W interface can also be used for emulsion stabilization. These are referred toas Pickering emulsions, whereby particles are made partially wetted by the oil phaseand by the aqueous phase.1.1.2Structure of the System1) O/W and W/O macroemulsions: These usually have a size range of 0.1–5 μmwith an average of 1–2 μm.2) Nanoemulsions: these usually have a size range of 20–100 nm. Similar tomacroemulsions, they are only kinetically stable.3) Micellar emulsions or microemulsions: these usually have the size range of5–50 nm. They are thermodynamically stable.4) Double and multiple emulsions: these are emulsions-of-emulsions, W/O/W,and O/W/O systems.5) Mixed emulsions: these are systems consisting of two different dispersedroplets that do not mix in a continuous medium. This chapter only deals withmacroemulsions.Several breakdown processes may occur on storage depending on particle sizedistribution and density difference between the droplets and the medium. Magnitude of the attractive versus repulsive forces determines flocculation. Solubility ofthe disperse droplets and the particle size distribution determine Ostwald ripening.Stability of the liquid film between the droplets determines coalescence. The otherprocess is phase inversion.
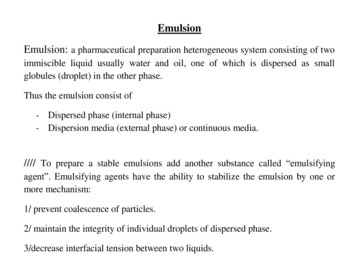
1.1 Introduction1.1.3Breakdown Processes in EmulsionsThe various breakdown processes are illustrated in Figure 1.1. The physical phenomena involved in each breakdown process are not simple, and it requires analysisof the various surface forces involved. In addition, the above-mentioned processesmay take place simultaneously rather than consecutively and this complicates theanalysis. Model emulsions, with monodisperse droplets, cannot be easily produced,and hence, any theoretical treatment must take into account the effect of dropletsize distribution. Theories that take into account the polydispersity of the systemare complex, and in many cases, only numerical solutions are possible. In addition,measurements of surfactant and polymer adsorption in an emulsion are not easyand one has to extract such information from measurement at a planer interface.In the following sections, a summary of each of the above-mentioned breakdownprocesses and details of each process and methods of its prevention are given.1.1.4Creaming and SedimentationThis process results from external forces usually gravitational or centrifugal. Whensuch forces exceed the thermal motion of the droplets (Brownain motion), aconcentration gradient builds up in the system with the larger droplets movingfaster to the top (if their density is lower than that of the medium) or to the bottom(if their density is larger than that of the medium) of the container. In the limitingcases, the droplets may form a close-packed (random or ordered) array at the top orbottom of the system with the remainder of the volume occupied by the continuousliquid phase.Creaminge nasPh ersiovinFigure 1.1SedimentationCoalescenceionlatcucFloOsrip twaldeningSchematic representation of the various breakdown processes in emulsions.3
41 Emulsion Formation, Stability, and Rheology1.1.5FlocculationThis process refers to aggregation of the droplets (without any change in primarydroplet size) into larger units. It is the result of the van der Waals attraction that isuniversal with all disperse systems. Flocculation occurs when there is not sufficientrepulsion to keep the droplets apart to distances where the van der Waals attractionis weak. Flocculation may be ‘‘strong’’ or ‘‘weak,’’ depending on the magnitude ofthe attractive energy involved.1.1.6Ostwald Ripening (Disproportionation)This results from the finite solubility of the liquid phases. Liquids that are referredto as being immiscible often have mutual solubilities that are not negligible. Withemulsions, which are usually polydisperse, the smaller droplets will have largersolubility when compared with the larger ones (due to curvature effects). Withtime, the smaller droplets disappear and their molecules diffuse to the bulk andbecome deposited on the larger droplets. With time, the droplet size distributionshifts to larger values.1.1.7CoalescenceThis refers to the process of thinning and disruption of the liquid film betweenthe droplets with the result of fusion of two or more droplets into larger ones.The limiting case for coalescence is the complete separation of the emulsion intotwo distinct liquid phases. The driving force for coalescence is the surface or filmfluctuations which results in close approach of the droplets whereby the van derWaals forces is strong thus preventing their separation.1.1.8Phase InversionThis refers to the process whereby there will be an exchange between the dispersephase and the medium. For example, an O/W emulsion may with time or changeof conditions invert to a W/O emulsion. In many cases, phase inversion passesthrough a transition state whereby multiple emulsions are produced.1.2Industrial Applications of EmulsionsSeveral industrial systems consist of emulsions of which the following is worthmentioning: food emulsion, for example, mayonnaise, salad creams, deserts, and
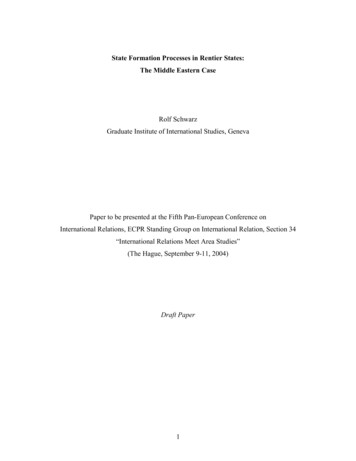
1.3 Physical Chemistry of Emulsion Systemsbeverages; personal care and cosmetics, for example, hand creams, lotions, hairsprays, and sunscreens; agrochemicals, for example, self-emulsifiable oils whichproduce emulsions on dilution with water, emulsion concentrates (EWs), andcrop oil sprays; pharmaceuticals, for example, anesthetics of O/W emulsions,lipid emulsions, and double and multiple emulsions; and paints, for example,emulsions of alkyd resins and latex emulsions. Dry cleaning formulations – thismay contain water droplets emulsified in the dry cleaning oil which is necessary toremove soils and clays. Bitumen emulsions: these are emulsions prepared stablein the containers, but when applied the road chippings, they must coalesce toform a uniform film of bitumen. Emulsions in the oil industry: many crude oilscontain water droplets (for example, the North sea oil) and these must be removedby coalescence followed by separation. Oil slick dispersions: the oil spilled fromtankers must be emulsified and then separated. Emulsification of unwanted oil:this is an important process for pollution control.The above importance of emulsion in industry justifies a great deal of basicresearch to understand the origin of instability and methods to prevent their breakdown. Unfortunately, fundamental research on emulsions is not easy becausemodel systems (e.g., with monodisperse droplets) are difficult to produce. In manycases, theories on emulsion stability are not exact and semiempirical approachesare used.1.3Physical Chemistry of Emulsion Systems1.3.1The Interface (Gibbs Dividing Line)An interface between two bulk phases, for example, liquid and air (or liquid/vapor),or two immiscible liquids (oil/water) may be defined provided that a dividing lineis introduced (Figure 1.2). The interfacial region is not a layer that is one-moleculethick. It is a region with thickness δ with properties different from the two bulkphases α and β.UniformthermodynamicpropertiesMathematical dividingplane Z σ(Gibbs dividing line)UniformthermodynamicpropertiesFigure 1.2The Gibbs dividing line.5
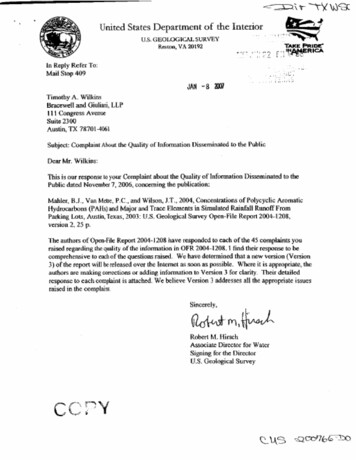
61 Emulsion Formation, Stability, and RheologyUsing Gibbs model, it is possible to obtain a definition of the surface or interfacialtension γ .The surface free energy dGσ is made of three components: an entropy termSσ dT, an interfacial energy term Adγ , and a composition term ni dμi (ni is thenumber of moles of component i with chemical potential μi ). The Gibbs–Deuhemequation is dGσ Sσ dT Adγ ni dμi(1.1)At constant temperature and compositiondGσ Adγ σ Gγ A T,n(1.2)iFor a stable interface, γ is positive, that is, if the interfacial area increases Gσincreases. Note that γ is energy per unit area (mJ m 2 ), which is dimensionallyequivalent to force per unit length (mN m 1 ), the unit usually used to definesurface or interfacial tension.For a curved interface, one should consider the effect of the radius of curvature.Fortunately, γ for a curved interface is estimated to be very close to that of a planersurface, unless the droplets are very small ( 10 nm). Curved interfaces producesome other important physical phenomena that affect emulsion properties, forexample, the Laplace pressure p, which is determined by the radii of curvature ofthe droplets 11 p γ (1.3)r1r2where r1 and r2 are the two principal radii of curvature.For a perfectly spherical droplet, r1 r2 r and p 2γr(1.4)For a hydrocarbon droplet with radius 100 nm, and γ 50 mN m 1 , p 106 Pa(10 atm).1.4Thermodynamics of Emulsion Formation and BreakdownConsider a system in which an oil is represented by a large drop 2 of area A1immersed in a liquid 2, which is now subdivided into a large number of smallerdroplets with total area A2 (A2 A1 ) as shown in Figure 1.3. The interfacial tensionγ12 is the same for the large and smaller droplets because the latter are generally inthe region of 0.1 to few micrometers.The change in free energy in going from state I to state II is made from twocontributions: A surface energy term (that is positive) that is equal to Aγ12(where A A2 A1 ). An entropy of dispersions term that is also positive
1.4 Thermodynamics of Emulsion Formation and Breakdown2Formation12Breakdown(flocc coal)IFigure 1.31IISchematic representation of emulsion formation and breakdown.G IVG IIGIG IIIII or IVI or IIIFigure 1.4 Free energy path in emulsion breakdown – (straight line) Flocc. coal.;(dashed line) Flocc. coal. Sed.; and (dotted line) Flocc. coal. sed. Ostwaldripening.(since producing a large number of droplets is accompanied by an increase inconfigurational entropy), which is equal to T Sconf .From the second law of thermodynamics Gform Aγ12 T Sconf(1.5)In most cases, Aγ12 T Sconf , which means that Gform is positive, that is, theformation of emulsions is nonspontaneous and the system is thermodynamicallyunstable. In the absence of any stabilization mechanism, the emulsion will break byflocculation, coalescence, Ostwald ripening, or combination of all these processes.This is illustrated in Figure 1.4 that shows several paths for emulsion breakdownprocesses.In the presence of a stabilizer (surfactant and/or polymer), an energy barrier iscreated between the droplets, and therefore, the reversal from state II to state Ibecomes noncontinuous as a result of the presence of these energy barriers. Thisis illustrated in Figure 1.5. In the presence of the above energy barriers, the systembecomes kinetically stable.7
81 Emulsion Formation, Stability, and RheologyΔGfloccaG IIΔGcoalaΔGfloccΔGbreakGVΔGcoalGIIIVIFigure 1.5 Schematic representation of free energy path for breakdown (flocculation andcoalescence) for systems containing an energy barrier.1.5Interaction Energies (Forces) between Emulsion Droplets and Their CombinationsGenerally speaking, there are three main interaction energies (forces) betweenemulsion droplets and these are discussed in the following sections.1.5.1van der Waals AttractionThe van der Waals attraction between atoms or molecules is of three different types:dipole–dipole (Keesom), dipole-induced dipole (Debye), and dispersion (London)interactions. The Keesom and Debye attraction forces are vectors, and althoughdipole–dipole or dipole-induced dipole attraction is large, they tend to cancelbecause of the different orientations of the dipoles. Thus, the most important arethe London dispersion interactions that arise from charge fluctuations. With atomsor molecules consisting of a nucleus and electrons that are continuously rotatingaround the nucleus, a temporary dipole is created as a result of charge fluctuations.This temporary dipole induces another dipole in the adjacent atom or molecule.The interaction energy between two atoms or molecules Ga is short range and isinversely proportional to the sixth power of the separation distance r between theatoms or moleculesβ(1.6)Ga 6rwhere β is the London dispersion constant that is determined by the polarizabilityof the atom or molecule.Hamaker [4] suggested that the London dispersion interactions between atomsor molecules in macroscopic bodies (such as emulsion droplets) can be addedresulting in strong van der Waals attraction, particularly at close distances of
1.5 Interaction Energies (Forces) between Emulsion Droplets and Their CombinationshGABornrepulsionFigure 1.6Variation of the van der Waals attraction energy with separation distance.separation between the droplets. For two droplets with equal radii R, at a separationdistance h, the van der Waals attraction GA is given by the following equation (dueto Hamaker)AR12hwhere A is the effective Hamaker constant 21/21/2A A11 A22GA (1.7)(1.8)where A11 and A22 are the Hamaker constants of droplets and dispersion medium,respectively.The Hamaker constant of any material depends on the number of atoms ormolecules per unit volume q and the London dispersion constant βA π 2 q2 β(1.9)GA increases very rapidly with decrease of h (at close approach). This is illustratedin Figure 1.6 that shows the van der Waals energy–distance curve for two emulsiondroplets with separation distance h.In the absence of any repulsion, flocculation is very fast producing large clusters.To counteract the van der Waals attraction, it is necessary to create a repulsiveforce. Two main types of repulsion can be distinguished depending on the natureof the emulsifier used: electrostatic (due to the creation of double layers) and steric(due to the presence of adsorbed surfactant or polymer layers.1.5.2Electrostatic RepulsionThis can be produced by adsorption of an ionic surfactant as shown in Figure 1.7,which shows a schematic picture of the structure of the double layer according to9
101 Emulsion Formation, Stability, and Rheologyso ssYo Ydso ss sdss Charge due tospecifically adsorbedcounterions sd Stern plane xFigure 1.7 Schematic representation of double layers produced by adsorption of an ionicsurfactant.Gouy–Chapman and Stern pictures [3]. The surface potential ψo decreases linearlyto ψd (Stern or zeta potential) and then exponentially with increase of distance x.The double-layer extension depends on electrolyte concentration and valency (thelower the electrolyte concentration and the lower the valency the more extendedthe double layer is).When charged colloidal particles in a dispersion approach each other such thatthe double layer begins to overlap (particle separation becomes less than twicethe double-layer extension), repulsion occurs. The individual double layers can nolonger develop unrestrictedly because the limited space does not allow completepotential decay [3, 4]. This is illustrated in Figure 1.8 for two flat, which clearlyshows that when the separation distance h between the emulsion droplets becomessmaller than twice the double-layer extension, the potential at the midplane betweenthe surfaces is not equal to zero (which would be the case when h is larger thantwice the double-layer extension) plates.The repulsive interaction Gel is given by the following expression: Gel 2πRεr εo ψo2 ln 1 exp( κh)(1.10)where εr is the relative permittivity and εo is the permittivity of free space. κ is theDebye–Hückel parameter; 1/κ is the extension of the double layer (double-layerthickness) that is given by the expression εr εo kT1 (1.11)κ2no Zi2 e2where k is the Boltzmann constant, T is the absolute temperature, no is the numberof ions per unit volume of each type present in bulk solution, Zi is the valency ofthe ions, and e is the electronic charge.YdYdYH/2x oFigure 1.8x H/2x HSchematic representation of double-layer overlap.
1.5 Interaction Energies (Forces) between Emulsion Droplets and Their CombinationsValues of 1/κ at various 1 : 1 electrolyte concentrations are given below10 5100C (mol dm –3 )1/κ(nm)10 43310 31010 23.310 11The double-layer extension decreases with increase of electrolyte concentration.This means that the repulsion decreases with increase of electrolyte concentrationas illustrated in Figure 1.9GT Gel GA(1.12)A schematic representation of the force (energy)–distance curve according to theDerjaguin, Landau, Verwey, and Overbeek (DLVO) theory is given in Figure 1.10.The above presentation is for a system at low electrolyte concentration. Atlarge h, attraction prevails resulting in a shallow minimum (Gsec ) of the orderof few kilotesla units. At very short h, VA Gel , resulting in a deep primaryminimum (several hundred kilotesla units). At intermediate h, Gel GA , resultingin a maximum (energy barrier) whose height depends on ψo (or ζ ) and electrolyteconcentration and valency – the energy maximum is usually kept 25 kT units.Low electrolyteLow KGelHigh electrolyteHigh khFigure 1.9GVariation of Gel with h at low and high electrolyte concentrations.GTGeGmaxhGAGsecGprimaryFigure 1.10 Total energy–distance curve according to the DLVO theory.11
121 Emulsion Formation, Stability, and RheologyThe energy maximum prevents close approach of the droplets, and flocculationinto the primary minimum is prevented. The higher the value of ψo and thelower the electrolyte concentration and valency, the higher the energy maximum.At intermediate electrolyte concentrations, weak flocculation into the secondaryminimum may occur.Combination of van der Waals attraction and double-layer repulsion results inthe well-known theory of colloid stability due to DLVO theory [5, 6].1.5.3Steric RepulsionThis is produced by using nonionic surfactants or polymers, for example, alcohol ethoxylates, or A-B-A block copolymers PEO-PPO-PEO (where PEO refersto polyethylene oxide and PPO refers to polypropylene oxide), as illustrated inFigure 1.11.The ‘‘thick’’ hydrophilic chains (PEO in water) produce repulsion as a result oftwo main effects [7]:1) Unfavorable mixing of the PEO chains, when these are in good solventconditions (moderate electrolyte and low temperatures). This is referred to asthe osmotic or mixing free energy of interaction that is given by the expression 4πh 21hGmix χδ (1.13)ϕ22 Nav3R 2δ kTV1222V1 is the molar volume of the solvent, φ2 is the volume fraction of the polymerchain with a thickness δ, and χ is the Flory–Huggins interaction parameter.When χ 0.5, Gmix is positive and the interaction is repulsive. When χ 0.5,Gmix is negative and the interaction is attractive. When χ 0.5, Gmix 0 andthis is referred to as the θ -condition.2) Entropic, volume restriction, or elastic interaction, Gel .This results from the loss in configurational entropy of the chains on significantoverlap. Entropy loss is unfavorable and, therefore, Gel is always positive.Combination of Gmix , Gel with GA gives the total energy of interaction GT (theoryof steric stabilization)GT Gmix Gel GA(1.14)PEOPEOPPOAlkyl chainFigure 1.11Schematic representation of adsorbed layers.
1.5 Interaction Energies (Forces) between Emulsion Droplets and Their CombinationsGelGmixGTGd2dhGminGAFigure 1.12 Schematic representation of the energy–distance curve for a sterically stabilized emulsion.A schematic representation of the variation of Gmix , Gel , and GA with h is givenin Figure 1.12. Gmix increases very sharply with decrease of h when the latterbecomes less than 2δ. Gel increases very sharply with decrease of h when the latterbecomes smaller than δ. GT increases very sharply with decrease of h when thelatter becomes less than 2δ.Figure 1.12 shows that there is only one minimum (Gmin ) whose depth dependson R, δ, and A. At a given droplet size and Hamaker constant, the larger theadsorbed layer thickness, the smaller the depth of the minimum. If Gmin ismade sufficiently small (large δ and small R), one may approach thermodynamicstability. This is illustrated in Figure 1.13 that shows the energy–distance curvesas a function of δ/R. The larger the value of δ/R, the smaller the value of Gmin .In this case, the system may approach thermodynamic stability as is the case withnanodispersions.Increasing d/RGTGminhFigure 1.13 Variation of GT with h at various δ/R values.13
141 Emulsion Formation, Stability, and Rheology1.6Adsorption of Surfactants at the Liquid/Liquid InterfaceSurfactants accumulate at interfaces, a process described as adsorption. Thesimplest interfaces are the air/water (A/W) and O/W. The surfactant moleculeorients itself at the interface with the hydrophobic portion orienting towardthe hydrophobic phase (air or oil) and the hydrophilic portion orienting at thehydrophilic phase (water). This is schematically illustrated in Figure 1.14. As aresult of adsorption, the surface tension of water is reduced from its value of72 mN m 1 before adsorption to 30–40 mN m 1 and the interfacial tension forthe O/W system decreases from its value of 50 mN m 1 (for an alkane oil) beforeadsorption to a value of 1–10 mN m 1 depending on the nature of the surfactant.Two approaches can be applied to treat surfactant adsorption at the A/L and L/Linterface [3]: Gibbs approach treats the process as an equilibrium phenomenon.In this case, one can apply the second law of thermodynamics. Equation of stateapproach whereby the surfactant film is treated as a ‘‘two-dimensional’’ layer witha surface pressure π. The Gibbs approach allows one to obtain the surfactantadsorption from surface tension measurements. The equation of state approachallows one to study the surfactant orientation at the interface. In this section, onlythe Gibbs approach is described.1.6.1The Gibbs Adsorption IsothermGibbs derived a thermodynamic relationship between the variation of surface orinterfacial tension with concentration and the amount of surfactant adsorbed (moles per unit area), referred to as the surface excess. At equilibrium, the Gibbsfree energy dGσ 0 and the Gibbs–Deuhem equation becomes dGσ Sσ dT Adγ nσi dμi 0(1.15)At constant temperature Adγ nσi dμiordγ nσiAHydrophobic portionAirWaterdμi iσ dμi(1.17)Hydrophobic portionOilWaterHydrophilic portionFigure 1.14(1.16)Hydrophilic portionSchematic representation of orientation of surfactant molecules.
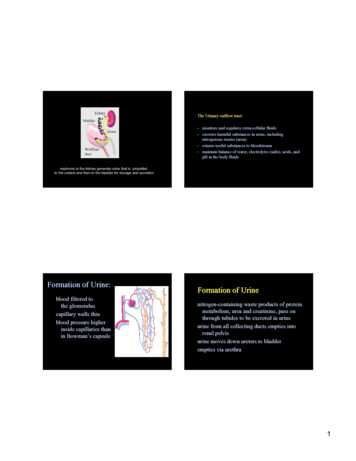
1.6 Adsorption of Surfactants at the Liquid/Liquid InterfaceFor a surfactant (component 2) adsorbed at the surface of a solvent (component 1) dγ 1σ dμ1 2σ dμ2(1.18)If the Gibbs dividing surface is used and the assumption 1σ 0 is madeσdμ2 dγ 2,1(1.19)The chemical potential of the surfactant μ2 is given by the expressionμ2 μ02 RT ln aL2(1.20)where μ02 is the standard chemical potential and aL2 is the activity of surfactant thatis equal to C2 f2 x2 f2 where C2 is the concentration in moles per cubic decimeterand x2 is the mole fraction that is equal to C2 /(C2 55.5) for a dilute solution, andf2 is the activity coefficient that is also 1 in dilute solutions.Differentiating Eq. (1.20), one obtainsdμ2 RTd ln aL2(1.21)Combining Eqs. (1.19) and (1.21),σRTd ln aL2 dγ 2,1(1.22)dγL RT 2,1d ln aL2(1.23)orIn dilute solutions, f2 1 anddγ 2 RTd ln C2(1.24)Equations (1.23) and (1.24) are referred to as the Gibbs adsorption equations, whichshow that 2 can be determined from the experimental results of variation of γwith log C2 as illustrated in Figure 1.15 for the A/W and O/W interfaces. 2 can be calculated from the linear portion of the γ - log C curve just before thecritical micelle concentration (cmc)Slope 72dγ 2.303 2 RTd log C2A/Wg/m N m 150(1.25)O/Wg/m N m 1CMCLog CCMCLog CFigure 1.15 Surface or interfacial tension – log C curves.15
161 Emulsion Formation, Stability, and RheologyFrom 2 , the area per molecule of surfactant (or ion) can be calculatedArea/molecule 10181m2 nm2 2 Nav 2 Nav(1.26)Nav is Avogadro’s constant that is equal to 6.023 1023 .The area per surfactant ion or molecule gives information on the orientation ofthe ion or molecule at the interface. The area depends on whether the moleculeslie flat or vertical at the interface. It also depends on the length of the alkyl chainlength (if the molecules lie flat) or the cross-sectional area of the head group (ifthe molecules lie vertical. For example, for an ionic surfactant such as SDS, thearea per molecule depends on the orientation. If the molecule lies flat, the area isdetermined by the area occupied by the alkyl chain and that by the sulfate headgroup. In this case, the area per molecule increases with increase in the alkyl chainlength and will be in the range of 1–2 nm2 . In contrast, for vertical orientation,the area per molecule is determined by the cross-sectional area of the sulfategroup, which is 0.4 nm2 and virtually independent of the alkyl chain length.Addition of electrolytes screens the charge on the head group and hence the areaper molecule decreases. For nonionic surfactants such as alcohol ethoxylates, thearea per molecule for flat orientation is determined by the length of the alkyl chainand the number of ethylene oxide (EO) units. For vertical orientation, the areaper molecule is determined by the cross-sectional area of the PEO chain and thisincreases with increase in the number of EO units.At concentrations just before the break point, the slope of the γ - log C curve isconstant γ constant(1.27) log C2This indicates that saturation of the interface occurs just below the cmc.Above the break point (C cmc), the slope is 0, γ 0 log C2orγ constant log C2(1.28)(1.29)As γ remains constant above the cmc, then C2 or a2 of the monomer must remainconstant.Addition of surfactant molecules above the cmc must result in association toform micelles that have low activity, and hence, a2 remains virtually constant.The hydrophilic head group of the surfactant molecule can also affect itsadsorption. These head groups can be unionized, for example, alcohol or PEO;weakly ionized, for example, COOH; or strongly ionized, for example, sulfates O SO 3 , sulfonates SO3 , or ammonium salts N (CH3 )3 . The adsorption ofthe different surfactants at the A/W and O/W interface depends on the nature ofthe head group. With nonionic surfactants, repulsion between the head groups issmaller than with ionic head groups and adsorption occurs from dilute solutions; the
1.6 Adsorption of Surfactants at the Liquid/Liquid Interfacecmc is low, typically 10 5 to 10 4 mol dm 3 . Nonionic surfactants with mediumPEO form closely packed layers at C cmc. Adsorption is slightly affectedby moderate addition of electrolytes or change in the pH. Nonionic surfactantadsorption is relatively simple and can be described by the Gibbs adsorptionequation.With ionic surfactants, adsorption is more complicated depending on the repulsion between the head groups and addition of indifferent electrolyte. The Gibbsadsorption equation has to be solved to take into account the adsorption of thecounterions and any indifferent electrolyte ions. For a strong surfactant electrolyte such as R O SO 3 Na (R Na ) γ1 2 (1.30)2RT ln a The factor 2 in Eq. (1.30) arises because both
the formation of the emulsion and its long-term stability [1–3]. Emulsions may be classified according to the nature of the emulsifier or the structure of the system. This is illustrated in Table 1.1. 1.1.1 Nature of the Emulsifier ThesimplesttypeisionssuchasOH that can be specifica