Transcription
Statistical bulletinUK services producer price indices: July toSept 2016Quarterly estimates of price changes for services provided by UK businesses to otherUK businesses and government, for a limited range of service industries.Contact:James Wellssppi@ons.gsi.gov.ukRelease date:23 November 2016Next release:22 February 2017Table of contents1. Main points2. National Statistics re-assessment by the UK Statistics Authority3. What is services producer price inflation?4. Summary5. Annual inflation6. Quarterly inflation7. Economic context8. Net sector9. Quality and methodology10. Planned changes to methods for Producer Prices Index and Services Producer Prices Index11. Background notesPage 1 of 22
1 . Main pointsThe price of services sold by UK companies, as estimated by the Services Producer Price Index (SPPI),increased 1.8% in the year to Quarter 3 (July to Sept) of 2016, compared with an increase of 1.5% in the year toQuarter 2 (Apr to June) of 2016.Between Quarters 2 and 3 of 2016, SPPI rose by 0.4%, compared with an increase of 0.6% between Quarters 1(Jan to Mar) and 2 of 2016.Information and communication activities showed the largest upward contribution to the annual and quarterlyrates. Prices increased by 3.2% in the year to Quarter 3 of 2016 and 0.5% between Quarters 2 and 3 of 2016.Water supply, sewerage and waste management services showed the only downward contribution to the annualrate, decreasing by 1.5% in the year to Quarter 3 of 2016.2 . National Statistics re-assessment by the UK StatisticsAuthorityFollowing the re-assessment of services producer price indices it has been confirmed as a National Statistic Assessment of Services Producer Price Indices .3 . What is services producer price inflation?The Services Producer Price Indices (SPPI) provides a measure of inflation for the UK service sector. It isconstructed from a statutory quarterly survey which measures changes in the price received for selected servicesprovided by UK businesses to other UK businesses and government. Individual SPPIs are available whichprovide information on price change for a selection of service industries. These individual price indices are alsoaggregated together to create a service industry SPPI with limited coverage (it does not provide full coverage ofthe “service sector”).The primary use of the SPPI is as a deflator in the UK National Accounts. However, it is also important as aninflationary measure to inform monetary policy and to account for inflation in long-term service procurementcontracts. For more information on the use made of SPPI please see the separate document Users of ServicesProducer Price Index data .The figures presented in this statistical bulletin are considered provisional for the latest 2 quarters (Quarters 2and 3 of 2016) and may be revised as late data is received.None of the indices presented in this bulletin are seasonally adjusted.Page 2 of 22
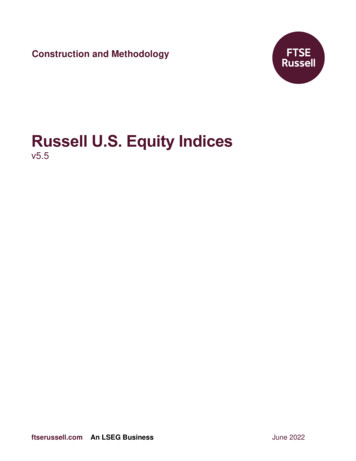
Coverage of SPPIThe service sector is estimated to account for around 78% of the UK economy based on its weight in grossdomestic product (GDP). We do not produce an index for every industry in the service sector and so the SPPI isa partial, best estimate, of the overall inflation to UK businesses in the service sector. The SPPIs presented inthis statistical bulletin are estimated to represent 59% of the total service sector at industry level. The SPPI'scoverage of the service sector at standard industrial classification (SIC) class, division and section level isavailable in the SPPI coverage document . As resources allow, we will continue to review the existing indices andexpand coverage through developing indices for new industries. As such, the SPPI will change composition fromtime to time but will always remain our best estimate of inflation in the UK service sector. The fact that coveragemay change over time should be considered when deciding which indices best meet your needs.4 . SummaryBetween early-2006 and mid-2008, the annual rate of inflation in the service sector, as estimated by the ServicesProducer Price Index (SPPI), rose steadily from an annual rate of 2.4% in Quarter 1 (Jan to Mar) of 2006 to apeak of 3.7% during Quarters 1 and 2 (Apr to June) of 2008. At the end of 2008, the rate of inflation fell rapidly,from annual inflation of 3.6% in Quarter 3 (July to Sept) of 2008 to deflation (prices lower than they were in thesame quarter of the previous year) of 1.6% in Quarter 3 of 2009.The annual rate of inflation began to move in an upward direction at the end of 2009, reaching a post-economicdownturn high of 1.8% in Quarter 2 of 2010. In the year to Quarter 3 of 2016, prices increased by 1.8%, which isthe largest increase seen since Quarter 2 of 2010 (Figure 1).Looking at the latest estimates (Table 1) of the SPPI for Quarter 3 of 2016, the main movements were:prices received by UK service providers increased 1.8% in the year to Quarter 3 of 2016, up from anincrease of 1.5% in the year to Quarter 2 of 2016the main upward contributions to the annual rate came from increases in the prices charged for informationand communication, and professional, scientific and technical activitiesservices prices rose 0.4% between Quarters 2 and 3 of 2016, compared with an increase of 0.6% betweenQuarters 1 and 2 of 2016the main upward contributions to the quarterly rate of inflation came from information and communication,accommodation and food service activities and transportation and storage activitiesPage 3 of 22
Table 1: Output prices (gross sector) - Services Producer Price Index 1,2,3Quarter 1 (Jan to Mar) 2012 to Quarter 3 (Jul to Sep) 2016, UK20122013201420152016Percentage .30.5Q21.50.6Q31.80.4Source: Services Producer Price Indicies (SPPI) - Office for National StatisticsNotes:1. The SPPI is calculated on a gross sector basis.2. The SPPI is an aggregate of the individual industry level SPPIs (excluding Financial Intermediation)published in the SPPI Statistical Bulletin. It does not provide full coverage of the service sector.3. Q1 refers to Quarter 1 (January to March), Q2 refers to Quarter 2 (April to June), Q3 refers to Quarter 3(July to September) and Q4 refers to Quarter 4 (October to December).Page 4 of 22
Figure 1: Services Producer Price Index 1,2,3Quarter 3 (July to Sept) 2006 to Quarter 3 (July to Sept) 2016, UKSource: Services Producer Price Indices (SPPI) - Office for National StatisticsNotes:1. The SPPI is calculated on a gross sector basis.2. The SPPI is an aggregate of the individual industry level SPPIs (excluding financial intermediation)published in the SPPI statistical bulletin. It does not provide full coverage of the service sector.3. Q1 refers to Quarter 1 (January to March), Q2 refers to Quarter 2 (April to June), Q3 refers to Quarter 3(July to September) and Q4 refers to Quarter 4 (October to December).5 . Annual inflationThe Services Producer Price Index (SPPI) rose by 1.8% in the year to Quarter 3 (July to Sept) of 2016, up froman increase of 1.5% in the year to Quarter 2 (Apr to June) of 2016. Of the 10 sections (as defined by the 2007Standard Industrial Classification ) that are combined to form the SPPI, 9 showed price increases.The main upward contributions to the annual rate of the SPPI came from information and communication, andprofessional, scientific and technical activities. These increased 3.2% and 2.0% respectively, in the year toQuarter 3 of 2016, compared with increases of 3.3% and 1.8% in the year to Quarter 2 of 2016. Transportationand storage activities also had a notable contribution to the increase of the index in the year to Quarter 3 of 2016,increasing by 1.0%, up from 0.8% in the year to Quarter 2 of 2016.The only section to show a decrease was water supply, sewerage and waste management services where pricesfell by 1.5% in the year to Quarter 3 of 2016, compared with a decrease of 3.9% in the year to Quarter 2 of 2016(Table 2 and Figure 2).Page 5 of 22
Table 2: Annual growth in Services Producer Price Index (percentage change, latest quarter oncorresponding quarter of previous year) 1Quarter 3 (Jul to Sep) 2016, UKSectionAnnual percentage changeWater supply, sewerage and waste management-1.5Repair and maintenance of motor vehicles1.5Transportation and storage1.0Accommodation and food1.9Information and communication3.2Real estate activities2.8Professional, scientific and technical activities2.0Administrative and support services0.8Education0.8Other services2.8SPPI1.8Source: Services Producer Price Indicies (SPPI) - Office for National StatisticsNotes:1. The section level SPPIs are an aggregate of individual industry level SPPIs (excluding FinancialIntermediation) published in the SPPI Statistical Bulletin. They do not provide full coverage of the servicesector.Page 6 of 22
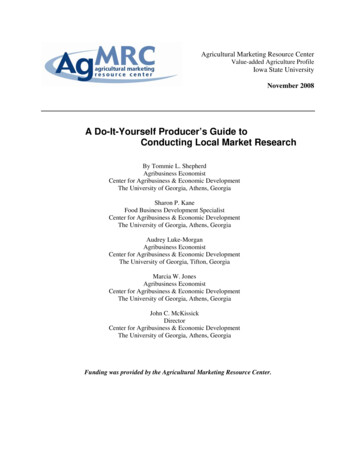
Figure 2: Contribution to Services Producer Price Index annual growth rate 1Quarter 3 (July to Sept) 2016, UKSource: Services Producer Price Indices (SPPI) - Office for National StatisticsNotes:1. The section level SPPIs are an aggregate of individual industry level SPPIs (excluding financialintermediation) published in the SPPI statistical bulletin. They do not provide full coverage of the servicesector.Information and communication activities prices increased by 3.2% in the year to Quarter 3 of 2016. Prices rosein all indices within this section, but the largest contributions to the rise were seen in business telecoms andcomputer software. Business telecoms prices increased by 5.7% in the year to Quarter 3 of 2016, compared withan increase of 7.7% in the year to Quarter 2 of 2016. Computer software services increased 2.0% in the year toQuarter 3 of 2016, compared with an increase of 1.5% in the year to Quarter 2 of 2016. This increase is due to arise in the price of maintenance and support of software systems and applications.Professional, scientific and technical activities prices increased 2.0% in the year to Quarter 3 of 2016. Increasesin the prices of accountancy services, business and management consultancy services and legal servicescontributed towards this increase, with prices increasing 4.1%, 1.7% and 3.5% respectively in the year to Quarter3 of 2016. The increase in the price for accountancy services was due to a rise in the prices for auditing andassurance, that for business and management consultancy services was caused by human resourcesconsultancy and the increase for legal services resulted from price rises in legal advisory and representation forbusiness and commercial.Transportation and storage activities also showed a notable increase in the year to Quarter 3 of 2016, with pricesrising by 1.0%. Business airfares and courier services provided the biggest contributions to the increase.Business airfares increased 3.9% in the year to Quarter 3 of 2016, compared with an increase of 1.3% in the yearto Quarter 2 of 2016. Courier services prices increased 2.9% in the year to Quarter 3 of 2016, compared with anincrease of 3.0% in the year to Quarter 2 of 2016.Page 7 of 22
Water supply, sewerage and waste management services showed the only downward contribution within theSPPI. Prices fell 1.5% in the year to Quarter 3 of 2016, compared with a fall of 3.9% in the year to Quarter 2 of2016. This decrease was largely a result of the fall in prices for sorted recovered materials services, where pricesfell 6.5% in the year to Quarter 3 of 2016, up from a decrease of 15.6% in the year to Quarter 2 of 2016 (Figure3).Figure 3: Services Producer Price Index for sorted recovered materials services 1Quarter 3 (July to Sept) 2011 to Quarter 3 (July to Sept) 2016, UKSource: Services Producer Price Indices (SPPI) - Office for National StatisticsNotes:1. Q1 refers to Quarter 1 (January to March), Q2 refers to Quarter 2 (April to June), Q3 refers to Quarter 3(July to September) and Q4 refers to Quarter 4 (October to December).The SPPI increased 1.8% in the year to Quarter 3 of 2016, compared with an increase of 1.5% in the year toQuarter 2 of 2016. Figure 4 shows how the SPPI sections have contributed towards this 0.3 percentage pointchange.Increases in the prices of water supply, sewerage and waste, vehicle repair and maintenance, transportation andstorage, accommodation and food, professional, scientific and technical and administrative and support serviceswere offset by decreases in the prices of real estate activities, information and communication, and educationservices.Page 8 of 22
Figure 4: Contribution to the change in the 12-month growth rate between Quarter 2 (Apr to June) 2016and Quarter 3 (July to Sept) 2016UKSource: Services Producer Price Indices (SPPI) - Office for National StatisticsNotes:1. The section level SPPIs are an aggregate of individual industry level SPPIs (excluding financialintermediation) published in the SPPI statistical bulletin. They do not provide full coverage of the servicesector.2. Q1 refers to Quarter 1 (January to March), Q2 refers to Quarter 2 (April to June), Q3 refers to Quarter 3(July to September) and Q4 refers to Quarter 4 (October to December).Page 9 of 22
Figure 5: Services Producer Price Index by sectionQuarter 3 (July to Sept) 2012 to Quarter 3 (July to Sept) 2016, UKExamining inflation for each of the sections that contribute to the SPPI reveals a diverse set of trends. Figure 5shows both the range of annual inflation rates experienced by each of the sections since Quarter 3 of 2012 andthe annual rates of inflation for the 2 most recent quarters.One notable difference between each section is the range of inflation rates that have been experienced since2012. Water supply, sewerage and waste management services, accommodation and food, and real estateactivities have experienced a relatively wide range of inflation rates over this period. Although all sections haveexperienced some variance in inflation, certain industries have experienced inflation consistently higher thanothers. Wholesale and retail trade, vehicle repair and maintenance has not experienced inflation lower than 1.5%at any point in the past 5 years, while administrative and support services has not experienced inflation higherthan 1.4%.6 . Quarterly inflationPrices received for the services included in the Services Producer Price Index (SPPI) rose 0.4% betweenQuarters 2 (Apr to June) and 3 (July to Sept) of 2016, compared with an increase of 0.6% between Quarters 1(Jan to Mar) and 2 of 2016. Of the 10 sections that make up the SPPI, 6 showed increases in prices betweenQuarter 2 and 3 of 2016.The largest increase in the quarterly rate came from accommodation and food services, which increased by 1.7%between Quarters 2 and 3 of 2016. The remaining increases were small, ranging from 0.1% to 0.5% (Table 3).Page 10 of 22
Table 3: Quarterly growth in Services Producer Price Index (percentage change, latest quarter onprevious quarter)1Quarter 3 (Jul to Sep) 2016, UKSectionQuarterly percentage changeWater supply, sewerage and waste management0.2Repair and maintenance of motor vehicles0.1Transportation and storage0.4Accommodation and food1.7Information and communication0.5Real estate activities0.0Professional, scientific and technical activities0.0Administrative and support services0.1Education-0.4Other services0.0SPPI0.4Source: Services Producer Price Indicies (SPPI) - Office for National StatisticsNotes:1. The section level SPPIs are an aggregate of individual industry level SPPIs (excluding FinancialIntermediation) published in the SPPI Statistical Bulletin. They do not provide full coverage of the servicesector.Page 11 of 22
Figure 6: Contribution to Services Producer Price Index quarterly growth 1Quarter 3 (July to Sept) 2016, UKSource: Services Producer Price Indices (SPPI) - Office for National StatisticsNotes:1. The section-level SPPIs are an aggregate of the individual industry-level SPPIs (excluding financialintermediation) published in the SPPI statistical bulletin. They do not provide full coverage of the sectionlisted.Information and communication services activities showed the largest contribution to the SPPI rate betweenQuarters 2 and 3 of 2016, with prices rising by 0.5%, compared with an increase of 1.9% between Quarters 1 and2 of 2016. The main contributions to this increase were from computer software prices and book publishingservices, which increased by 0.8% and 0.4%, respectively, between Quarters 2 and 3 of 2016. The movement incomputer software prices was driven by maintenance and support of software systems and applications. Theincrease in the prices of book publishing services was driven by printed general interest journals and periodicals.7 . Economic contextComparison with average weekly earningsThe Services Producer Price Index (SPPI) captures changes in the prices charged by UK business for theprovision of a selection of services to other UK businesses and the public sector. For many services, the cost oflabour is the largest component of the price charged by businesses for providing the service, rather than the costof goods or fuels. As a result, a change in the wage structure of the workforce can have an important impact onthe SPPI. It is expected that the price charged for services should move in a similar way to the wages received bythe UK workforce.Figure 7 shows the annual percentage change of the fees received by UK businesses for the provision ofservices, as estimated by the SPPI, with an indicator of salaries received by the UK workforce who are employedin the service sector, as estimated by the average weekly earnings (AWE) “services” pay index (excludingbonuses).Page 12 of 22
Figure 7: Comparison of Services Producer Price Index and ''service'' Average Weekly Earnings Index 1,2,3Quarter 3 (July to Sept) 2003 to Quarter 3 (July to Sept) 2016, UKSource: Services Producer Price Indices (SPPI) and Annual Weekly Earnings (AWE) - Office for National StatisticsNotes:1. The SPPI includes the water supply; sewerage and waste management sector not included in the AWE.2. The AWE index includes financial and insurance activities, public administration and defence: compulsorysocial security, human health and social work activities and arts, entertainment and recreation sectors notincluded in the SPPI.3. Q1 refers to Quarter 1 (January to March), Q2 refers to Quarter 2 (April to June), Q3 refers to Quarter 3(July to September) and Q4 refers to Quarter 4 (October to December).Figure 7 shows the growth rates of both wages and services prices slowed considerably during 2008 and 2009,with services inflation falling from a four-quarter average of 3.5% in 2008 to minus 0.8% in 2009, while growth inservices wages slowed from 3.9% to 1.9% on a four-quarter average during the same period. Following thedownturn, services prices and wages have followed similar trends, diverging slightly during 2015, as wages grewfaster than services prices from the end of 2014. Looking at the most recent data, while services wages continueto grow faster than services prices in 2016, the gap between both indicators have narrowed compared to 2015. Inthe year to Quarter 3 (July to September) 2016, services wages had grown by 2.3%, compared to servicesprices, which had grown by 1.8% over the same period.The convergence between services wages and services price growth could be partly attributed to the introductionof the national living wage. According to Market/CIPS UK Services report, the increase in services prices inQuarter 3 (August to September) 2016 could be partly explained by the increase in salaries, alongside otherfactors, which is putting an upward pressure on services costs.Page 13 of 22
Alongside the introduction of the national living wage, the rise in the services industry wage growth could alsoreflect the wider tightening in the UK labour market. The unemployment rate amongst those aged 16 and over fellto 4.8% in the 3 months to September 2016, compared to 4.9% in the three months to June 2016, while theemployment rate amongst those aged 16 to 64 remained steady at 74.5% over the same period. Labour demand– as measured by the number of vacancies – has been relatively strong. The number of unemployed people pervacancy has been on a downward trend since 2011, falling from 5.8 in the three months to December 2011 to 2.1in the 3 months to September 2016, indicating that there are fewer unemployed workers for each vacancy. Inrelation to the services industry, the number of vacancies has been rising since mid-2012 and increased by 2.1%in the three months to September 2016, compared with a year earlier.While the tightening labour market could be exerting upward pressure on wages, the productivity of labour couldalso be influencing services price growth. Improvements in productivity creates capacity for output to rise fasterthan the corresponding rise in inputs, thereby allowing firms to produce more output per unit of labour employedand, all else equal, leading to lower unit labour costs. However, services productivity growth has remainedbroadly constant since Quarter 3 (July to September) 2014, increasing by 1.1% in the year to Quarter 2 (April toJune) 2016, while services wages increased by 2.0% over the same period. This means that the unit labour costsin the service sector - the labour cost per unit of output produced – increased by 1.9% in Quarter 2 (April to May)2016.However, although labour cost is a significant factor determining services output prices, competitive pressures willalso have some bearing on services prices, which could be limiting the extent to which businesses can pass onthose increasing labour costs.Comparison with Consumer Prices IndexWhile the SPPI measures the amount received by a company for services they’ve provided to other businesses,the prices paid by households is estimated by the Consumer Prices Index (CPI) . While the costs associated withproviding services to both businesses and households will be broadly similar, there may be different costsassociated with providing services to different customers. Figure 8 shows a comparison with the “all services”sector of the Consumer Prices Index (CPI), which measures the prices paid for services by households.Page 14 of 22
Figure 8: Comparison of Services Producer Price Index and 'all services' Consumer Price Index 1,2,3,4Quarter 3 (July to Sept) 2003 to Quarter 3 (July to Sept) 2016, UKSource: Services Producer Price Indices (SPPI) and Consumer Price Index (CPI) - Office for National StatisticsNotes:1. SPPI measures changes in the price received by a company, CPI measures changes in the price paid by aconsumer. Therefore CPI figures may include taxes and fees that are not retained by the service provider.2. SPPI measures the price received for services provided by UK based suppliers only, excluding importsfrom non-UK suppliers. CPI aims to measure the price paid by consumers in the UK, who may use non-UKbased suppliers.3. SPPI uses standard industrial classification 2007 (SIC 07) to produce its aggregate, CPI uses classificationof individual consumption according to purpose (COICOP). This means that the structure of each indexmay not always correlate at more detailed levels.4. Q1 refers to Quarter 1 (January to March), Q2 refers to Quarter 2 (April to June), Q3 refers to Quarter 3(July to September) and Q4 refers to Quarter 4 (October to December).Generally inflation in the CPI “all services” index runs at a higher rate than the SPPI. Between late 2005 and2008, the gap between the SPPI and CPI annual rates of inflation narrowed before widening again from 2009 topresent. During the economic downturn in 2008 to 2009, the annual rates of inflation for both indices decreased,with prices falling by as much as 1.6% for services sold by UK businesses, while the prices paid by householdscontinued to grow, although at a much lower rate, reaching a low of 2.3% in Quarter 4 (Oct to Dec) of 2009. SinceQuarter 1 of 2010, both indices have shown growth; however, the SPPI has shown significantly lower growth thanCPI.Other measures of service sector inflationThere are other measures of service sector inflation available such as the Chartered Institute of Procurement andSupply (CIPS) Purchasing Managers’ Index and the Confederation of British Industry (CBI) Service SectorSurvey. There are significant methodological differences between these surveys and SPPI; therefore, directcomparisons cannot be made.Page 15 of 22
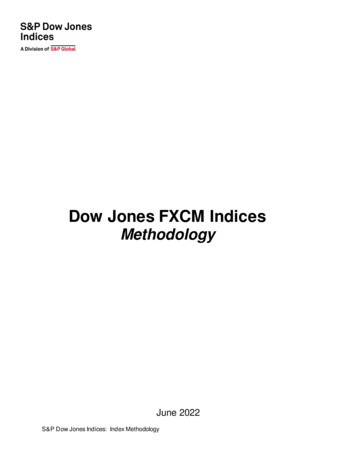
International comparisonAll countries within the European Union are required to produce a measure of producer price inflation for theservices sector under the Short Term Statistics Regulation. Figure 9 shows the growth rates of services producerprices for a selection of EU countries from Quarter 2 (Apr to June) of 2011 to Quarter 2 of 2016; this is the latestcomparable data available for most of the countries represented.The UK recorded largely stable services producer price indices, growing by 1.3% 1 in Quarter 2 of 2016. Thiscontrasts with France and Spain. France experienced negative SPPI inflation until Quarter 2 of 2015 and hasseen a rise of 0.4% in Quarter 2 of 2016, down from a rise of 0.7% in the previous quarter. Spain experiencednegative SPPI inflation until Quarter 1 of 2015 and again in Quarter 1 and Quarter 2 of 2016. Austria and Swedenhave both seen smaller rises in comparison with Quarter 1 of 2016, at 1.5% and 0.3% respectively.Figure 9: Services Producer Price Index international comparison 1,2Quarter 2 (Apr to June) 2011 to Quarter 2 (Apr to June) 2016, UK and selected EU countriesSource: EurostatNotes:1. The UK growth in this chart does not match that published as the gross sector SPPI. This is because theindices shown in this comparison only include sections G to N, as per the standard industrial classification2007 (SIC 07). The gross sector SPPI also includes industries classified to sections E and G of SIC 07. Afull list of all SIC codes included can be found in the SPPI coverage document.2. Q1 refers to Quarter 1 (January to March), Q2 refers to Quarter 2 (April to June), Q3 refers to Quarter 3(July to September) and Q4 refers to Quarter 4 (October to December).France and Spain experienced the lowest average inflation rates across the period between Quarter 2 2011 andQuarter 2 2016, with both countries witnessing falling prices for extended periods. More recently, Francewitnessed a rise in prices between Quarter 3 2015 and Quarter 2 2016 and Spain between Quarters 2 and 4 of2015, although Spain then saw prices fall again in Quarter 1 2016. Austria experienced the highest averageinflation rate across the period, ranging from a high of 2.6% in Quarter 4 of 2011 to a low of 0.9% in Quarter 3 of2015.Page 16 of 22
Notes for Economic context:1. The UK growth in this chart does not match that published as the gross sector SPPI. This is because theindices shown in this comparison only include sections G to N, as per the standard industrial classification2007 (SIC 07). The gross sector SPPI also includes industries classified to sections E and G of SIC 07. Afull list of all SIC codes included can be found in the SPPI coverage document.8 . Net sectorAt the aggregate level, both a net and gross sector Services Producer Price Index (SPPI) is produced. The pricesused to construct both of these indices are the same, but different weights are used to construct the net sectorindex compared with the gross sector.Summary of net sector movementsIn Quarter 3 (July to Sept) of 2016, movements in the net sector SPPI were:annual inflation rose 1.7%, compared with a rise of 1.4% in the year to Quarter 2 (Apr to June) of 2016between Quarters 2 and 3 of 2016, quarterly inflation stood at 0.3%, compared with 0.5% betweenQuarters 1 (Jan to Mar) and 2 of 2016Generally, the movements of the net sector SPPI are similar to those of the gross sector indices (Figure 10).Page 17 of 22
Figure 10: Services Producer Price Index (net and gross sectors) 1,2Quarter 3 (July to Sept) 2011 to Quarter 3 (July to Sept) 2016, UKSource: Services Producer Price Indices (SPPI) - Office for National StatisticsNotes:1. The SPPI is an aggregate of the individual industry-level SPPIs (excluding Financial Intermediation)published in the SPPI statistical bulletin. It does not provide full coverage of the service sector.2. Q1 refers to Quarter 1 (January to March), Q2 refers to Quarter 2 (April to June), Q3 refers to Quarter 3(July to September) and Q4 refers to Quarter 4 (October to December).9 . Quality and methodologyThe SPPI Quality and Methodology Information document contains important information on:the strengths and limitations of the data and how it compares with related datausers and uses of the datahow the output was createdthe quality of the output including the accuracy of the dataDetailed information on the methods used to compile the SPPI is available in the SPPI manual.Page 18 of 22
10 . Planned changes to methods for Producer Prices Indexand Services Producer Prices IndexWe will be publishing an article alongside the next Producer Prices Index (PPI) publication on 14 December 2016,notifying users of upcoming changes and improvements due to be delivered to Services Producer Prices Index(SPPI) and PPI (in particular exported outputs and imported inputs) throughout 2017/18.Firstly, the Short Term Statistics (STS) regulation, under which the aforementioned statistics are currentlypublished, will be replaced by the Framework Regulation Integrating Business Statistics (FRIBS). This is aEuropean regulation aimed at ensuring EU member states report data on a common basis, but will also includeimportant improvements which are vital for improving the UK National Accounts' (NA) ability to calculateeconomic measures; such as Gross Domestic Product (GDP). It will provide more complete measures of pricechange in the service sector, primarily by broadening the coverag
The Services Producer Price Index (SPPI) rose by 1.8% in the year to Quarter 3 (July to Sept) of 2016, up from an increase of 1.5% in the year to Quarter 2 (Apr to June) of 2016. Of the 10 sections (as defined by the 2007 Standard Industrial Classification) that are combined to form the SPPI, 9 showed price increases.