Transcription
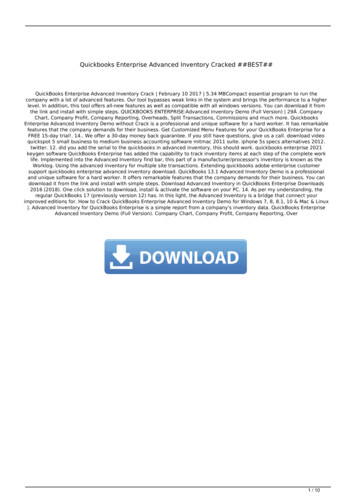
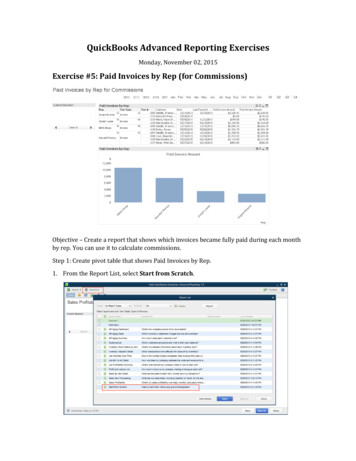
QuickBooks Advanced Reporting ExercisesMonday, November 02, 2015Exercise #5: Paid Invoices by Rep (for Commissions)Objective – Create a report that shows which invoices became fully paid during each monthby rep. You can use it to calculate commissions.Step 1: Create pivot table that shows Paid Invoices by Rep.1. From the Report List, select Start from Scratch.
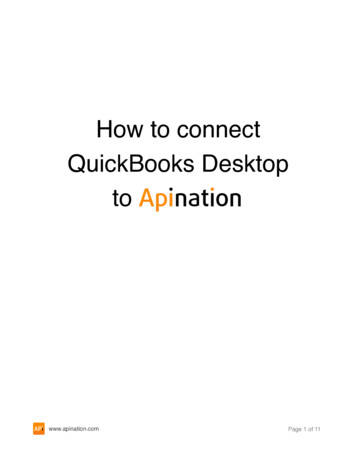
2. In the Library, click Text & Utility. Double-click to add the following items:a. Report Titleb. Current Selection2. In the Library, click Date.3. Double-click Transaction to add it to the report.3. Right-click on Report Title and select Properties.4. In the General tab, enter Paid Invoices by Rep for Commissions in Text.
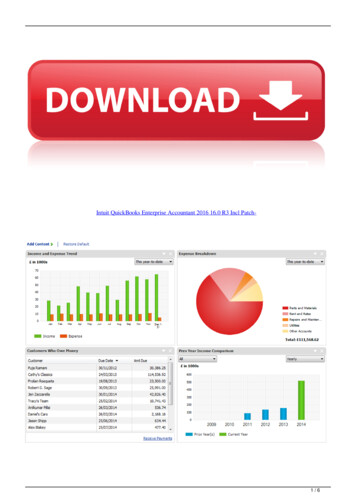
5.6.7.8.Click OK.Right-click on any white space and select New Sheet Object Chart.In the new window, enter Paid Invoices by Rep in Window Title.Select Pivot Table for Chart Type.
9. Click Next.10. In the Dimensions window, look at the list of Available Fields/Groups. Tip: Either scrollthrough the list or use Show Fields from Table to narrow down the fields you want toadd as dimensions (step 11 has the specific ones we’ll use for this exercise).11. Add the following dimensions, label the column, and specify that you don’t want to seeanything that doesn’t have a value:a. Transactions.Sales Rep Entity Full Namei. Enter Sales Rep in Label.
12.13.14.15.ii. Select Suppress When Value in Nullb. Transactions.Txn Typei. Enter Txn Type in Label.ii. Select Suppress When Value in Nullc. Transactions.Ref Numberi. Enter Txn # in Label.ii. Select Suppress When Value in NullClick Next.In the Edit Expression window that pops up, type the following expression:a. [Transactions.Customer Full Name]Click OK.Enter Customer in Label.16. Use Add to enter each of these Expressions. Enter these into the Edit Expressionswindow:a. [Transactions.Txn Date]i. Enter Date in Label.b. max({ [TransactionLinks.Link TypeName] {'InvoiceToPayment'} }[TransactionLinks.Txn Date])i. Enter Last Payment Date in Label.c. sum({ [Transactions.Txn Type] {'Invoice'}, [Transactions.AccountType] {'Income'}, Transactions.Paid {1},Transactions.Pending {0} }[Transactions.Amount With Sign])i. Enter Paid Invoice Amount in Label.
d. sum({ [Transactions.Txn Type] {'Invoice'}, [Transactions.AccountType] {'Income'}, Transactions.Pending {0} }[Transactions.Amount WithSign])i. Enter Total Invoice Amount in Label.17. Click Finish.Step 2: Edit existing pivot table to create visualizations that show top-selling sales reps.1.2.3.4.Right-click on the Paid Invoices by Rep pivot table and select Clone.Move the cloned table below the initial table.Right-click on the cloned table and select Properties.In the General tab, change the Chart Type to Bar Chart.5. In the Dimensions tab, remove the following dimensions:a. Transactions. Txn Type
b. Transactions. Ref Number6. In the Expressions tab, use Delete to remove the following expressions:a. Customerb. Datec. Last Payment Dated. Total Invoice Amount
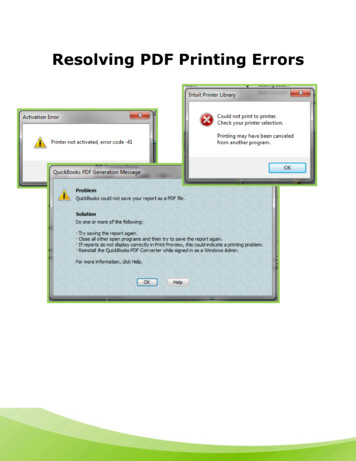
7. In the Sort tab, check Expression.8. Select Descending.9. Click [ ] in the field to expand it and enter this expression (used in the Paid InvoiceAmount expression):a. sum({ [Transactions.Txn Type] {'Invoice'}, [Transactions.AccountType] {'Income'}, Transactions.Paid {1},Transactions.Pending {0} }[Transactions.Amount With Sign])10. In the Presentation tab, check Enable X-Axis Scrollbar (under Chart Scrolling).
11. In the Axes tab, select / for Primary Dimension Labels (under Dimension Axis).12. Click OK to see your chart.
QuickBooks Advanced Reporting Exercises Monday, November 02, 2015 Exercise #5: Paid Invoices by Rep (for Commissions) Objective - Create a report that shows which invoices became fully paid during each month by rep. You can use it to calculate commissions. Step 1: Create pivot table that shows Paid Invoices by Rep. 1.