Transcription
190TRANSPORTATION RESEARCH RECORD 1280Review of AASHTO Green BookProcedures for Sight Distance at RampTerminalsKAY FITZPATRICK AND JOHN M. MASON, JR.Policy described in the AASHTO Green Book (1984 edition)concerning sight distance at ramp terminals is reviewed. Rampterminal design procedures should be commensurate with designprinciples for at-grade intersections and required si ht dista cevalues should be similar to those for stop-controlled mtersect10nsight distance values. However, sight distance values for rampterminals are over 21 percent lower than those obtained from theB-1 curve procedure because of different distance-traversedassumptions. Available sight distance has been recalculated. atramp terminals assuming the Green Book values for stoppmgsight distance, driver eye height, and object height. Equationswere developed to reproduce the B-1 curve and then truck characteristics were substituted for passenger car characteristics todetermine the sight distance requirements for a stopped truck. Kvalues needed to produce vertical curves that will provide therequired sight distances (i.e., B-1 curve sight distances) both forpassenger cars and for trucks are generally greater than GreenBook K values used for vertical curve design. Therefore, development of alternative approaches for establishing sight distancevalues at ramp terminals (and at-grade intersections) should beinvestigated.AASHTO's 1984 A Policy on Geometric Design of Highwayand Streets (Green Book) (1) contains several procedures thatcan be used to determine intersection sight distance for astopped vehicle. One procedure (Case III) is described forstop controls on secondary roads. The Green Book (1) statesthat "the driver of the vehicle on the minor road must havesufficient sight distance for a safe departure from the stoppedposition even though the approaching vehicle comes in viewas the stopped vehicle begins its departure movements." Otherprocedures are described for arterial highways, railroad-gradecrossings, and ramp terminals.In the ramp terminal section, the Green Book (1) statesthat "although ramp terminals may be considered part ofinterchange design . . . the terminals should be planned inaccordance with design principles for at-grade intersections;ind with p;irticul;ir ;ittention to sight ctist;ince ch;irncteristics."As such, the ramp terminal procedure should produce resultsthat are similar to Case III procedures. But sight distancevalues presented in Table 1 for ramp terminals are differentfrom those found using Case III procedures (shown in Figure1). If the ramp terminal procedure is only concerned withK. Fitzpatrick, Texas Transportation Institute, Texas A&M Univer-sity, College Station, Texas 77843. J. M son: Pennsylvama Tra s portation Institute, Pennsylvama State Umvers1ty, Research BmldmgB, University Park, Pa. 16802.sight distance to the left for a left-turning vehicle, then theramp terminal procedure should yield results similar to thoseproduced using the B-1 curve procedure (see Figure 1). However, the ramp terminal sight distance values are over 21percent lower than the B-1 curve values. When the rampterminal sight distance values are compared with the valuesobtained using other procedures (e.g., turning vehicle attainsaverage running speed or design speed), the differences aremuch greater. Using the values in Table 1 at a ramp terminalwill result in sight distances that are less than the sight distances at other at-grade intersections that use Case IIIprocedures.Parameters are identified that are necessary to calculateboth the sight distances at ramp terminals and the relevantCase III curve. An evaluation of the parameters explains thedifferences in the sight distance values betwen the ramp terminal and Case III, B-1 curve procedures. Development ofspecific equations permits the calculation of sight distancesfor other conditions, such as when the stopped vehicle is atruck, or when a vehicle turning onto a road must clear morethan one lane.GREEN BOOK (J) POLICYSight distance criteria for ramp terminals are intended to ensurethat a vehicle stopped at the terminal will have adequate timeto turn left and clear the intersection without colliding witha vehicle coming from the left. Ramp terminals should bedesigned on the basis of the same sight distance design elements as those used for other at-grade intersections. An addedsight distance consideration is the location of bridge parapetwalls or bridge railings.The Green Book (1) indicates that the primary differencebetween this condition and the Case III-A (crossing maneuver) procedure is the increase in the time and distance traveledby vehicles negotiating the left turn rather than 1,;russiug thehighway. Distances cited in the Green Book (1) for a turningvehicle to clear the intersection are 60 ft for the passengercar, 90 ft for the SU design vehicle, and 120 ft for theWB-50 design vehicle. Other assumptions include Front of the stopped vehicle is 10 ft from the edge of thethrough pavement (i.e., D 10 ft); Turning vehicle follows its minimum turning path; Turning vehicle enters a two-lane, two-way roadway;
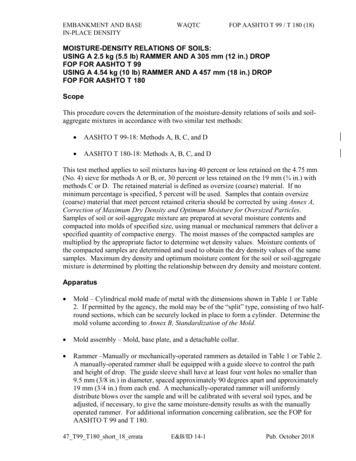
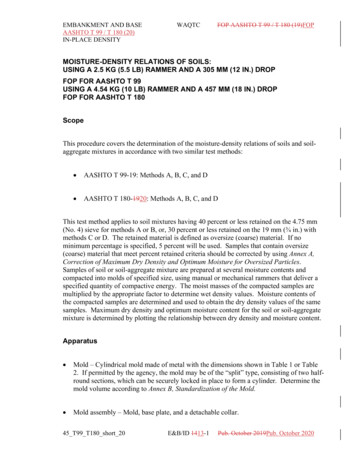
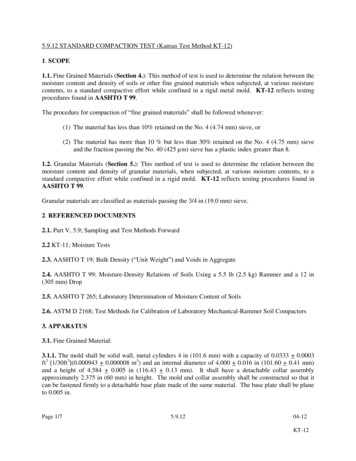
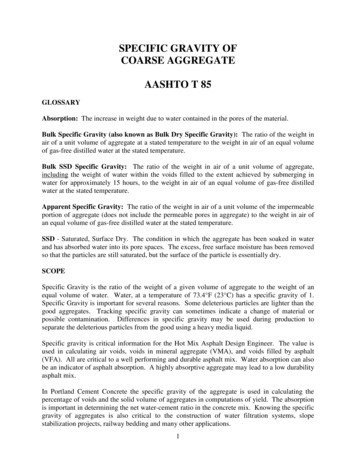
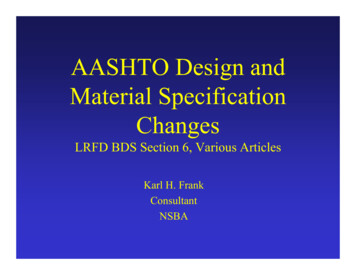
Fitzpatrick and Mason191TABLE 1 REQUIRED SIGHT DISTANCE ALONG THECROSSROAD AT TERMINALS OF RAMPS ATINTERCHANGES [GREEN BOOK (1), TABLE IX-9]AssumedDesignQ140Sight DistanceAvailable toEntering VehicleWhen Vertical Curve".,won Crossroad isw::I Designed forStopping SightDistancebDesign Vehicle Assumed atRamp TerminalSpeed onMajor road/.,zSight Distance Required toPermit Design Vehicle toTurn Left from Ramp toCrossroad ,,,.18z o.,,/.A0p(ft)SU(ft)WB-50(ft)p a:SU or 307601,030540600606309101, 230730820ww."" 8 I"',,,.,. .,,/ v. .,.,,. "'f!: , - · "' , ;i. ·- -;, 'I- . . . 1. .-::; 1.-'"to, i:-"' -".:.f-? "' ,.: / / V,1/ c."1· .,, ,.- . \. .- ."'o ? , ·/. 8.r "''' 0 4 --- -/ /. / ,.,10 (mi(h),.,I,/. /12// ,,./ 408080100120140180180200S DISTANCE TRAVELED DURING ACCELERATION - FEET707401, 0601,4309201,040FIGURE 2 Sight distance at intersections [Case III, accelerationfrom stop, Green Book (I), Figure IX-21). sight distance measured from height of eye of 3. 50 ft for P, SU,and WB-50 design vehicle to an object 4.25 ft high . inimum available stopping sight distance based on the assumptionthat there is no horizontal sight obstruction and that S L. Time to accelerate can be determined from Figure 2; and Perception and preparation time is 2.5 sec.Figure 3 shows the sight distance at ramp terminals. TheGreen Book (J) criteria indicate that both the horizontal sighttriangle (Figure 3a) and the vertical curvature (Figure 3b)should be checked to ensure that the required critical sightdistance from Table 1 is provided . Further, the privilegedvehicle (traveling unimpeded) must have adequate stoppingsight distance to a vehicle stopped at the ramp terminal.70 85 I I!;-0 1ll55-50.45L;11"'z. I0diw40IAI35 I30J I J,25I200II"''OYV q,i"/I ,/,/fQ(I- /I' tv/- vv/v .,:;:.-,,IQ.QwwI1Vio. %v/ Qeo.:I"/ 11/ c. REPRODUCTION OF GREEN BOOK (1) SIGHTDISTANCE VALUESVehicle Acceleration From a Stopped PositionA major influence on sight distance is the acceleration capability of the vehicle. Two figures in the Green Book (J) canbe consulted for vehicle acceleration information. Figure 2shows time-distance curves depicting passenger car normalacceleration and the recommended assumed acceleration forv,.v[.-'vv/IJ. / . vB-2b- SAFE SIGHT DllTANOE FOR PVEHICLE TO TUR!4 LEFT I NTO 2-LANEHIGHWAY AND A1TAIN AVERAGERUNNING SPEED WITHOUT BEINGOVERTAKEN SY VEHICLEAPPROACHING FROM THE RIGHTREDUCING SPEED FROM OE8 1GN SPEEDTO AVERAGE RUNNING SPEED.(IEE DIAGRAM).////Ca - SAFE SIGHT DISTANCE TO P VEHICLETO TURN RIGHT INTO A 2-LANEHIGHWAY AND ATTAIN DESIGN SPEEDWITHOUT BEING OVERTAKEN BY A PVEHICLE APPROACHING FROM THELEFT TRAVEL ING AT DESIGN SPEED.ffCb - SAFE SIGHT DISTANCE FOR P VEH ICLETO TURN RIGHT INTO 2-LANE HIGHWAYAND ATTAIN AVERAGE RUNNING SPEEDWITHOUT BEING OVERTAKEN BYVEHICLE APPROACHING FROM THE LEFTANO REDUCING FROM DESIGN SPEED TOAVERAGE RUNNING SPEED.1400800B-1 - SAFE SIGHT DISTANCE FOR VEHICLETURNING LEFT INTO 2 LANE HIGHWAYACCROSS P VEHICLE APPROACHINGFROM LEFT. (S EE DIAGRAM)B-2& - SAFE SIGHT DISTANCE FOR P VEHICLETO TURN LEFT INTO 2-LANE HIGHWAYAND ATTAIN DESIGN SPEED WITHOUTBEING OVERTAKEN llY A VEHICLEAPPROACHING FROM THE RIGHT ANOMAINTAINING DESIGN SPEEDI'200A - SAFE SIGHT DISTANCE FOR P VEHICLECROSSING 2-LANE HIGHWAY FROM STOP.(SEE DIAGRAM)I'"8001000 ·12001400 180018002000 2200 24002800BIGHT DISTANCE (FEET)FIGURE 1 Intersection sight distance at at-grade intersections [Case III, B and C, Green Book (1), Figure IX-27].
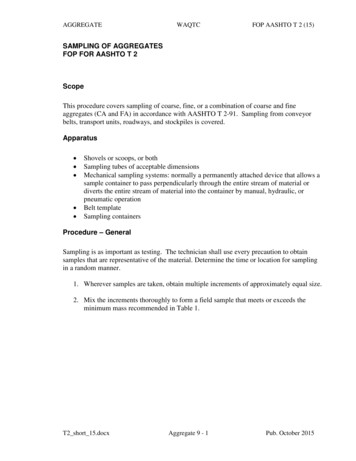
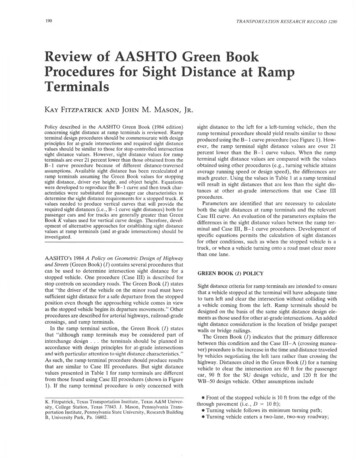
192TRANSPORTATION RESEARCH RECORD 1280·-- - -----it.26 " A·Height ol Eye 3 50'4.25' 141Acceleration times can be estimated on the basis of Figure4. Table 2 presents the distance values read from the figurein 5-mph increments. The distance increment column is thedistance traveled during the previous 5-mph increase. Thetime increment column was calculated using the followingequation:Time Increment2 x Di tancc IncrementV 1,,1111o 1-- -,- r'I- -·B·FIGURE 3 Measurement of intersection sight distance at rampterminals [Green Book (1), Figure IX-29].(1) V ""'where Vinitial and vfinal are the vehicle's initial and final speeds,respectively. Acceleration time is the sum' of the previous timeincrements. An inherent assumption in using either Figure 2or Figure 4 is that the acceleration rates for right- and leftturning maneuvers are not significantly different.Sight Distance at Ramp Terminals70:z:II.:E80Iaw60():z:c40a:a30w20wwII. :.-- " i-- - . t:: .:::i:::; i;;.- "-" 1-1- - -t-- - - -1i.1-- i.- i-1-- ::;!.--a.- a.vi' o ,k. ""' i::, 1-- \ll\1\"\. "-'--t--t,--1-11-11- - -t-- - -t-t-1v1 1ACCELERATION OF 1 ,PASSENGER CARSNORMAL RATE FOR 1 - 1 u,1 -1- - - - - - - -l-I- LEVEL CONDITIONS - L11CD·vk::vl'.; AI 1004008001200190020002400PASSENGER CARS - DISTANCE TRAVELED - FEET8060:z:II.The Green Book (1) states that "the length of highway opento view from the ramp terminal must be greater than theproduct of the speed of a vehicle on the crossroad and thetime necessary for the vehicle entering the crossroad from astopped position on the ramp to start and complete a left turnonto the crossroad." On the basis of this statement and assuming that the procedure is only concerned with vehiclesapproaching from the left, passenger car results should besimilar to the Green Book (1) B-1 curve in Figure 1 (thesight distance to clear the near lane). B-1 sight distance valuesshould be slightly less than the ramp terminal sight dist.ancesbecause the B-1 procedure assumes a perception-reactiontime that is 0.5 sec less than the ramp terminal procedure.The B-1 curve procedure assumes a 2.0-sec perception timeand time (J) required to actuate the clutch or automatic shift,60:EIaw:z:40cwa:30aww20CD10()TABLE 2 ACCELERATION DISTANCE AND TIMEVALUES ON THE BASIS OF FIGURE 4ACCELERATION OFITRUCKSSpeed(mi/h)NORMAL RATE FORLEVEL nger CarsREPRESENTATIVE WEIGHT/POWER RATIO0DistanceTraveled6000TRUCKS - DISTANCE TRAVELED - FEETFIGURE 4 Acceleration curves [Green Book (1), FigureIX-22].passenger cars, SU trucks, and WB-50 trucks. These curvesrepresent 40- to 200-ft distances traveled during acceleration.Figure 4 presents speed versus distance curves for passengercar normal-rate acceleration for level conditions from 0 to2,400 ft and "normal rate for level conditions, representativeweight-power ratio" truck acceleration from 0 to 5,000 ft.Truck acceleration curves in Figure 4 represent SU andWB-50 design vehicles and were determined from truckperformance studies.5101520253035404550556065702 , 72Bl1030501252103505508001 , 0751 , 4001 , 8002,3002, 9003' 6001020207585140200250275325400500600700' · . 195.1 85 . 926.537 , 052. 724.545. 628 , 5411 . 1114 . 5718 - 7623 . 2927 . 7032 . 3537 . 5343 4549 . 9857 , 03501001752754507001 , 2001 , 9003' 2005,0005050751001752505007001, 3001,80013. 614 544.083. 895. 296 .1810.4712. 7020. 8125. 7813 , 6118 1422 . 2226 . 1131.4037 . 5848 . 0560 . 7581.56107 . 34l1.092. 922.573. 6tt .sr.4J10'· .65Trucks5101520253035404550-Values read from figure 4 .
193Fitzpatrick and Masonwhereas the ramp terminal procedure assumes a perceptionand preparation time tPP of 2.5 sec. However, the sight distances at a ramp terminal are over 21 percent lower thanthe distances obtained using the B-1 curve (clear lane)procedure.Using the Green Book (J) sight distance at ramp terminalsvalues listed in Table 1 and the assumption of 2.5 sec for tPP'the average acceleration times (t,) were determined. On thebasis of these times, the distance that the turning vehicletraveled (S,) and the speed (V) reached by the turning vehiclewere found. The turning radius (R) for the minor-road vehiclewas determined assuming that the vehicle was 10 ft from theedge of the through pavement and that it followed the minimum turning path as assumed in the Green Book (J). Theresults are presented in Table 3.Calculated distance traveled (S,) and turning radius (R)values in Table 3 do not agree with the assumptions stated inthe Green Book (J). Distance traveled (S,) values that werestated in the section on sight distance at ramp terminals ofthe Green Book (J) are 60, 90, and 120 ft. Turning radii (R)based on these distances are given in Table 4. Radii calculatedfrom the sight distance values in Table 1 (listed in Table 3)and radii calculated from the Green Book (J) assumed distance traveled by left-turning vehicles (listed in Table 4) areTABLE 3 CALCULATED VALUES ON THE BASIS OFTABLE 1 SIGHT DISTANCE VALUESpAverage acceleration time,t:, (sec)S1 values from figure 2 (ft)Speed,(mi/h)v, reached using figure 4Turning radius, R (ft)'4. 750SU7. B75151322Wl!-5011.5both less than the design turning radius for both
AASHTO's 1984 A Policy on Geometric Design of Highway and Streets (Green Book) (1) contains several procedures that can be used to determine intersection sight distance for a stopped vehicle. One procedure (Case III) is described for stop controls on secondary roads. The Green Book (1) states that "the driver of the vehicle on the minor road must have sufficient sight distance for a safe .