Transcription
NREL/TP-472-7024IUC Category: 1300 DE95000255ternsAhmad A. PesaranNational Renewable Energy LaboratoryJoel NeymarkIndependent ConsultantPrepared for the ASME/JSME/JSESInternational Solar Energy Conference,Maui, HI,March 19-24, 1995National Renewable Energy Laboratory1617 Cole BoulevardGolden, Colorado 80401-3393A national laboratory of the U.S. Department of Energymanaged by Midwest Research Institutefor the U.S. DeDartment of Energvunder Contract No. DE-AC36-8TNovember 1994
NOTICEThis report was prepared as an account of work sponsored by an agency of the United Statesgovernment. Neither the United States government nor any agency thereof, nor any of theiremployees, makes any warranty, express or implied, or assumes any legal liability or responsibility forthe accuracy, completeness, or usefulness of any information, apparatus, product, or processdisclosed, or represents that its use would not infringe privately owned rights. Reference herein to anyspecific commercial product, process, or service by trade name, trademark, manufacturer, or otherwisedoes not necessarily constitute or imply its endorsement, recommendation, or favoring by the UnitedStates government or any agency thereof. The views and opinions of authors expressed herein do notnecessarily state or reflect those of the United States government or any agency thereof.Available to DOE and DOE contractors from:Off ice of Scientific and Technical Information (OSTI)P.O. Box 62Oak Ridge, TN 37831Prices available by calling (615) 576-8401Available to the public from:National Technical Information Service (NTIS)U.S. Department of Commerce5285 Port Royal RoadSpringfield, VA 22161(703) 487-4650ontaining at least 50% wastepaper and 10% postconsumer waste
DISCLAIMERPortions of this document may be illegiblein electronic image products. Images areproduced from the best available originaldocument.
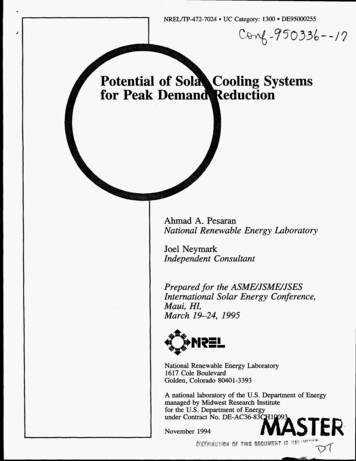
POTENTIAL OF SOLAR COOLING SYSTEMS FOR PEAK DEMAND REDUCTIONAhmad A. PesaranNational Renewable Energy LaboratoryGolden, ColoradoJoel NeymarkGolden, ColoradoABSTRACTWe investigated the technical feasibility of solar cooling forpeak demand reduction using a building energy simulationprogram (DOE2.1D). The system studied was an absorptioncooling system with a thermal coefficient of performance of 0.8driven by a solar collector system with an efficiency of 50% withno thermal storage. The analysis for three different climatesshowed that, on the day with peak cooling load, about 17% of thepeak load could be met satisfactorily with the solar-assistedcooling system without any thermal storage. A performanceavailability analysis indicated that the solar cooling system shouldbe designed for lower amounts of available solar resources thatcoincide with the hours during which peak demand reduction isrequired.The analysis indicated that in dry climates,direct-normal concentratingcollectors work well for solar cooling;however, in humid climates, collectors that absorb diffuseradiation work better.INTRODUCTIONThe concept of using solar energy to cool buildings is appealingbecause the cooling load is roughly in phase with solar energyavailability. In addition, when solar cooling is combined withsolar heating and hot water, the year-round usage is increased,which could decrease the amortization cost and improve the costeffectiveness of the solar systems ( U f and Tybout, 1974). In asolar cooling system, solar collectors (such as flat plates, parabolictroughs, evacuated tubes, etc.) provide thermal energy to drivecooling equipment (such as a desiccant air conditioner, absorptionchiller, or Rankine vapor-compression chiller). In solar hybridsystems, gas-fired cooling systems or electricity-driven equipmentis used in addition to solar cooling systems. A large potentialmarket exists for solar cooling in most parts of the United States,but because of their high first-costs, existing solar cooling systemscannot compete with electricity-driven or gas-fired air conditioning systems. Payback periods for solar cooling equipment aremore than 20 years (Warren, 1993; Pesaran and Wipke, 1994)because of low fossil fuel prices.In the early 1980s, there were several field tests of solarabsorption and Rankine-vapor compression refrigeration systems(Wahlig, 1993). These tests identified shortcomings of the earlysystems and indicated the need for further research and development (R&D), particularly in improving the integration of the solarsubsystem and cooling equipment. American Solar King introduced and field-tested a solar desiccant cooling system during1984-1985; however, because of high first-costs, the solar featurewas not offered in later years. An excellent overview of the earlyresearch and development in solar cooling is provided in Lijf(1993). Currently, there are no suppliers of integrated solarcooling systems. Instead, cooling equipment and solar collectorsubsystems must be acquired separately and then integrated. Inthe last few years, there have been only two solar cooling fieldapplications in the United States. In Florida, a hybrid solardesiccant cooling system was installed in a fast-food restaurant toprovide supplemental cooling (West and Iver, 1995). The systemused a solid-desiccant dehumidifier wheel containing lithiumchloride, which was regenerated with heat supplied by an array ofevacuated-tube solar collectors and waste heat from condensers ofa conventional air-conditioning system. The hybrid systemimproved the comfort in the restaurant because of lower humidityachieved by adding the desiccant dehumidifier. The secondapplication is in California, where an absorption refrigerationsystem integrated with solar collectors provide cooling to a smalloffice building (Bergquam, 1993). Initially, flat-plate collectorswere used to provide heat for driving the lithium bromideabsorption chiller; now, parabolic troughs are used for thispurpose.Until recently, most of the solar cooling projects funded bygovernment agencies focused on 'systems for broad long-termmarket applications such as residential air conditioning. Althoughthese efforts resulted in improved performance and reliability, nosignificant cost reduction and market adaptation were achieved,
'and as a result, R&D funding deteriorated. In the past few years,after several meetings between government and solar industryrepresentatives, the approach and strategy for solar coolingprograms have shifted. The major recommendation from thesemeetings was that, in the near-term (less than 5 years), solarcooling programs should support activities that can producesystems suitable for high-value niche markets such as remoteapplications or areas with a high cost of energy. One of the highvalue niche markets proposed was the use of solar cooling toreduce summer peak electricity requirements in Commercialbuildings. The rationale for this strategy is that peak demandcharges are high, and electric utilities are interested in reducingfuture generation and transmission capacity requirements,especially when the capacity expansion is required just to handlepeak loads with a short duration; space cooling is such a load.Specifically, space cooling and air handling systems account for16%of annual U.S. electricity use (418 billion kilowatt-hours peryear [kWWyr]), but 43% of summer peak demand (210 gigawatts)(Houghton et al., 1992, p. 25). Because of this disproportionatelylarge peak demand requirement relative to base energyconsumption, the cost of electric capacity to cover peak demandbecause of space cooling is more difficult for utilities to recoverthan for other end uses in which electric demand is more evenlydistributed.The objective of this study is to explore and analyze thejustification and technical feasibility for peak reduction using solarcooling. The analysis includes an evaluation of climates andutility peak-load characteristics, and modeling of peak-loadreduction using solar cooling in an office building for E 1. SUMMER PEAK DAY HOURLY LOADS FORA SMALL OFFICE BUILDING (REGIONAL ECONOMICRESEARCH INC., 1990,COMMEND SIMULATIONS)flLow conventional energy costsHigh first-cost for the solar cooling systemsLack of a track record for performance and reliabilityLack of a cohesive industryResistance by the heating, ventilating, and air-conditioningindustry to adopt new technologies in place of widely usedexisting technologies.To achieve long-term success in light of these issues, solarcooling must first establish its reliability and cost-effectiveness insome niche markets. As noted above, one possible market forsolar-driven technologies is to reduce the peak electric demandgenerated by space cooling loads in commercial buildings. Thereason, as shown in Figure 1, is that peak demand in manycommercial buildings occurs between 9 a.m. and 4 p.m. becauseof space cooling loads. This peak approximately coincides withthe solar resource, which is illustrated later in the Results andDiscussion section for a commercial office building. Furthermore,other data (e.g., see Figure 2) indicate that the solar resource iscoincident with the utility summer peak load. Thus, in warmerclimates, an opportunity exists to use solar-driven space cooling7HOUR OF DAYNEAR-TERM TARGET MARKETSImplementingsolar cooling technologies faces significant marketbarriers which include:0ACOOLING ENTILATDN H. OT WATERBREFRIGERATOR&lSCSOLAR COLLECTORS04a1216TIME OF DAY (POT)2024FIGURE 2. SUMMER ELECTRICITY LOAD PROFILEAND SOLAR COLLECTOR OUTPUT (SOLAR DATA FORSAN RAMON, CA; SOURCE-PACIFIC GAS& ELECTRIC R&D CENTER)to reduce peak demand. Adopting such a peak-reduction strategywould yield the following benefits to a utility:0Reduced expense for conventional generation and distributioncapacityExtended transformer life (because of reduced critical hours)
Reduced transmission energy losses (I'R, where I is currentand R is resistance)Increased system reliability (because of reduced thermaloverloading)Reduced capital costs (because of smaller lines andtransformers)Avoided costs of producing-expensive peak energy.As a result, some electric utilities are willing to provideincentives or subsidize activities that can reduce peak loadcapacity. For example, Sacramento Municipal Utility Districtprovides a rebate of 600 for each ton of cooling that can bereduced from the peak cooling load.Solar cooling also has some other benefits:Reduced energy consumptionReduced use of chlorofluorocarbons, which contribute to thedepletion of the Earth's ozone layerReduced pollution emissions from using less fossil or nuclearfuels.A number of factors should be considered to determine theviability of various locations for peak reduction with solarcooling. For this analysis, we included these parameters:Peak cooling loadSolar resourceClimate conditions, including humidityUtility summer versus winter peak demandUtility ratesCost and availability of piped natural gasBuilding typeIn any further analysis, peak-reducing technology costs (coolingequipment and solar-collector array) and life-cycle cost should beconsidered.We tabulated utility data and climate conditions for 30 majorcities. Tables A-1 and A-2 contain various utility data includingsummer and winter peak, gas prices, and electricity rate structure,and Table A-3 contains climatic data for the same cities. Tocompare the data and select cities with more desirable climateutility characteristics for solar cooling, we first ranked the citiesby devising a climate score which is equal to peak-month coolingdegree days multiplied by peak-month available solar resources.This score identifies cities that have the highest solar resourcesand highest cooling requirement in a month, and Table 1 presentscities ranked by climate score.Because it is more likely that summer-peaking utilities givebetter incentives and reduced rates for peak-reducing strategies,we multiplied the climate score by the ratio of utility summerpeak kW to winter-peak kW to yield a climate-utility score.Cities ranked by climate-utility score are also presented inTable 1. In most locations, the price of natural gas is lower thanthe cost of delivered solar energy, and thus, solar cooling cannotcompete with gas cooling. Therefore, solar cooling may beimplemented most easily in markets and regions where natural gaspipelines are not readily available.TABLE 1. MAJOR LOCATION RANKINGS BY CLIMATEAND UTILITY PEAK CHARACTERISTICSRanked by Climate ScoreRanked by ClimateUtility ScoreLocationClimateScoreLocationPhoenixLas VegasFort WorthTucsonFresnoSan AntonioEl PasoMiamiTulsaMemphisKansas CityWichitaTallahalOrlLittle w as VegasPhoenixMemphisSan AntonioTucsonKansas CityFresnoFort WorthTulsaWichitaNew OrleansEl PasoMiamiMobileHoustonLittle ClimateUtilityScore93792771 1339739 1385381372225196185142Climate Score: (peak-month cooling degree days) x(peak-month available solar)Climate-Utility Score: (Climate Score) x[utility (summer peak kW)/(winter peak kW)]Based on the above considerations and rankings, we suggest thatnear-term U.S. solar-cooling programs should be aimed at "allelectric" markets in the southern, south-central, southwestern, andparts of the western United States.For the following reasons, we believe that peak demandreduction using solar cooling is more suitable in the commercialbuilding sector (rather than in the residential sector):
III LOccupancy of most commercial buildings (such as offices) iscoincident with the availability of solar resources. Residentialpeaks usually occur in late afternoon or early evening whensolar resources are not high, and thus, storage is required.Many commercial buildings require year-round cooling,enhancing energy savings from solar cooling system.Commercial buildings are more likely to have an existingmaintenance infrastructure, so they are more adaptable to newtechnologies.The residential sector should eventually be explored becausealthough residential space cooling is estimated at only 5.5% ofnational electricity consumption, it is responsible for an estimated22.7% of the national summer peak load (Houghton et al., 1992,p. 25). Additionally, the number of households with air conditioning has increased by about 15% from 1984 to 1989 (Houghtonet al., 1992, p. 28) and could continue at the same rate in thecoming years.TECHNICAL FEASIBILITY METHODOLOGYWe performed the analysis discussed below to demonstrate thetechnical feasibility of solar cooling for peak reduction. Figure 3summarizes the flow chart for the methodology of the technicalanalysis. The analysis is based on using a building energysimulation program-forthis study, the DOE2.1D program(version 014).External weather data are from typicalmeteorological year ("MY)data for the three locations analyzed.The simulations assumed that the building temperature ismaintained at a constant 72 F for the entire year, with thehumidity range within the comfort zone established by theAmerican Society of Heating, Refrigerating, and Air-conditioningEngineers.BUILDING DESCRlPllON8 INTERNAL LOAD DATActILOAD ANALYSISDOE2.1SOLARARRAYDESCRIPTIONLHOURLY COOLINGLOADSct*HOURLY SOLARRADIATION& DIR. NORMAL SOLAR1SPREADSHEETANALYSISDEMAND REDUCTION1ENERGY USE REDUCTIONANALYSIS DATAFIGURE 3. SIMULATION ANALYSIS METHODOLOGYBuilding SelectionThe occupancy, and therefore lighting and equipment schedule,in office buildings generally coincide with solar resources (seeFigure 1). Single-floor buildings having 10,000-25,000 f? offloor area constitute a major sector of commercial building stock(EIA, 1991). An average U.S. commercial building has about14,000 ft'. We selected a 2O,6Wftz, single-story office buildingfor our analysis in this study. Table 2 provides the generalbuilding descriptions. The lighting, equipment, and occupancyschedules are similar to those recommended by Kaplan and Caner(1992) with more-conservative early evening ramp-downs (morelike EPRI COMMEND end-use loads as shown in Figure 1).Weekend equipment schedules were not included, so if a peakcooling load occurfed on a TMY weekend, it would not be missedin the analysis.TABLE 2. DESCRIPTION AND CHARACTERISTICS OFBUILDING THAT WAS SIMULATEDGeneral Building DescriptionSmall commercial office buildingConditioned space of 20,569 ftzSquare geometrySingle floorFive conditioned zones, 11 . 5 4 ceiling- Interior core zone, 12,829 f?- North perimeter zone, 1935 ftz (grouped aszone)- South perimeter zone, 1935 f?- West perimeter zone, 1935 f?- East perimeter zone, 1935 f?No plenumcoreInput Related to Internal GainsLighting-2 W/ft?, 100% on 7 a.m. to 5 p.m., 75% on 5p.m. to 6 p.m., 50% on 6 p.m. to 11 p.m.Equipment4.6 W/f , 100% on 8 a.m. to 5 p.m., 50%on 5 p.m. to 11 p.m.Occupancy-250 f&person, 100% occupancy 8 a.m. tonoon, 1 p.m. to 5 p.m.No thermostat setbacks/setupsNo weekend end-use schedulesInput Related to External GainsFacade Materials:Brick face walls with R7 insulation29% glazed with double-pane, shading coefficient 0.55Built-up roof with R11 insulation.Infiltration:Air change per hour 0.5 (20 outside airCWperson)Independent of wind speed
A heavier and better-than-average insulated building shell waschosen to account for thermal load lag because of mass and toreduce the amplitude of peaks because of external gains. This isa conservative approach, because it is more difficult for a solarcooling system to reduce peak. For example, during a period ofcloudiness after several hours of high solar incidence, a highermass building shell would remain warm for a longer period oftime than would a lower-mass building shell. Thus, the heaviershell could cause a greater Occurrence of lower solar gainscoincident with higher cooiing loads (resulting in moreundercooled hours for the building). In addition, the peak coolingload should be lower for a high thermal mass, well-insulatedbuilding than for a low thermal mass, poorly insulated buildingbecause of thermal storage and resistance effects.Solar Cooling System SelectionFor the purpose of this study, we selected an absorption chillerwith a moderate performance (average thermal coefficient ofperformance [COP] of 0.8). The thermal COP of 0.8 for theabsorption chiller represents a double-effect lithium bromidesystem that requires 120'C output for generation of the absorptionfluid. Usually, the thermal COP of such an absorption chillervaries between 0.7 and 1.1, depending on the operatingtemperatures.We selected high-temperature solar collectors with averagecollector efficiency of 50%. Two types of collector wereconsidered:Single-axis tracking trough (N-S axis mount), with axis tiltoptimized for summertime direct-normal collectionthe thermal COP was not affected by operating temperature. Forthe preliminary level of analysis conducted here, the results of thestudy could be applied to high-temperature, desiccant-assisted,evaporative cooling systems as well.RESULTS AND DISCUSSION OF ANALYSISThe analysis was conducted to answer a number of questions forvarious climates:What does the building cooling-load profile look like on a peakday?How much solar peak-reducing capacity is appropriate?What is the hourly performance of a solar cooling systemdesigned for peak reduction on a peak day?What happens to peak reduction on a high-load day whenclouds appear and there is no storage?How often do very high load and low solar-incidence hourscoincide?How much solar resource is generally available during the peakload hours?What type of collectors should be used?Peak Reduction and Energy Savings ResultsPeak cooling-load reduction analysis was performed for Phoenix(dry climate with a long cooling season), Miami (humid climatewith a long cooling season), and Denver (dry climate with a shortcooling season). Figure 4 compares the annual peak-hour coolingloads for the 20,600-fe office building and incident solar radiationon a west-facing 45"-tilted surface in the above locations.Fixed integrated compound parabolic concentrator (ICPC)facing west with 45' tilt.A 50% collector efficiency is obtainable from either a trough orICPC array with an output temperature of 130 C (OGallagher etal., 1991). The solar collector system is assumed to have nostorage capacity.The chiller size is selected based on reducing 17% of the peakcooling load, and the array size is selected based on the solarresource coincident with the annual peak-cooling-load hour.These sizes are shown in Table 3. A better array-sizing schemecould be developed from the loadkoincident solar plots presentedin the Availability Analysis section.TABLE 3. SOLAR COOLING SYSTEM SIZING FORTHREE LOCATIONS AND TWO COLLECTOR TYPESfEn4400300420030001000For this preliminary analysis, we assumed that the solar collectorwould deliver constant temperature throughout the day, and thus,350500DENVERMIAMILOCATIONPHOENIXFIGURE 4. ANNUAL PEAK HOUR COOLING LOADSAND INCIDENT SOLAR RADIATION (20,600-Fr2BUILDING; PHOENIX, NOT BEING ON DAYLIGHTSAVINGS TIME, HAS LESS SOLAR THAN DENVER)
Although Miami and Phoenix have similar levels of total coolingload, Miami has a greater latent load (much higher ambienthumidity). Miami's higher humidity is combined with a lowersolar resource than Denver or Phoenix. During the hour ofhighest cooling load, Denver has greater solar resources thanPhoenix.Figures 5 through 7 depict the hourly peak cooling load on theannual peak day and the amount that this peak load can bereduced in the three locations by a no-storage solar coolingsystem with a given array of tracking trough collectors. Thetrough collectors use only direct-normal solar radiation. Thecollector area shown in each figure is the amount required toshave 17% of the peak load-or 5, 6, and 6.5 tons in Denver,Miami, and Phoenix, respectively. The tonnages are themaximum cooling capacity the solar array would provide duringannual peak hour. Note that for a conventional cooling systemwith a 3.5 electric COP, 1 ton of cooling would require about1 kW of electricity; so the added solar cooling system wouldreplace about 15-20 kW of peak electricity, assuming 10% forparasitic power for the solar systems. For all locations, thecooling load on the annual peak day is reduced so that the 4 p.m.to 5 p.m. load with the solar cooling system is the same as the11 a.m. to noon load without the solar cooling system.Additionally, the solar collector system allows reduced energyconsumption from the conventional chiller throughout the entireday.500 rB O A D WI SOLAR ABSORBER .TOTAL1357911LOAD BSAVED LOAD13 15I117 19 21 23HOUR OF DAYFIGURE 5. EFFECT OF SOLAR COOLING ON PEAKDAY LOADS FOR PHOENIX (TMY AUG.l; TROUGHCOLLECTOR AREA 980CAPACITY 8 TONS;HOUR 17 IS 5 P.M. MST)Figures 8 and 9 are similar to the preceding figures except thatan advanced fixed collector array is used for Miami and Phoenix.Such an advanced collector system may use evacuated-tubecollectors with either flat-plate absorbers or integrated compoundparabolic concentrators. This advanced collector array, which can5ocW O A D WISOLARABSORBER .TOTALLOAD SAVED LOADI4001 00.0135791113 15 17 19 21 23HOUR OF DAYFIGURE 6. EFFECT OF SOLAR COOLING ON PEAKDAY LOADS FOR MIAMI (TMY AUG.11; TROUGHCOLLECTOR AREA 1290 FT2;CAPACITY 10 TONS;HOUR 16 IS 5 P.M. EDT)58N O A D Wl SOLAR COOLING .TOTAL1357911LOAD mLOAD SAVEDI13 15 17 19 21 23HOUR OF DAYFIGURE 7. EFFECT OF SOLAR COOLING ON PEAKDAY LOADS FOR DENVER (TMY JULY 26; TROUGHCOLLECTOR AREA 540 Fr2;CAPACITY 5 TONS;HOUR 16 IS 5 P.M. MDT)use diffuse radiation as well as direct-normal radiation, faces westand is tilted at 45". Again, the peak load is reduced so that the4 p.m. to 5 p.m. peak with the solar cooling system is the sameas the 11 a.m. to noon load without the solar cooling system.
Because the array is fixed, conventional chiller energyconsumption cannot be reduced in the morning. However, thefixed array should have less initial construction costs andoperating and maintenance costs than a tracking system.500 1W O A D WISOLARABSORBER .TOTALLOADWSAVED LOADI1400Availability AnalysisFigure 10 shows what happens to the cooling load during aworst-case hour (high cooling load and low solar incidence) inDenver. Here, the cooling load decreases when solar gains dropto zero (note hour 16). During this particular hour, the no-storagesolar cooling system cannot provide any demand reduction. Aslong as this Occurrence is rare, the building temperature could beallowed to float upward for 1 hour. Because the conventionalchiller would be handling most of the cooling load, thetemperature increase is expected to be of small enough magnitudeand duration that occupant comfort would not be adverselyaffected. Further building energy simulations would help quantifythe increase in building temperature above the thermostat setpointduring such an hour.-0135791113 15 17 19 21 23HOUR OF DAYFIGURE 8. EFFECT OF SOLAR COOLING ON PEAKDAY LOADS FOR PHOENIX WITH ICPC COLLECTORS(TMY AUG. 1; ICPC COLLECTOR AREA 680CAPACITY 7.5 TONS; HOUR 17 IS 5 P.M. MST)B O A D W1 SOLAR ABSORBER .TOTALLOAD BSAVED LOAD5000I135791113 15 17 19 21 23HOUR OF DAYFIGURE 10. EFFECT OF SOLAR COOLING ONCLOUDY DAY LOADS FOR DENVER (TMY JULY 28;TROUGH COLLECTOR AREA 540 W; CAPACITY 5TONS; HOUR 16 IS 5 P.M. MDT)135791113' 15 17 19 21 23HOUR OF DAYFIGURE 9. EFFECT OF SOLAR COOLING ON PEAKDAY LOADS FOR MIAMI WITH ICPC COLLECTORS(TMY AUG. 11; ICPC COLLECTOR AREA 780CAPACITY 6 TONS; HOUR 16 IS 5 P.M. EDT)w;To obtain information about the frequency of low solar radiationduring hours of critically high loads, Figures 11 through 13 weredeveloped for the three locations. In these figures, the hours ofhighest cooling load are presented along with the coincident solarradiation on a west-facing 45O-tilted surface and direct-normalsolar radiation. The data (cooling load, solar radiation at hoursthat cooling load is within *2 tons of annual peak cooling load)were sorted by increasing solar radiation on the west-facing 45"tilted surface. In addition to describing the frequency of problem(low-solar) hours, the figures also indicate the amount and type(direct-normal or diffuse) of solar resource likely to be availableduring a high-load hour.From these figures, a dry climate such as Phoenix or Denvergenerally has good solar resource (more than 250 Btu/h-fe on thesloped surfaces, and more than 200 Btu/h-ft2for direct-normal) forreducing peak cooling loads for most of the high-load hours.These climates can probably use either tracking trough or
advanced fixed collectors for peak reduction. However, Miami(Figure 12) does not have a consistent supply of direct-normalradiation and would require advanced fixed collectors orsignificant storage for successful, consistent peak reduction.I.TotalCooling Load m i r e c t Normal Solar mest 4 5 O 'Till SolarI.7btalCooling Load m i r e d Normal Solarmest 45O'TikSolarIIJ00- - - - - -.E!I"Q,loo ZI00l o o . - - - - - - - - - - - - - - - - - - - 3%HOURS SORTED BYASCENDINGWEST45" TILT SOLARHOGRS SORTED BY ASCENDING WEST45" TlLTSOhRFIGURE 11. PEAK COOLING LOAD AND COINCIDENTSOLAR RESOURCES FOR PHOENIX (FOR HOURSWITH TOTAL COOLING LOAD z 430,000 BTURl ANDWITHIN 3 TONS OF ANNUAL PEAK-LOAD HOUR)].TotalCooling Load *iredNormal Solar &est45"Xlk Solar1FIGURE 13. PEAK COOLING LOAD AND COINCIDENTSOLAR RESOURCES FOR DENVER (FOR HOURSWITH TOTAL COOLING LOAD 340,000 BTU/H ANDWITHIN 2 TONS OF ANNUAL PEAK-LOAD HOUR)System Sizing ResultsTable 3 summarizesthe solar-array size, peak-reducing capacity,and maximum system capacity for the two collector types in thethree locations (excluding advanced fixed collectors for Denver).For this table, peak reducing capacity is defined as the peakcooling-load reduction using the available solar radiation duringthe annual peak cooling hour; mMimum system capacity is theamount of cooling load the solar array could support, givenenough cooling equipment, during times when more solar energyis available. In this table, the collector area required for Denveris much less than that for Phoenix. This occurred because thecoincident solar incidence for Denver during the annual peak-loadhour was unusually high. If one of the lower solar hours werechosen from Figure 13, the Denver array size would increase, andthe system would have higher reliability. Similarly, coincidentsolar radiation during the annual peak-load hour in Miami isunusually low, so that the array size could be reduced slightlywithout producing a large amount of undercooled hours in thebuilding.For further work, Figures 11 through 13 should be expanded toinclude the coincident solar radiation during every hour that thepeak-reducing solar cooling system must perform. These figurescould then be used to size collector arrays depending on thenumber of undercooled hours that can be tolerated.5oHOURS SORTED BYASCENDING WEST45" TILTSOLARFIGURE 12. PEAK COOLING LOAD AND COINCIDENTSOLAR RESOURCES FOR MIAMI (FOR HOURS WITHTOTAL COOLING LOAD 400,000 BTU/H AND WITHIN2 TONS O F ANNUAL PEAK-LOAD HOUR)CONCLUDING REMARKSWe found that solar-assisted cooling for peak demand reductionis technically feasible. Solar resources, peak loads of utilitysystems, and peak cooling loads of commercial office buildingsgenerally coincide. Additionally, many utility rate structures areamenable to peak-shaving strategies.
The results of our preliminary analysis showed:About 17% of a building's peak load can be met satisfactorilywith a solar-assisted cooling system without any thermalstorage.The system should be designed for the lower amounts of solarresources that are coincident with the hours in which peakdemand reduction will be required.In dry climates such as Phoenix or Denver, direct-normalconcentrating collectors work well for solar c
Off ice of Scientific and Technical Information (OSTI) P.O. Box 62 Oak Ridge, TN 37831 Prices available by calling (61 5) 576-8401 Available to the public from: National Technical Information Service (NTIS) U.S. Department of Commerce 5285 Port Royal Road Springfield, VA 221 61 (703) 487-4650