Transcription
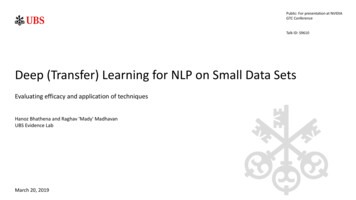
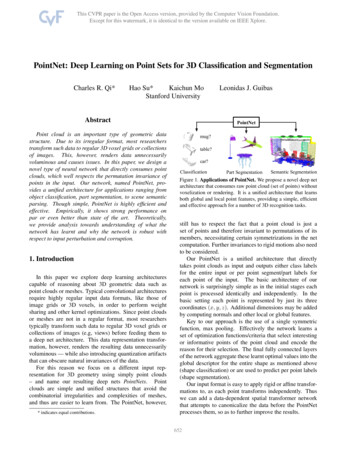
S UMMIT: Scaling Deep Learning Interpretability byVisualizing Activation and Attribution SummarizationsFred Hohman, Haekyu Park, Caleb Robinson, and Duen Horng (Polo) ChauAEmbedding ViewCAttribution Graph Viewmixed5bmixed5ahands holding fishBClass Sidebarmixed4escalespersonfishmixed4dmixed4cFig. 1. With Summit, users can scalably summarize and interactively interpret deep neural networks by visualizing what features anetwork detects and how they are related. In this example, I NCEPTION V1 accurately classifies images of tench (yellow-brown fish).However, S UMMIT reveals surprising associations in the network (e.g., using parts of people) that contribute to its final outcome: the“tench” prediction is dependent on an intermediate “hands holding fish” feature (right callout), which is influenced by lower-level featureslike “scales,” “person,” and “fish”. (A) Embedding View summarizes all classes’ aggregated activations using dimensionality reduction.(B) Class Sidebar enables users to search, sort, and compare all classes within a model. (C) Attribution Graph View visualizeshighly activated neurons as vertices (“scales,” “fish”) and their most influential connections as edges (dashed purple edges).Abstract—Deep learning is increasingly used in decision-making tasks. However, understanding how neural networks produce finalpredictions remains a fundamental challenge. Existing work on interpreting neural network predictions for images often focuses onexplaining predictions for single images or neurons. As predictions are often computed from millions of weights that are optimized overmillions of images, such explanations can easily miss a bigger picture. We present S UMMIT, an interactive system that scalably andsystematically summarizes and visualizes what features a deep learning model has learned and how those features interact to makepredictions. S UMMIT introduces two new scalable summarization techniques: (1) activation aggregation discovers important neurons,and (2) neuron-influence aggregation identifies relationships among such neurons. S UMMIT combines these techniques to createthe novel attribution graph that reveals and summarizes crucial neuron associations and substructures that contribute to a model’soutcomes. S UMMIT scales to large data, such as the ImageNet dataset with 1.2M images, and leverages neural network featurevisualization and dataset examples to help users distill large, complex neural network models into compact, interactive visualizations.We present neural network exploration scenarios where S UMMIT helps us discover multiple surprising insights into a prevalent,large-scale image classifier’s learned representations and informs future neural network architecture design. The S UMMIT visualizationruns in modern web browsers and is open-sourced.Index Terms—Deep learning interpretability, visual analytics, scalable summarization, attribution graph1I NTRODUCTIONDeep learning is increasingly used in decision-making tasks, due toits high performance on previously-thought hard problems and a low Fred Hohman, Haekyu Park, Caleb Robinson, and Duen Horng Chau arewith Georgia Tech. E-mail: {fredhohman, haekyu, dcrobins,polo}@gatech.edu.Manuscript received xx xxx. 201x; accepted xx xxx. 201x. Date of Publicationxx xxx. 201x; date of current version xx xxx. 201x. For information onobtaining reprints of this article, please send e-mail to: reprints@ieee.org.Digital Object Identifier: xx.xxxx/TVCG.201x.xxxxxxxbarrier to entry for building, training, and deploying neural networks.Inducing a model to discover important features from a dataset is apowerful paradigm, yet this introduces a challenging interpretabilityproblem — it is hard for people to understand what a model has learned.This is exacerbated in situations where a model could have impacton a person’s safety, financial, or legal status [44]. Definitions ofinterpretability center around human understanding, but they vary in theaspect of the model to be understood: its internals [16], operations [6],mapping of data [36], or representation [46]. Although recent workhas begun to operationalize interpretability [21], a formal, agreed-upondefinition remains open [10, 30].Existing work on interpreting neural network predictions for im-
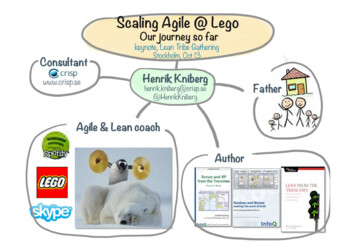
ages often focuses on explaining predictions for single images or neurons [40, 41, 49, 53]. As large-scale model predictions are often computed from millions of weights optimized over millions of images, suchexplanations can easily miss a bigger picture. Knowing how entireclasses are represented inside of a model is important for trusting amodel’s predictions and deciphering what a model has learned [46],since these representations are used in diverse tasks like detectingbreast cancer [33, 54], predicting poverty from satellite imagery [23],defending against adversarial attacks [9], transfer learning [43, 59],and image style transfer [15]. For example, high-performance modelscan learn unexpected features and associations that may puzzle modeldevelopers. Conversely, when models perform poorly, developers needto understand their causes to fix them [24, 46]. As demonstrated inFig. 1, I NCEPTION V1, a prevalent, large-scale image classifier, accurately classifies images of tench (yellow-brown fish). However, oursystem, S UMMIT, reveals surprising associations in the network thatcontribute to its final outcome: tench is dependent on an intermediateperson-related “hands holding fish” feature (right callout) influencedby lower-level features like “scales,” “person,” and “fish”. There is alack of research in developing scalable summarization and interactiveinterpretation tools that simultaneously reveal important neurons andtheir relationships. S UMMIT aims to fill this critical research gap.Contributions. In this work, we contribute: S UMMIT, an interactive system for scalable summarization andinterpretation for exploring entire learned classes in prevalent, largescale image classifier models, such as I NCEPTION V1 [56]. S UMMITleverages neural network feature visualization [11, 37, 38, 40, 50] anddataset examples to distill large, complex neural network models intocompact, interactive graph visualizations (Sect. 7). Two new scalable summarization techniques for deep learning interpretability: (1) activation aggregation discovers important neurons(Sect. 6.1), and (2) neuron-influence aggregation identifies relationships among such neurons (Sect. 6.2). These techniques scale tolarge data, e.g., ImageNet ILSVRC 2012 with 1.2M images [47]. Attribution graph, a novel way to summarize and visualize entire classes, by combining our two scalable summarization techniques to reveal crucial neuron associations and substructures thatcontribute to a model’s outcomes, simultaneously highlighting whatfeatures a model detects, and how they are related (Fig. 2). By usinga graph representation, we can leverage the abundant research ingraph algorithms to extract attribution graphs from a network thatshow neuron relationships and substructures within the entire neuralnetwork that contribute to a model’s outcomes (Sect. 6.3). An open-source, web-based implementation that broadens people’s access to interpretability research without the need for advanced computational resources. Our work joins a growing bodyof open-access research that aims to use interactive visualizationto explain complex inner workings of modern machine learningtechniques [25, 39, 52]. Our computational techniques for aggregating activations, aggregating influences, generating attributiongraphs and their data, as well as the S UMMIT visualization, areopen-sourced1 . The system is available at the following public demolink: https://fredhohman.com/summit/.Neural network exploration scenarios. Using S UMMIT, we investigate how a widely-used computer vision model hierarchically buildsits internal representation that has merely been illustrated in previousliterature. We present neural network exploration scenarios whereS UMMIT helps us discover multiple surprising insights into a prevalent,large-scale image classifier’s learned representations and informs futureneural network architecture design (Sect. 8).Broader impact for visualization in AI. We believe our summarization approach that builds entire class representations is an important1 Visualization: https://github.com/fredhohman/summit.Code: a: https://github.com/fredhohman/summit-data.white wolfpointy earwhite wolfClass ImagesAttributionGraphwhite furlegsNeural NetworkFig. 2. A high-level illustration of how we take thousands of images fora given class, e.g., images from white wolf class, compute their topactivations and attributions, and combine them to form an attributiongraph that shows how lower-level features (“legs”) contribute to higherlevel ones (“white fur”), and ultimately the final outcome.step for developing higher-level explanations for neural networks. Wehope our work will inspire deeper engagement from both the information visualization and machine learning communities to further develophuman-centered tools for artificial intelligence [1, 39].2 BACKGROUND FOR N EURAL N ETWORK I NTERPRETABILITYTypically, a neural network is given an input data instance (e.g., animage) and computes transformations on this instance until ultimatelyproducing a probability for prediction. Inside the network at eachlayer, each neuron (i.e., channel) detects a particular feature from theinput. However, since deep learning models learn these features throughtraining, research in interpretability investigates how to make sense ofwhat specific features a network has detected. We provide an overviewof existing activation-based methods for interpretability, a commonapproach to understand how neural networks operate internally thatconsiders the magnitude of each detected feature inside hidden layers.2.1 Understanding Neuron ActivationsNeuron activations as features for interpretable explanations.There have been many approaches that use neuron activations as features for interpretable explanations of neural network decisions. TCAVvectorizes activations in each layer and uses the vectors in a binary classification task for determining an interpretable concept’s relevance (e.g.,striped pattern) in model’s decision for a specific class (e.g., zebra) [27].Network Dissection [4] and Net2Vec [12] propose methods to quantifyinterpretability by measuring alignment between filter activations andconcepts. ActiVis visualizes activation patterns in an interactive tableview, where the columns are neurons in a network and rows are datainstances [24]. This table unifies instance-level and subset-level analysis, which enables users to explore inside neural networks and visuallycompare activation patterns across images, subsets, and classes.Visualizing neurons with their activation. Instead of only considering the magnitude of activations, another technique called featurevisualization algorithmically generates synthetic images that maximizea particular neuron [7, 11, 37, 38, 40, 50]. Since these feature visualizations optimize over a single neuron, users can begin to decipherwhat feature a single neuron may have learned. These techniques haveprovided strong evidence of how neural networks build their internal hierarchical representations [60]. Fig. 3 presents widely shared examplesof how neural networks learn hierarchical features by showing neuronfeature visualizations. It is commonly thought that neurons in lowerlayers in a network learn low-level features, such as edges and textures,while neurons in later layers learn more complicated parts and objects,like faces (Fig. 3). In our work, we crystallize this belief by leveragingfeature visualization to identify what features a model has detected, andhow they are related.2.2 Towards Higher-level Deep Learning InterpretationIt is not uncommon for modern, state-of-the-art neural networks tocontain hundreds of thousands of neurons; visualizing all of them isineffective. To address this problem, several works have proposed toextract only “important” neurons for a model’s predictions [7, 31, 41].For example, Blocks, a visual analytics system, shows that class confusion patterns follow a hierarchical structure over the classes [5], andActivation Atlases, large-scale dimensionality reductions, show many
averaged activations [7]. Both visualizations reveal interesting properties of neural networks. However, they either (1) consider activationsindependent of their learned connections, (2) depend on randomizedsampling techniques, or (3) are computationally expensive. S UMMITaddresses these issues by: (1) combining both activations and relationships between network layers, as only knowing the most importantneurons is not sufficient for determining how a model made a prediction — the relationships between highly contributing neurons are keyto understanding how learned features are combined inside a network;(2) leveraging entire datasets; and (3) integrating scalable techniques.Since feature visualization has shown that neurons detect more complicated features towards a network’s output, it is reasonable to hypothesize that feature construction is the collaborative combination of manydifferent features from previous layers [4, 12, 48]. Our visualizationcommunity has started to investigate this hypothesis. For example,one of the earlier visual analytics approaches, CNNVis, derives neuronconnections for model diagnosis and refinement, but did not scale tolarge datasets with many classes [32]. In the context of adversarialmachine learning, AEVis uses backpropagation to identify where in anetwork the data paths of a benign and attacked instance diverge [31].AEVis demonstrates its approach on single and small sets of images;it is unclear how the approach’s integral approximation optimizationtechniques scale to large, entire datasets, such as ImageNet. Anotherexample, Building Blocks, pro
Fig. 1. With Summit, users can scalably summarize and interactively interpret deep neural networks by visualizing what features a network detects and how they are related. In this example, I NCEPTIONV1 accurately classifies images of tench (yellow-brown fish). However, SUMMIT reveals surprising associations in the network (e.g., using parts of people) that contribute to its final outcome .