Transcription
Drinking and Driving in GreeceGeorge Yannis, Professor NTUAPanagiotis Papantoniou, Research Associate NTUAKaterina Folla, PhD Candidate NTUAAthens, 21 June 2018
Presentation Outline Introduction Greece in Europe and the World Drink and drive characteristics in Greece Driver attitudes towards drink and drive ConclusionsGeorge Yannis, Drinking and Driving in Greece
Introduction Despite high levels of community education andsustained enforcement, alcohol-related accidentsand drink-driving offences continue to pose athreat to road safety Excess alcohol contributes to about 25% of allroad deaths in Europe With a BAC of 1.5g/l the crash rate for fatalcrashes is about 200 times that of sober drivers Compared to other global regions, Europe is byfar the heaviest drinking region of the worldGeorge Yannis, Drinking and Driving in Greece
Greece in Europe and the World
Data SourcesIn order to present the overall drink drivingsituation in Greece several data sourceswere investigated including: “How traffic law enforcement cancontribute to safer roads” - ETSC PINFlash Report 31 “Alcohol-related road casualties in officialcrash statistics” - OECD/ITF Hellenic Statistical Authority - EL.STAT. E-survey of Road Users’ Attitudes - ESRA Social Attitudes to Road Traffic Risk inEurope – SARTRE4George Yannis, Drinking and Driving in Greece
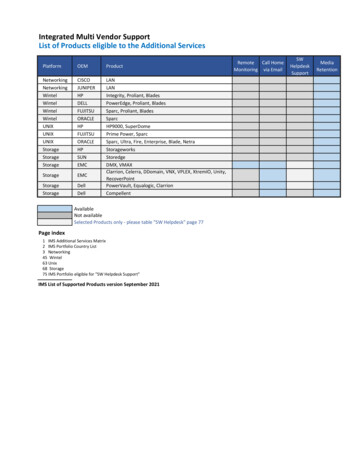
Road deaths attributed to drink driving evolution In the majority of countries, progress inreducing drink driving has contributedmore than its share to overall reductionsin deaths. In Cyprus, drink driving deaths were cutby 16% faster than other road deathseach year on average since 2010, inCroatia by 11% and in Israel and Latvia by10% In Slovakia, Serbia, Greece, Sweden,Great Britain, Romania, Austria, Estonia,Poland and Lithuania developments indrink driving deaths have slowed downoverall progress in reducing road deathsGeorge Yannis, Drinking and Driving in GreeceDifference between the average annual change (%) in the numberof road deaths attributed to alcohol and the correspondingreduction for other road deaths over the period 2010-2015.Source: ETSC, 2016
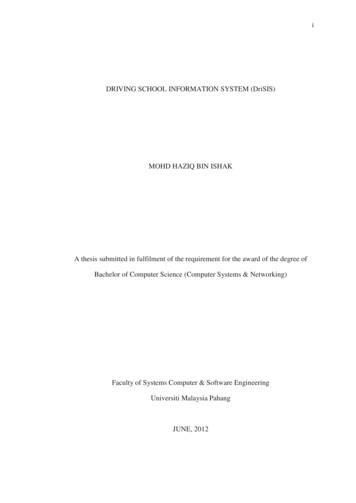
Share of alcohol-related road fatalities In general, the share ofalcohol-related fatalities hasremained stable over the years 16 countries had an increasedproportion of alcohol-relatedfatalities In 2010, the share of alcoholrelated fatalities ranged fromapproximately 5% to 35%Source: OECD/ITF (2017). Alcohol-related road casualties in official crash statistics. InternationalTransport Forum, Paris.George Yannis, Drinking and Driving in Greece In ten countries more than 30%of road fatalities were alcoholrelated
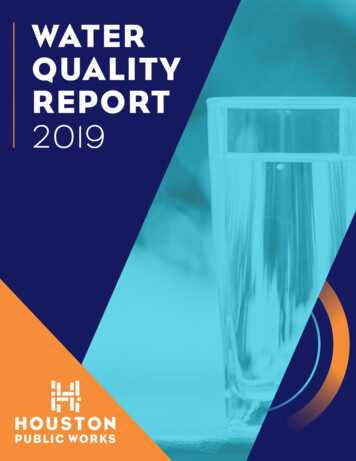
Share of alcohol-related road serious injuries The average share of alcoholrelated injuries remained quitestable between 2000 (12.3%)and 2010 (11.3%) The highest shares of alcoholrelated serious road-injurieswere found in New Zealand(23%) and Greece (23%)Source: OECD/ITF (2017). Alcohol-related road casualties in official crash statistics. InternationalTransport Forum, Paris.George Yannis, Drinking and Driving in Greece The lowest share was recordedin Japan (1.6%)
Drink and drive characteristics in Greece
ELSTAT - Alcohol-related casualties (1/2)Percentage of drivers (Killed / Injured) involved in road accidents with alcotest result “more than 0,5gr/lt” in Greece per total number of drivers (Killed / Injured), 2007 - 2016Fatally injuredSeriously injuredSlightly 0Source: ELSTAT, Data processing: NTUAGeorge Yannis, Drinking and Driving in Greece201120122013201420152016
ELSTAT - Alcohol-related casualties (2/2)Number of drivers (injured or not) involved in road injury accidents per alcotest results in 2016Alcotest sample typeTestedAlcotest resultsFatally Seriously Slightly Notinjured injured injured injured1162250,5 - 0,8 gr/lt8181671391.5%2.9%2.0%1.5%0,8 - 1,0 gr/lt41154510.7%1.8%0.6%0.5%1,0 - 1,5 gr/lt192790273.5%4.4%1.1%0.3%more than 1,5 gr/lt313183115.7%5.0%1.0%0.1%No answer given30226768870555.1% 43.3%8.1%7.4%Sum4805797,017 7,42887.6% 94.0% 83.1% 78.1%Not tested68371,429 2,08412.4%Total5486168,446 9,512 100.0% 100.0% 100.0% 100.0%Less than 0,5 gr/ltSource: ELSTAT, Data processing: NTUAGeorge Yannis, Drinking and Driving in Greece5,935 6,495Fatally Seriously SlightlyNotinjured injured injured injured21.2% 36.5% 70.3% 68.3%6.0%16.9% 21.9%
Share of alcohol-related casualtiesCasualties200020052007 2008 2009 2010 2011 2012 2013 2014 20152016Fatalities39%34%28%28%35%34%37% 37% 30%31%25%35%Serious injuries36%21%19%18%21%23%27% 23% hol-related fatalities37%-4.5%-12%Alcohol-related serious injuries33%3.4%-22%Source: ELSTAT, Data processing: NTUAGeorge Yannis, Drinking and Driving in Greece
Alcohol-related driver characteristics35%Killed drivers withBAC 0,5gr/ltTotal number ofkilled drivers30%Killed drivers in road accidents withBAC over 0,5 445-5455-6465 Age GroupKilled drivers in road accidents4%Killed drivers in road accidents withBAC over 0,5 gr/lt2%3%5%2%4%Male96%FemaleGeorge Yannis, Drinking and Driving in GreeceKilled drivers in road accidentsPassenger Car40%45%Motorcycle53%Moped6%Passenger CarMotorcycle40%MopedTruckTruckOtherOther
Driver attitudes towards drink and drive
E-survey of Road Users’ Attitudes-ESRA A joint initiative of 25 countries aiming at collectingcomparable national data on road users’ opinions,attitudes and behaviour with respect to road traffic risks. In total, the first ESRA survey (2015/2016) gathered datafrom more than 26,000 road users including 15,600frequent car drivers. ESRA Core Group:BRSI (Belgium), KFV (Austria), NTUA (Greece), CTL (Italy),ITS (Poland), PRP (Portugal), BFU (Switzerland) The project was funded by the partners’ own resourcesGeorge Yannis, Drinking and Driving in Greecewww.esranet.eu
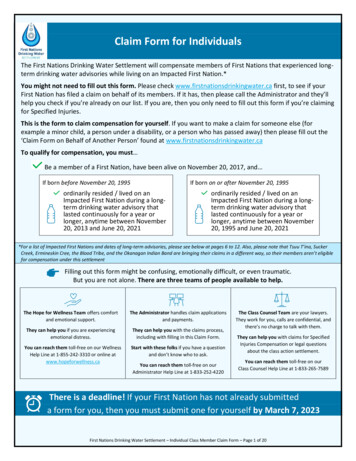
Self-reported behaviour of drink-driving The highest rates of drink driving wererecorded in Belgium (43%), France (41%)and Switzerland (38%) and the lowest inPoland (12%), Sweden (13%) and Finland(18%). The same pattern was found for thosewho had admitted driving when they mayhave been over the legal limit. Thehighest rates were found in France (22%),Belgium (18%) and Switzerland (17%),while the lowest rates were again inFinland (1%), Sweden (2%) and Poland(4%).Source: ESRA, 2016 (www.esranet.eu)George Yannis, Drinking and Driving in SE12%4%0%18%13%2%PL28%20%8%FIOver the last 30days, how manytimes did you drivea car, when youmay have been overthe legal limit fordrinking anddriving?30%7%EUIn the past 12months, as a roaduser, how often didyou drive afterdrinking alcohol?35%13%10%20%30%(%) at least once40%50%
ESRA results regarding Greece 30% in the past 12 months, as a roaduser, drove after drinking alcohol 3,5% feel acceptable to drive when theythink they may have had too much todrink 18,2% feel that it is likely on a typicaljourney to be checked by the policethrough a breathalyzer testBelgian Road Safety Institute (2016). Country fact sheet Greece. ESRA project (European Survey of Road users’ safetyAttitudes). Brussels, Belgium: Belgian Road Safety InstituteGeorge Yannis, Drinking and Driving in Greece
SARTRE-4 Survey The objective of the survey, was to investigate with auniform methodology, the attitudes, opinions, selfreported behaviour and experiences of European drivers,riders and of non-drivers In Greece the sample consisted of 804 participants 602 passenger car drivers 202 motorcycle riders The survey consisted of: Demographic characteristics Driving and alcohol Drug useGeorge Yannis, Drinking and Driving in Greece
SARTRE-4 – Findings (1/2) Passenger car drivers drive under the influence ofalcohol in the age group 25 -54, whilemotorcyclists at younger ages Passenger car drivers driving under the influenceof alcohol are mostly men (3 times more thanwomen) Drivers of both groups who have alcohol-drivenfriends also do the same (1.5 time more themotorcyclists) Both groups of drivers drive under the influenceof alcohol if they feel they can drive safelyGeorge Yannis, Drinking and Driving in Greece
SARTRE-4 – Findings (2/2) Drivers and motorcyclists with a high level ofeducation are less likely to drive under theinfluence of alcohol than those with low educationlevel (6 times less in motorcyclists) Passenger car drivers stated that the alcohol limitshould be higher, drive under the influence ofalcohol more often Motorcyclists stated that driving under theinfluence of drugs is risky are not driving underthe influence of alcoholGeorge Yannis, Drinking and Driving in Greece
Conclusions
Key findings The Alcohol-related road safety indicators remainhigh in Greece and do not follow the decreasingtrend of most road safety indicators The level of personal acceptability of drink and drivein Greece is the highest among the Europeancountries (11,8%) Men drivers especially in the age group of 35-54years old are the most prone drivers in alcoholrelated accidents 40% of killed drivers in road accidents with BAC over0,5 gr/lt in 2016 in Greece are motorcyclistsGeorge Yannis, Drinking and Driving in Greece
Priority measures Enforcement of the legal alcohol limit is the mostefficient method to reduce drink and drive Monitoring alcotest controls and results togetherwith related driver behaviour is essential for anyroad safety policy (accountability) Education and information campaigns including: Education and training programmes Driver rehabilitation courses Targeted public campaigns Compulsory introduction of alcohol interlocksystems in all new vehicles (including PTWs)George Yannis, Drinking and Driving in Greece
Drinking and Driving in GreeceGeorge Yannis, Professor NTUAPanagiotis Papantoniou, Research Associate NTUAKaterina Folla, Phd Candidate NTUAAthens, 21 June 2018
Source: ETSC, 2016 George Yannis, Drinking and Driving in Greece. Share of alcohol-related road fatalities In general, the share of alcohol-related fatalities has remained stable over the years 16 countries had an increased proportion of alcohol-related fatalities