Transcription
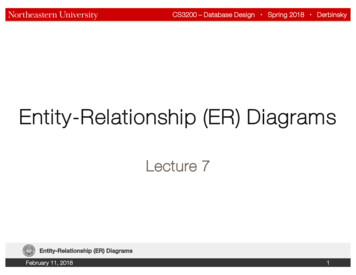
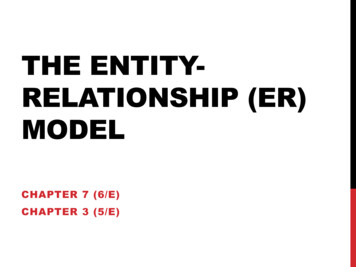
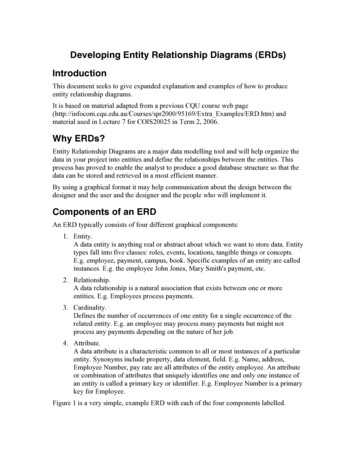
Developing Entity Relationship Diagrams (ERDs)IntroductionThis document seeks to give expanded explanation and examples of how to produceentity relationship diagrams.It is based on material adapted from a previous CQU course web 69/Extra Examples/ERD.htm) andmaterial used in Lecture 7 for COIS20025 in Term 2, 2006.Why ERDs?Entity Relationship Diagrams are a major data modelling tool and will help organize thedata in your project into entities and define the relationships between the entities. Thisprocess has proved to enable the analyst to produce a good database structure so that thedata can be stored and retrieved in a most efficient manner.By using a graphical format it may help communication about the design between thedesigner and the user and the designer and the people who will implement it.Components of an ERDAn ERD typically consists of four different graphical components:1. Entity.A data entity is anything real or abstract about which we want to store data. Entitytypes fall into five classes: roles, events, locations, tangible things or concepts.E.g. employee, payment, campus, book. Specific examples of an entity are calledinstances. E.g. the employee John Jones, Mary Smith's payment, etc.2. Relationship.A data relationship is a natural association that exists between one or moreentities. E.g. Employees process payments.3. Cardinality.Defines the number of occurrences of one entity for a single occurrence of therelated entity. E.g. an employee may process many payments but might notprocess any payments depending on the nature of her job.4. Attribute.A data attribute is a characteristic common to all or most instances of a particularentity. Synonyms include property, data element, field. E.g. Name, address,Employee Number, pay rate are all attributes of the entity employee. An attributeor combination of attributes that uniquely identifies one and only one instance ofan entity is called a primary key or identifier. E.g. Employee Number is a primarykey for Employee.Figure 1 is a very simple, example ERD with each of the four components labelled.
Figure 1A simple, example ERDDifferent ERD stylesAs with many data modelling tools there are a number of different styles used to createERDs. This web page dcardinality.htm) lists four different styles for caradinalities.The style used in this course will be the one labelled "Information Engineering".One Methodology for Developing an ERDTypically you will start with a case study or perhaps a logical model of the system to bedeveloped. This document will demonstrate how to use the following process to convertthat information into an ERD.The process has ten steps:1. Identify EntitiesIdentify the roles, events, locations, tangible things or concepts about which theend-users want to store data.2. Find RelationshipsFind the natural associations between pairs of entities using a relationship matrix.3. Draw Rough ERDPut entities in rectangles and relationships on line segments connecting theentities.
4. Fill in CardinalityDetermine the number of occurrences of one entity for a single occurrence of therelated entity.5. Define Primary KeysIdentify the data attribute(s) that uniquely identify one and only one occurrence ofeach entity.6. Draw Key-Based ERDEliminate Many-to-Many relationships and include primary and foreign keys ineach entity.7. Identify AttributesName the information details (fields) which are essential to the system underdevelopment.8. Map AttributesFor each attribute, match it with exactly one entity that it describes.9. Draw fully attributed ERDAdjust the ERD from step 6 to account for entities or relationships discovered instep 8.10. Check ResultsDoes the final Entity Relationship Diagram accurately depict the system data?A Simple ExampleThe above process will be illustrated by working through the following example.A company has several departments. Each department has a supervisor and atleast one employee. Employees must be assigned to at least one, but possiblymore departments. At least one employee is assigned to a project, but anemployee may be on vacation and not assigned to any projects. The importantdata fields are the names of the departments, projects, supervisors andemployees, as well as the supervisor and employee number and a uniqueproject number.Each of the following sections corresponds to one of the stages above.Identify entitiesIn this stage, you look through the information about the system and seek to identify theroles, events, locations, concepts and other tangible things that you wish to store dataabout. One approach to this is to work through the information and highlight those wordswhich you think correspond to entities.A company has several departments. Each department has a supervisor andat least one employee. Employees must be assigned to at least one, butpossibly more departments. At least one employee is assigned to a project, butan employee may be on vacation and not assigned to any projects. Theimportant data fields are the names of the departments, projects, supervisors
and employees, as well as the supervisor and employee number and a uniqueproject number.This example is quite simple in that the last couple of lines actually tell you what data isbeing stored and that makes it somewhat easy to identify the entities.You may notice that "company" has been highlighted. It is not an example of an entity.A single company will use the system we are designing to keep track of its departments,projects, supervisors and employees.A true entity should have more than one instance. Our system will probably containinformation about multiple employees, supervisors, projects and departments. But it willonly contain one instance of a company.Find RelationshipsIn this step the aim is to identify the associations, the connections between pairs ofentities. A simple approach to do this is using a relationship matrix. Which is a fancyname for a table that has rows and columns for each of the identified entities.Table 1 is an example relationship matrix for the above example. With four entities thereare four rows and four columns. Each cell is used to indicate whether or not thatcombination of entities has an artmentEmployeeSupervisorProjectTable 1An example relationship matrix.Having created your relationship matrix you should now go through each cell and decidewhether or not there is an association. For example, the first cell on the second row isused to indicate if there is a relationship between the entity "Employee" and the entity"Department". Table 2 is an example relationship matrix that has been completed for thecurrent ectEmployeeIs assignedBelongs toSupervisorRun byProjectWorksonRunsUsesTable 2An example complete relationship matrix.The names placed in the cells are meant to capture/describe the relationships. So you canuse them like this
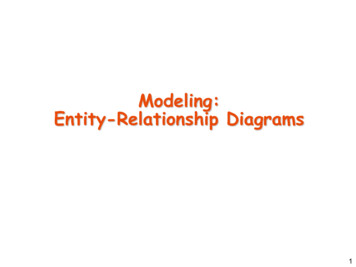
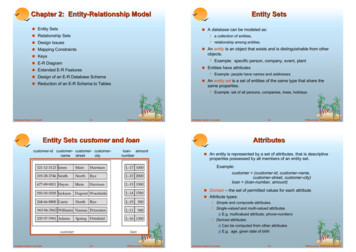
A Department is assigned an employee A Department is run by a supervisor An employee belongs to a department An employee works on a project A supervisor runs a department A project uses an employeeDraw Rough ERDYour completed relationship matrix now contains a list of all the entities and all therelationships between those entities. This is enough information to create a rough ERD.Draw a diagram and: Place all the entities in rectangles Use diamonds and lines to represent the relationships between entities.Obviously, you should lay out the entities so there is no overlap of the relationships.Figure 2 is an example rough ERD that represents the content of Table 2.Figure 2An example rough ERDFill in CardinalityIn this step we're aiming to identify the number of occurrences of one entity for a singleoccurrence of the related entity. For example, how many supervisors can there be for asingle department? How many departments can a single supervisor be associated with?To answer this you can loop through each entity from our rough diagram and ask thequestion "how many of this entity?" for a single instance of each related entity?
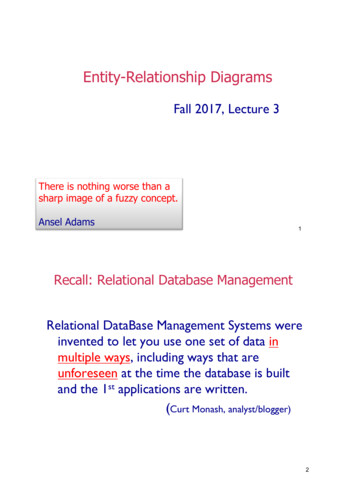
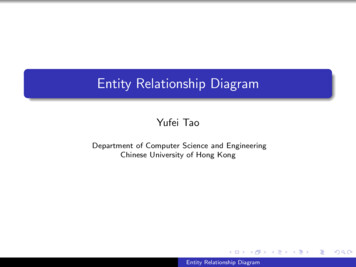
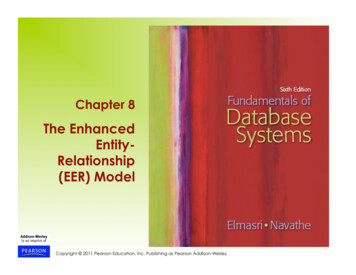
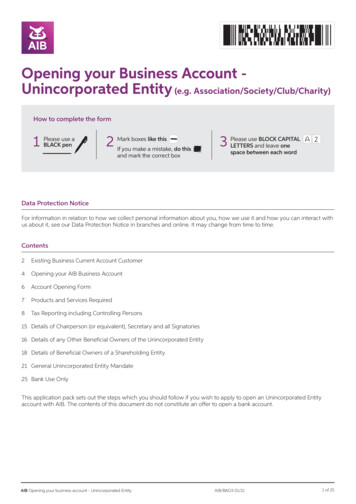
Here's an example drawing on Figure 2 and the case study described above SupervisorEach department has one supervisor. DepartmentEach supervisor has one department.Each employee can belong to one or more departments EmployeeEach department must have one or more employeesEach project must have one or more employees ProjectEach employee can have 0 or more projects.The cardinality of a relationship can only have the following values One and only one One or more Zero or more Zero or oneAn ERD is modified to show this cardinality by place some extra marks on the lineconnecting an entity and a relationship. Figure 3 summarises the marks/notation used inERDs to indicate cardinality.Figure 4 is a modified ERD to show the cardinality of the various relations in ourexample.Define primary keysA primary key is an attribute, or collection of attributes, that can be used to uniquelyidentify a specific instance. My name, "David Jones", is not a primary key as there aremany people with that name. If I was a student at CQU, my student number would be aprimary key as each student number uniquely identifies one and only one student.You identify primary keys by examining and evaluating the information about thesystem. In this example, the following are specified as unique identifiers: DepartmentName, Supervisor Number, Employee Number and Project Number.Typically you are looking for a primary key for each entity. You can modify your ERD(e.g. Figure 5) to include the primary keys as attributes to the related entities.
Figure 3Cardinality ERD notationFigure 4Rough ERD plus Cardinality
Figure 5Rough ERD plus Primary KeysDraw Key-Based ERDThis step cleans up some of the shortcomings of the ERD created so far. In particular, itinvolves Eliminating many-to-many relationships, and Adding Primary and Foreign keys for each entity (a task I started in the last step)What is a many-to-many relationshipA many-to-many relationship is a relationship that has a "many" cardinality on either sideof the relationship.In Figure 5 there are three relationships. The following demonstrates which, if any, ofthese relationships are a many-to-many relationship.1. Run byThe cardinality on both sides of this relationship is "one and only one". This isshown by the two vertical bars on either side (see Figure 3). So this is not amany-to-many relationship.2. Is AssignedThe cardinality on both sides of the relationship is indicated by an "arrow" with asingle line. According to Figure 3 this means that it is a "one or more"cardinality. The "more" is the same as "many". So both cardinalities include"many". There is a "many" cardinality on both sides of the relationship. This is amany-to-many relationship.3. Works onUsing Figure 3 you should be able to work out that one cardinality is "one or
more" and the other is "zero or more". Both sides contain "more" which is thesame as "many" and so this is a many-to-many relationship.Why are many-to-many relationships bad?Two of the reasons why many-to-many relationships are bad and should be removedfrom an ERD include:1. They can't be represented in relational databases.2. You often wish to record information about a many-to-many relationship.For example, you may wish to record when an employee starts working on aproject. With the current ERD you wouldn't be able to store this information. Itis not information that belongs in either the Employee or the Project entity.At this stage, all you really need know is you have to get rid of them.How do you get rid of many-to-many relationships?The simple answer is that you replace the relationship with an associative entity. Thissplits the relationship into two relationships, each will be a one-to-many relationship.So the "Department is assigned an employee" many-to-many relationship becomes twoseparate relationships:1. A single Department entity is assigned many Employee-Department entities.2. An Employee-Department entity includes a single Department entity.Figure 6 is an ERD that represents this change. From this you can see that the EmployeeDepartment entity has a primary key that consists of both Employee Number andDepartment Name. This combination of two fields uniquely identifies each instance ofthis entity. So if we wished to store information about the date an employee startedworking for a department we would store it with this entity.A similar change happens with the "Works on" relationship. This is shown in Figure 7.Both Figure 6 and Figure 7 would be combined in a final ERD. Shown later on.
Figure 6ERD representing Employee-Department Associative EntityFigure 7ERD representing Employee-Project Associative EntityIdentify AttributesA data attribute is a characteristic common to all or most instances of a particular entity.In this step we try to identify and name all the attributes essential to the system we arestudying without trying to match them to particular entities. The best way to do this is tostudy the forms, files and reports currently kept by the users of the system and circle eachdata item on the paper copy. Cross out those which will not be transferred to the new
system, extraneous items such as signatures, and constant information which is the samefor all instances of the form (e.g. your company name and address). The remainingcircled items should represent the attributes you need. You should always verify thesewith your system users. (Sometimes forms or reports are out of date.)The only attributes indicated are the names of the departments, projects, supervisors andemployees, as well as the supervisor and employee NUMBER and a unique projectnumber.Map AttributesFor each attribute we need to match it with exactly one entity. Often it seems like anattribute should go with more than one entity (e.g. Name). In
Does the final Entity Relationship Diagram accurately depict the system data? A Simple Example The above process will be illustrated by working through the following example. A company has several departments. Each department has a supervisor and at least one employee. Employees must be assigned to at least one, but possibly more departments. At least one employee is assigned to a File Size: 443KBPage Count: 12