Transcription
View metadata, citation and similar papers at core.ac.ukbrought to you byCOREprovided by Texas A&M RepositoryINTERFERON REGULATORY FACTOR 6 REGULATES MACROPHAGEPOLARIZATIONAn Undergraduate Research Scholars ThesisbyTYLER BREHMSubmitted to Honors and Undergraduate ResearchTexas A&M Universityin partial fulfillment of the requirements for the designation as anUNDERGRADUATE RESEARCH SCHOLARApproved byResearch Advisor:Dr. Beiyan ZhouMay 2015Major: Chemical Engineering
TABLE OF CONTENTSPageABSTRACT. 1CHAPTERIINTRODUCTION . 3IIMETHODS . 5Bone marrow isolation and macrophage differentiation . 5Macrophage polarization analysis. 5Flow cytometry analysis . 5Western blotting . 6Quantitative real-time PCR (qRT-PCR) analysis . 6Luciferase Reporter Assay . 6Gain and loss of IRF6 assays . 7Chromatin immunoprecipitation (ChIP) assay . 7Data and statistical analyses. 7IIIRESULTS . 8IRF6 differentially expressed in macrophages . 8IRF6 expression is diminished in M2 macrophage. 8IRF6 stalls M2 activation . 9IRF6 directly inhibits PPARγ expression by binding to its promoter . 13IVCONCLUSIONS . 15REFERENCES . 18
ABSTRACTInterferon Regulatory Factor 6 Regulates Macrophage Polarization. (May 2015)Tyler BrehmDepartment of Chemical EngineeringTexas A&M UniversityResearch Advisor: Dr. Beiyan ZhouDepartment of Veterinary Physiology and PharmacologyUnder obese stress, adipose tissue macrophages (ATMs) undergo a phenotypic switch from antiinflammatory status (M2) to proinflammatory (M1) status, a major contributor to the developmentof chronic tissue inflammation and insulin resistance which are causal factors for type II diabetes.However, the mechanisms underlying the control of macrophage activation statuses have not beenfully elucidated. In this study, we demonstrate that interferon regulatory factor 6 (IRF6) exerts aprofound impact on macrophage polarization.Interestingly, we observed that the expression of IRF6 was dramatically suppressed in M2macrophages upon IL4 stimulation, but not in LPS-activated M1 macrophages, as compared tonaive (M0) macrophages. In addition, IRF6 expression differs distinctly between lean and obeseATMs. We further investigated the role of IRF6 using gain and loss of function strategies in a welldefined in vitro system. Knockdown of IRF6 with a gene-specific shRNA successfully suppressedIRF6 expression level in macrophages. Interestingly, significantly enhanced M2 responses weredemonstrated by elevated levels of the activation-related cell surface markers CD69 and CD86 andthe expression of M2-related genes including IRF4, PPARγ, Arginase1, and IL10. Conversely,bone marrow derived macrophages (BMDMs) with ectopic expression of IRF6 displayed blunted1
M2 responses in the presence of IL4, compared to the M2 BMDMs transfected with an emptyvector. In addition, the gain or loss of IRF6 expression did not significantly affect M1 responses ofBMDMs upon LPS stimulation, suggesting the regulatory effect of IRF6 primarily acts onenhancing macrophage alternative activation.In summary, our findings identified a novel transcription factor, IRF6, in mediating macrophagealternative activation program. Further analysis of IRF6 in controlling ATM activaton in the obesecontext will provide crucial information to understand the ATM action and their contribution toadipose tissue function and subsequent obesity-induced chronic inflammation and insulinresistance.2
CHAPTER IINTRODUCTIONMacrophages display a phenotypic spectrum ranging from pro-inflammatory (classicallyactivated) M1 to anti-inflammatory (alternatively activated) M2.1 M1 activation occurs inresponse to exposure to T helper type 1 cytokines or stimulation with lipopolysaccharide (LPS)or free fatty acids.2, 3 In contrast, Th2 cytokines including interleukin 4 (IL4) and IL13 induceM2 expression.4, 5 M2 macrophages function in tissue remodeling and repair and arephenotypically favored in lean adipose tissue macrophages (ATMs). The ATM composition isextremely important for physiological function. On a high fat diet, both M1 and M2 macrophageabundance increase in adipose tissue.6 However, the increase is significantly more for the M1subclass, which leads to chronic inflammation and insulin resistance.7-9 Despite a significantamount of research, the molecular mechanisms regulating macrophage polarization have yet tobe fully elucidated.Interferon regulatory factors (IRFs) are a family of nuclear transcription factors, many of whichregulate immune cell maturation. Each IRF share a homology with their N-terminal DNAbinding domain and recognize a consensus DNA sequence, known as the IFN-stimulatedresponse element.10 Several members of the IRF family have been demonstrated to play animportant role in the determination of macrophage phenotypes.11 IRF1, IRF3, and IRF4 all favorthe M2 anti-inflammatory phenotype. Conversely, IRF5 and IRF8 promote M1 inflammatorymacrophage responses. IRF4 in particular is a potent regulator of M2 activation and may alsoparticipate in negative-feedback regulation of TLR signaling.12, 13 Investigation into IRF3
expression revealed that IRF4 and IRF6 have differential expression levels between M0, M1, andM2. While the importance of IRF4 has already been established, the role of IRF6 in macrophagepolarization has yet to be elucidated. IRF6 mutations have been linked to Van der Woude andpopliteal pterygium syndromes but no link with adipose tissue inflammation has been discoveredyet.14 Our study shows the importance of IRF6 in regulating the macrophage polarizationprocess.4
CHAPTER IIMETHODSBone marrow isolation and macrophage differentiationBone marrow-derived macrophages (BMDMs) were obtained as described previously. After redblood cell lysis, bone marrow cells were seeded at 2 106 cells/mL with Iscove’s ModifiedDulbecco’s Medium (IMDM) medium containing 10% FBS and 15% L929 culture supernatantas a source of granulocyte macrophage colony-stimulating factor (GM-CSF) for differentiationof bone marrow cells to monocytes. After 7 days, the formation of mature monocytes wasevaluated by flow cytometry using antibodies against CD11b and F4/80.Macrophage polarization analysisBMDMs were stimulated by lipopolysaccharide (LPS; 100 ng/mL) for M1 activation or IL4 (20ng/mL) for M2 activation. After 48 h of stimulation, BMDMs were examined for activation ofexpression of associated surface antigens CD69 and CD86 using flow cytometry.Flow cytometry analysisUnless specified, antibodies were obtained from eBioscience. BMDMs were stained withfluorescence-conjugated antibodies to detect their activation. Activation of macrophages wasdetected using antibodies against F4/80 (Cat. No. 53-4801), CD11b (Cat. No. 45-0112), CD86(Cat. No. 17-0862), and CD69 (Cat. No. 12-0691). Flow cytometry analysis was performedusing Accuri C6 (BD Bioscience), and results were analyzed using Flowjo or Accuri C6 software(BD Bioscience).5
Western blottingTotal protein was extracted from BMDMs using a Radio-Immunoprecipitation Assay (RIPA)buffer (Cat. No. 9806S; Cell Signaling Technology ), and protein concentrations weredetermined using the Bradford assay. Proteins were separated on PROTEAN TGX Stain-FreeTMPrecast Gel (Cat. No. 456-8081; Bio-Rad) and transferred onto a polyvinylidene fluoride (PVDF)membrane followed by detection using antibodies directed against IRF6.Quantitative real-time PCR (qRT-PCR) analysisTotal RNA was extracted from BMDMs using the Trizol extraction protocol according to themanufacturer’s instructions (Cat. No. R2052; Zymo Research). Gene expression analysis wasperformed using an iScript One-Step RT-PCR kit with SYBR Green (Cat.No. 170-8893; BioRad) on Bio-Rad CFX384 (Bio-Rad). The data presented correspond to the mean of 2-ΔΔCt fromat least three independent experiments after being normalized to β-actin.Luciferase Reporter AssayThe luciferase reporter assay was carried out as described previously. To verify that IRF6 bindsto the upstream region of PPARγ, a 478-bp DNA fragment (-1857 to -1379 relative to the 5’ end)within upstream region of PPARγ was inserted into upstream of the firefly luciferase expressioncassette of the pGL3 basic vector (Cat. No. E1751; Promega). The luciferase activity wasdetermined by transient transfection of the murine macrophage cell line RAW264.7 with BrightGlo luciferase reporter system (Cat. No. E2620; Promega) and normalized to the internal controlfirefly luciferase activity.6
Gain and loss of IRF6 assaysTo overexpress IRF6, the open reading frame (ORF) sequence of IRF6 was inserted into thedownstream portion of the CMV promoter of XZ201 construct. To knockdown the expression ofIRF6, the pLKO.1-CMV-TurboGFPTM vector (Sigma-Aldrich) with inserted short hairpin RNA(shRNA; targeting IRF6) was generated. The empty vector was used as the control.Chromatin immunoprecipitation (ChIP) assayChIP assays were performed as described previously. Briefly, M2 BMDMs were cross-linked for10 min with 1% formaldehyde and quenched with 125mM glycine. After nuclei were isolated bycentrifugation, the pellet was resuspended in lysis buffer containing 0.1% SDS and sonicated toachieve fragment sizes of 200-500bp. The immunoprecipitation was conducted with ChIP-gradeprotein G magnetic beads using an antibody against IRF6 (Cat. No. sc-98829; Santa CruzBiotechnology). IgG protein (Cat. No. ab46540; Abcam) was used as the negative control. Tovalidate the enrichment, quantitative PCR was performed with tiled primers.Data and statistical analysesResults are expressed as means SEM. Each data point derived from qRT-PCR assaysrepresents an average of two technical replicates, and data were averaged over independentlyreplicated experiments (n 3-4 independently collected samples) and analyzed using theStudent’s t test. The overall group-effect was analyzed for significance using two-way ANOVAand Bonferroni post-test for each factor at each individual time. Data analyses were performedusing Graphpad Prism version 6.0 software. A value of P 0.05 was considered statisticallysignificant and is denoted by a *, P 0.01 by **, and P 0.001 by ***.7
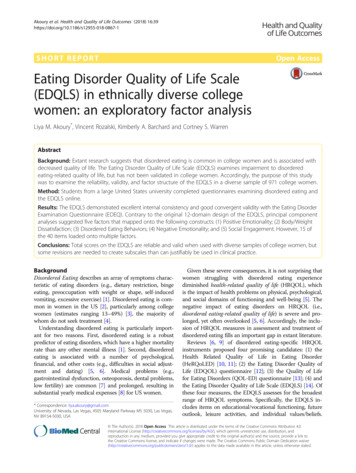
CHAPTER IIIRESULTSIRF6 differentially expressed in macrophagesDue to the significance of the IRF family in regards to macrophage phenotype, we performed ananalysis of IRF expression levels in M0, M1, and M2. The results showed that only IRF4 andIRF6 were differentially expressed among macrophage phenotypes (Figure 1, 2).IRF4*0.060.040.020.00M0*0.8Fold Change Ct0.08Fold Change CtIRF60.60.40.20.0M2**M0M1M2Figure 2: Relative expression of IRF6 is shownfrom a qRT-PCR. The RNA from the M2 and M1cells was taken 48 hours post activationFigure 1: Relative expression of IRF4 is shown from aqRT-PCR. The RNA from the M2 cells was taken 48hours post activationIRF6 expression is diminished in M2 macrophageTo gain initial insights into the role of IRF6 in macrophage activation, we investigated theexpression pattern of IRF6 in response to the stimuli using a well-established in vitro model.Bone marrow-derived macrophages (BMDMs) were treated with LPS (100 ng/mL) for M1activation or IL4 (20 ng/mL) for M2 activation. The macrophage polarization was confirmed bydetermining the expression level of activation-associated cell surface markers CD69 and CD868
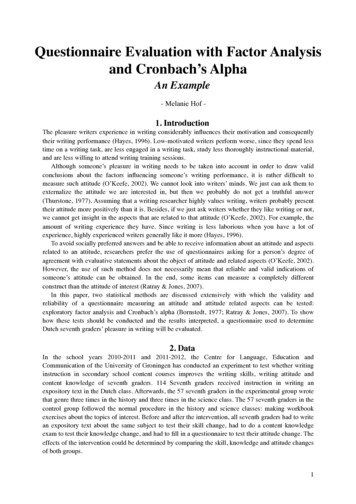
using flow cytometry assays. Interestingly, after 24 hours of IL4 treatment, macrophagesexhibited suppressed expression of IRF6, compared to the native macrophages (M0). In addition,we observed that IRF6 expression was dramatically reduced in M2 macrophages as early as 5 hand maintained till 72 h in response to IL4 exposure (Figure 3). Upon LPS stimulation, M1macrophages maintained similar expression level of IRF6 with M0 macrophages. Thus, theseresults indicate the suppression on expression of IRF6 during M2 activation but not in M1macrophages.**Fold Change gure 3: The 0 hr represents M0, naïve macrophages. The 5hr, 24hr,48hr, and 72hr are all M2 macrophages that have been activated forthat period of time by IL4.IRF6 stalls M2 activationNext, to further investigate if the differentiated expression pattern of IRF6 is crucial formacrophage polarization, we used both gain and loss of IRF6 assays. To ectopic expression ofIRF6, the construct harboring open reading frame (ORF) sequence of IRF6 was transfected intoBMDMs. After validated overexpression of this gene in BMDMs (Figure 4), cells were subjected9
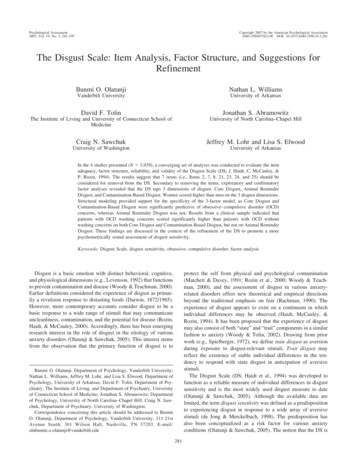
to activation by LPS or IL4, and activation features were evaluated as previously described.After IL4 stimulation, BMDMs transfected with IRF6 overexpression construct showedsuppressed expression of PPARγ that is a key mediator promoting M2 responses, compared tothe cells transfected with empty vector (Figure 5). Consistently, these macrophages with ectopicexpression of IRF6 exhibited blunted M2 activation in response to IL4 stimulation, as evidencedby reduced expression level of activation-related surface markers CD69 and CD86 (Figure 6). Inaddition, we observed that overexpression of IRF6 led to less abundance of interleukin 10 (IL10)and arginase 1 (Arg1) that characterize the M2 phenotype, compared to the cells transfected withempty vector (Figure 4). To knockdown the expression of IRF6, we generated gene specific shorthairpin RNA (shRNA) construct against IRF6 and transfected it into the BMDMs. After loss ofIRF6, M2 macrophages displayed enhanced PPARγ expression upon IL4 stimulation, followedby improved M2 responses including the expression of key genes IL10 and ARG1 andactivation-related cell surface markers CD69 and CD86 (Figure 7, 8).IRF6IRF6***Fold Change CtFold Change Ct300003000020000210M2empty verctor20000210M2oeIRF6***M1empty verctorM1oeIRF6Figure 4: The above data shows the difference in expression for IRF6 when treated with the empty vector ascompared to the overexpression construct.10
CD86, MFICD69, MFI*6000040000200000*2000080000M2empty vector150001000050000M2oeIRF6M2empty vectorM2oeIRF6Figure 6: CD69 and CD86 are activation related cell markers for the macrophage. The decreased expression ofM2 correlates with the gene expression data.11
5000***400020000*40006000CD86, MFICD69, MFI8000300020001000M2empty vector0M2shIRF6M2empty vectorM2shIRF6Figure 8: CD69 and CD86 are activation related cell markers for the macrophage. The increased expression ofM2 correlates with the gene expression data for the shRNA knockdown.IRF6 has a similar structural homology with IRF5,11 which is a critical regulator for M1macrophage responses. However, after LPS stimulation, ectopic or knockdown of IRF6expression had minimal impact on M1 macrophage activation, as evidenced by the expression ofactivation-related cell surface markers and pro-inflammatory cytokines TNFα and IL1β with10000400080003000CD86, MFICD80, MFIcells transfected with empty vector (Figure 9, 10).6000400020000200010000M1empty vectorM1shIRF6M1empty verctorM1shIRF6Figure 9: CD80 and CD86 are activation related cell markers for the macrophage. The lack of a difference inthe expression of the activation related cell markers mirrors the inflammatory gene expression.12
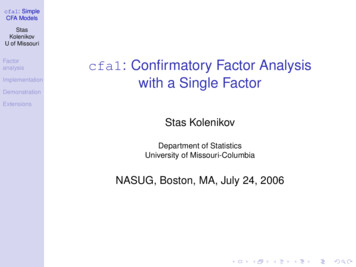
Taken together, these results demonstrate that IRF6 is a critical mediator for macrophage M2activation but has no apparent impact on M1 activation.IRF6 directly inhibits PPARγ expression by binding to its promoterGiven the significant impact on PPARγ expression by IRF6, we surveyed the upstream region ofPPARγ for the interferon-stimulated response elements (ISREs). Using the JASPARalgorithms15, we predicted 4 potential classical ISREs (GAAANNGAAAG/CT/C) within 4kbupstream of PPARγ (Figure 11). To identify the genuine binding sites, we used chromatinimmunoprecipitation (ChIP) methodology with antibodies against IRF6 in nucleolus isolatedfrom alternatively activated BMDMs. The protein/DNA complexes were stabilized byformaldehyde crosslinking and isolated from BMDMs stimulated with IL4, and the sonicatedDNA fragments (200-500bp) were immunoprecipitated using an antibody against IRF6. Theenrichment of ISREs was examined by quantitative PCR with primer pairs flanking each13
predicted ISRE. Interestingly, two ISREs (-2061 to -2057, -1788 to -1782, relative to the 5’ endof PPARγ coding region) displayed significant enrichment as evidenced by the fold changerelative to total DNA input and IgG control (Figure 12).Potential Binding Sites for IRF6-2195-3090-1788-2061Figure 11: The numbers are negative because the binding sites are in the upstream region of thePPARγ gene. The sites highlighted in red exhibited significant DNA enrichment.IRF680IgGPercent of Input6040201.00.80.60.40.20.0-2061 to -2057-1782 to -1778Figure 12: The higher percentage of DNA pulled down withIRF6 as compared to IgG, the control, demonstrates that IRF6binds effectively to the targeted sites.14
CHAPTER IVCONCLUSIONSMacrophages serve as a key mediator of immune responses in response to various stimuli. Awell-orchestrated network tightly regulates the plasticity and functional polarization ofmacrophages and IRFs exert critical roles in controlling macrophage activation throughmodulating the activities TLRs-mediated signaling pathways. However, the impact of IRFs onthe action of PPARγ-dependent signaling, which play a central role in promoting macrophageM2 responses, is unclear. In this study, we provided evidence to support the crucial roles of IRF6in modulating macrophage alternative activation through its regulation on the expression ofPPARγ. Our findings reveal that IRF6 can repress PPARγ expression by directly binding to theISREs located in the PPARγ upstream region, and IL4-induced down-regulation of IRF6expression is critical to initiate PPARγ-dependent alternative M2 activation.The rapid change in expression pattern of IRFs is essential for their transcriptional functions thatsubsequently result in the responses of macrophage encountering distinct stimuli. Indeed, in thisstudy, we observed that IRF6 expression was repressed at the initial period of M2 activation, butthis gene was not responsive to LPS stimulation. These results suggest that the expression ofIRF6 is controlled by IL4-mediated signaling cascades of M2 macrophages. Similarly, other IRFfamily members also display rapid alteration in their expression in macrophages in response tostimuli. For example, upon stimulation by GM-CSF or IFNγ, activation of TLR mediatedsignaling cascade leads to induced IRF5 expression, but its expression is insensitive to IL4stimulation. In contrast, the axis of IL4-STAT6 can enhance the expression of another IRF15
family member IRF4 through binding to the promoter region. In addition, IRF4 is an inducedgene of Jmjd3 by controlling demethylation of H3K27me3.The IRF-dependent pathway is one of main downstream signaling pathways triggered by theactivation of TLRs, exerting essential transcriptional control on gene profiling. Previous studieshave demonstrated that several IRF family members, including IRF1, IRF5, and IRF7, playcritical roles in interacting with MyD88, which subsequently triggers TLR-mediated theexpression of proinflammatory genes. In contrast, loss of these IRFs blunts proinflammatoryresponses of M1 macrophages. Interestingly, IRF4 serves as negative regulator of TLR-mediatedcascade by competing with IRF5 for binding to MyD88. Our study is the first to report that IRF6is critical to control the expression of PPARγ, which is a key regulator in controlling macrophagealternative activation. Previous studies have demonstrated that PPARγ-deficient macrophagesexhibit impaired M2 responses. Upon IL4 stimulation, we observed that the abundance of IRF6was rapidly reduced in macrophages, suggesting that IRF6 acts as a “break” for M2 responses tillencountering Th2 cytokines such as IL4 or IL13. Indeed, we identified two ISREs located within4kb upstream of PPARγ coding region and further validated their interaction with IRF6 tosuppress the expression of PPARγ using a luciferase reporter assay. In addition, ectopicexpression of IRF6 led to further repression on PPARγ expression, whereas knockdown of IRF6resulted in enhanced PPARγ abundance in M2 macrophages. The ISREs can be recognized byIRFs by their helix-turn-helix motif. Given that IRF4 is induced in M2 macrophages,12 it issuggested that IRF4 may enhance PPARγ expression through binding these ISREs located withinpromoter region of PPARγ after removal of IRF6. Indeed, loss of IRF4 can result in blunted M2responses.16
In summary, our findings identified a novel transcription factor, IRF6, in mediating macrophagealternative activation program. Further analysis of IRF6 will provide crucial information tounderstand the macrophage action and may provide new gene targets for drug development tomitigate inflammatory diseases.17
REFERENCES1. Lawrence T and Natoli G. Transcriptional regulation of macrophage polarization:enabling diversity with identity. Nature reviews Immunology. 2011;11:750-61.2. Lumeng CN, Deyoung SM, Bodzin JL and Saltiel AR. Increased inflammatory propertiesof adipose tissue macrophages recruited during diet-induced obesity. Diabetes.2007;56:16-23.3. Shi H, Kokoeva MV, Inouye K, Tzameli I, Yin H and Flier JS. TLR4 links innateimmunity and fatty acid-induced insulin resistance. The Journal of clinical investigation.2006;116:3015-25.4. Odegaard JI, Ricardo-Gonzalez RR, Goforth MH, Morel CR, Subramanian V, MukundanL, Eagle AR, Vats D, Brombacher F, Ferrante AW and Chawla A. Macrophage-specificPPAR gamma controls alternative activation and improves insulin resistance. Nature.2007;447:1116-U12.5. Stein M, Keshav S, Harris N and Gordon S. Interleukin 4 potently enhances murinemacrophage mannose receptor activity: a marker of alternative immunologic macrophageactivation. The Journal of experimental medicine. 1992;176:287-92.6. Olefsky JM and Glass CK. Macrophages, inflammation, and insulin resistance. Annualreview of physiology. 2010;72:219-46.7. Lumeng CN and Saltiel AR. Inflammatory links between obesity and metabolic disease.Journal of Clinical Investigation. 2011;121:2111-2117.8. McNelis JC and Olefsky JM. Macrophages, Immunity, and Metabolic Disease. Immunity.2014;41:36-48.9. Weisberg SP, McCann D, Desai M, Rosenbaum M, Leibel RL and Ferrante AW. Obesityis associated with macrophage accumulation in adipose tissue. Journal of ClinicalInvestigation. 2003;112:1796-1808.18
10. Negishi H, Fujita Y, Yanai H, Sakaguchi S, Ouyang X, Shinohara M, Takayanagi H,Ohba Y, Taniguchi T and Honda K. Evidence for licensing of IFN-gamma-induced IFNregulatory factor 1 transcription factor by MyD88 in Toll-like receptor-dependent geneinduction program. Proceedings of the National Academy of Sciences of the United Statesof America. 2006;103:15136-41.11. Gunthner R and Anders HJ. Interferon-Regulatory Factors Determine MacrophagePhenotype Polarization. Mediat Inflamm. 2013.12. Eguchi J, Kong XX, Tenta M, Wang X, Kang SN and Rosen ED. Interferon RegulatoryFactor 4 Regulates Obesity-Induced Inflammation Through Regulation of Adipose TissueMacrophage Polarization. Diabetes. 2013;62:3394-3403.13. Negishi H, Ohba Y, Yanai H, Takaoka A, Honma K, Yui K, Matsuyama T, Taniguchi Tand Honda K. Negative regulation of Toll-like-receptor signaling by IRF-4. Proceedingsof the National Academy of Sciences of the United States of America. 2005;102:1598994.14. Kondo S, Schutte BC, Richardson RJ, Bjork BC, Knight AS, Watanabe Y, Howard E, deLima RL, Daack-Hirsch S, Sander A, McDonald-McGinn DM, Zackai EH, Lammer EJ,Aylsworth AS, Ardinger HH, Lidral AC, Pober BR, Moreno L, Arcos-Burgos M,Valencia C, Houdayer C, Bahuau M, Moretti-Ferreira D, Richieri-Costa A, Dixon MJand Murray JC. Mutations in IRF6 cause Van der Woude and popliteal pterygiumsyndromes. Nature genetics. 2002;32:285-9.15. Mathelier, A., Zhao, X., Zhang, A. W., Parcy, F., Worsley-Hunt, R., Arenillas, D. J.,Buchman, S., Chen, C.-y., Chou, A., Ienasescu, H., Lim, J., Shyr, C., Tan, G., Zhou, M.,Lenhard, B., Sandelin, A. and Wasserman, W. W. JASPAR 2014: an extensivelyexpanded and updated open-access database of transcription factor binding profiles.Nucleic Acids Research, 2013.19
20
Flow cytometry analysis Unless specified, antibodies were obtained from eBioscience. BMDMs were stained with fluorescence-conjugated antibodies to detect their activation. Activation of macrophages was detected using antibodies against F4/80 (Cat. No. 53-4801), CD11b (Cat. No. 45-0112), CD86 (Cat. No. 17-0862), and CD69 (Cat. No. 12-0691). Flow .