Transcription
RURAL ENVIRONMENT. EDUCATION. PERSONALITY. Vol.11. ISSN 2255-808XJelgava, 11-12 May 2018DOI: 10.22616/REEP.2018.034Your Experience is Important!The User Experience Questionnaire (UEQ) - Estonian VersionJana Kadastik1 MA; Tiia Artla2 MA; Martin Schrepp3 PhDTallinn University, Estonia1, 2, SAP SE, Germany3janajana@tlu.ee1; tiiartla@tlu.ee2; martin.schrepp@sap.com2Abstract: The User Experience Questionnaire (UEQ) is a measuring instrument for evaluatingsubjective experience of the users of interactive products. The study set out to adapt the UEQ to theEstonian language and to use it for evaluating everyday objects (learning tools), i.e. to test if the UEQcan be used also for a class of objects that were not in the scope of the construction of the UEQ. Thedata analysis is based on the instrument developed by the creators of the UEQ: UEQ Data Analysis Tool.It can be concluded from the study that the adaptation of the UEQ to the Estonian language wassuccessful as the measurable values were mostly within the permissible range. Although the scaleDependability has a smaller consistency value, it is not small enough to indicate a significant problem.The study demonstrated that it is possible to use an instrument originally designed to assess interactiveproducts for assessing non-interactive products. Thus, the questionnaire is presumably applicable toassess a range of varied products.Keywords: user experience; measurement; user-centred design; student-centred learning; questionnaire;special education.IntroductionIn education, as well as in designing everyday objects, more and more attention is paid to the learner/userexperiencing positive emotions. For example, in a recent interview J. Groccia admitted that the emotionalside in learning is very important and the learner is able to much better concentrate on learning whenfeeling secure (Merisalu, 2015). When the focus of the design changes from a “well-fare” to a “well-being”society, the possibility of designing for happiness may also arise (Hassenzahl et al., 2013).Today there is a movement towards an inclusive environment, where increasingly more importance isattached to the need to create products and services that would correspond to the needs of different targetgroups. The authors of this paper focus on education, more specifically on special pedagogy. In theinterests of society as a whole, it is completely natural to expect that all children receive education thatmeets their physical and mental abilities, needs and possibilities. Therefore, learners’ needs should betaken into account when developing learning tools and environments. Research on infants’ toys hasfound that only 5 % of the toys analysed are actually accessible for children with hearing, motor andvisual impairment and did not require any adaptation or help to be played (Perino, 2017). A studyconducted in Estonia shows that to teach children with severe and profound intellectual disabilities andmultiple disabilities mainly learning tools produced by teachers themselves and musical instruments areused. However, it has to be stated that the selected infants’ toys and learning tools made by teachersoften do not take into consideration the special needs arising from the cognitive processes of students.When designing for people with abilities and needs that differ much from the designer’s own experience,it is important to use user-centred design techniques. When working with people with a mentalimpairment, this may be even more important, because the nature, capabilities, limitations and behaviourof the individuals belonging to this target group are very diverse (Hosea, Vermeeren, 2009). Thus, inorder to develop aids that meet students’ (children’s) needs, user feedback should be requested duringthe whole designing process. Different people understand, the term user experience, in very differentways (All About UX, 2017).In this paper, we rely on the definition by M. Hassenzahl (2008): “UX is a momentary, primarilyevaluative feeling (good-bad) while interacting with a product or service. By that, UX shifts attentionfrom the product and materials (i.e., content, function, presentation, interaction) to humans and feelings– the subjective side of product use.” Therefore, user experience is a summary of the findings: fun of use,aesthetics, emotions, stimulation or attractiveness (Cota et al., 2014). The best opportunity would be toask feedback from the users, i.e. children (primary users) themselves. Unfortunately, collecting opinionsfrom children with special needs or infants is complicated, as they either cannot answer or due to their281
RURAL ENVIRONMENT. EDUCATION. PERSONALITY. Vol.11. ISSN 2255-808XJelgava, 11-12 May 2018special need are not able to answer. Since most frequently teachers are the ones who, based on their earlierexperience of work with children with special needs, choose which teaching aids to use, one way is toask the teachers (secondary users) to give feedback on the applicability of a teaching aid and comparethe outcome to the responses received from students. Naturally, it has to be taken into account that in thatcase the notions of the secondary users are not necessarily correct or in keeping with the opinions ofprimary users (Hosea, Vermeeren, 2009). People who design and develop these tools have to address theneeds of secondary users and build them in the design and evaluation process of the system. It may meanthat conflicting needs between primary and secondary users need to be dealt with (Alsos, Svanæs, 2011).It is important that the implementation of an instrument of measuring user experience would allow fastand simple assessment of a teaching aid in different stages of its development. Considering the above,the authors found that the User Experience Questionnaire (UEQ) that is available free of charge (thequestionnaire itself and all material required for data analysis and data interpretation can be downloadedin several languages from www.ueq-online.org) could offer a quick opportunity for comprehensiveassessment of user experience.User Experience QuestionnaireThe User Experience Questionnaire (UEQ) provides an opportunity to quickly assess the experience ofthe users of interactive products. The questionnaire is designed in a format that allows users to instantlyexpress the feelings, impressions and attitudes that they experience when using a product. The scales ofthe UEQ cover a wide range of user experience, measuring classical usability aspects (efficiency,perspicuity, dependability) as well as user experience aspects (originality, stimulation) (User ExperienceQuestionnaire, 2017). The original version of the UEQ was created in the German language in 2006(Laugwitz, Schrepp, Held, 2006). A handbook (Schrepp, 2017) describes the handling an interpretationof the results. In its current form, the UEQ can be easily applied, offering an opportunity for reliable andvalid measurement of user experience, and the received data can complement the data obtained by otherevaluation methods that have subjective quality ratings (Laugwitz, Held, Schrepp, 2008).The 6 scales of the UEQ contain 26 items as follows (Schrepp, Hinderks, Thomaschewski, 2017b). Attractiveness: General impression of the product. Is it liked or disliked by users? Do they perceiveit as attractive, enjoyable or pleasing?6 items: annoying / enjoyable, good / bad, unlikable / pleasing, unpleasant / pleasant, attractive/ unattractive, friendly / unfriendly. Perspicuity: How easy is it to get to know the product? Can it be easily learnt and understood?Is it clear?4 items: not understandable / understandable, easy to learn / difficult to learn, complicated /easy, clear / confusing. Efficiency: Do users have to make an effort to solve their tasks? How efficient and fast is theinteraction? How immediate is the product’s response to user input?4 items: fast / slow, inefficient / efficient, impractical / practical, organized / cluttered. Dependability: Does the interaction allow the user to feel in control? Can the system’s behaviourbe predicted? Does working with the product make the user feel safe?4 items: unpredictable / predictable, obstructive / supportive, secure / not secure, meetsexpectations / does not meet expectations. Stimulation: How exciting and motivating is it to use the product? Does the user have fun?4 items: valuable / inferior, boring / exciting, not interesting / interesting, motivating /demotivating. Novelty: Is the product innovative and creative? Is the users’ attention captured?4 items: creative / dull, inventive / conventional, usual / leading- edge, conservative / innovative.Attractiveness belongs to the dimension of pure valence. Perspicuity, Efficiency and Dependabilityrepresent pragmatic quality (which is goal-directed) and Stimulation and Novelty appear as representativesof hedonic quality (and are not goal-directed) (Schrepp, 2017). It is not assumed that the scales areindependent (Figure 1). The general assumption is that the evaluation of the Attractiveness is based on theimpression towards the other 5 scales, i.e. that the attractiveness is a result of the perceived perspicuity,efficiency, dependability, stimulation and novelty (Schrepp, Hinderks, Thomaschewski, 2017b).282
RURAL ENVIRONMENT. EDUCATION. PERSONALITY. Vol.11. ISSN 2255-808XJelgava, 11-12 May 2018Figure 1. Assumed scale structure of the UEQ (Schrepp, Hinderks, Thomaschewski, 2017b).Figure 2. The English version of the UEQ (Schrepp, Hinderks, Thomaschewski, 2017a).Applying the UEQ does not require much effort. Usually 3-5 minutes are sufficient for a participant toread the instructions and complete the questionnaire. The UEQ can be used in a paper-pencil form aspart of a classical usability test (and this still is the most common application) (Schrepp, Hinderks,Thomaschewski, 2017b). The 26 items of the UEQ are listed in the table below (Figure 2). Each item ofthe UEQ consists of a pair of terms with opposite meanings.283
RURAL ENVIRONMENT. EDUCATION. PERSONALITY. Vol.11. ISSN 2255-808XJelgava, 11-12 May 2018Participants rate each item on a 7-point Likert scale. The answers are scaled from -3 (fully agree withnegative term) to 3 (fully agree with positive term). Half of the items start with the positive term, theothers with the negative term (in randomized order) (Schrepp, Hinderks, Thomaschewski, 2017b).The UEQ is available in 20 languages. An Excel sheet for data analysis, and the UEQ Handbook areavailable free of charge at User Experience Questionnaire homepage (http://www.ueq-online.org).For semantic differentials like the UEQ, it is essential that participants are able to read the items in theirmother tongue (Cota et al., 2014). Therefore, it is important to be able to use the questionnaire in thenative language in Estonia.The goal of the article is to translate the UEQ into the Estonian language and check the applicability ofthe test originally designed to assess interactive products on the assessment of everyday objects (learningtools) and ascertain the reliability of the translated version.MethodologyDevelopment of the Estonian Version of the UEQThe creators of the UEQ (M. Schrepp and A. Hinderks) were contacted by email to ask their permission toadapt the questionnaire to the Estonian language. The authors gave their permission as well as instructionsfor conducting the process. The adaptation was carried out according to the received instructions. Theoriginal German language version as well as the English language version and translations into several otherlanguages are available on the UEQ homepage. The translation into the Estonian language was based onthe German and English language versions. First, it was explained to the translators what the test wasintended to measure and how important it was to select appropriate words in the Estonian language. Next,the translators were able to familiarise themselves with the materials on the UEQ webpage. Whiletranslating the test into Estonian, an analogy with the translation into Portuguese was followed, as in theprocess of translating the relation to the original dimension has to be maintained, i.e. the questionnaire hasto measure the same qualities, which means that the chosen words need to have a similar meaning to theoriginal words and make respondents experience the same feelings when performing the test independentof the language they use (Cota, Thomaschewski, Schrepp, Goncalves, 2014).Firstly, professional English-Estonian and German-Estonian translators carried out the translation intoEstonian. That was followed by the comparison of the two versions of the translation in Estonian andfinding relevant Estonian language synonyms. At the next stage, a professional Estonian language editorchecked the Estonian translation. Thereafter, a user experience specialist assessed the vocabulary usedin the test to ensure its consistency with the daily used special terminology. Then the Estonian versionwas translated back into the English and German languages. An outcome of that process was the versionsin the original languages (German, English), which were identical with the initial versions. The last stepwas testing the Estonian language version of UEQ in practice.Participants and Context of the StudyThe study aimed to focus on the implementation of the UEQ rather than on the assessment of interactiveobjects or teaching materials, to allow us later to use this questionnaire for assessing teaching aids orlearning tools used in special education. It was essential to find participants who would use the same aidsor tools over a certain period of time. Fifty-one students of Tallinn University whose minor subject wasLearning Support and who were taking the course “Play and Movement as Supportive Activity inRemedial Education” participated in the study. They were all native speakers of Estonian.As part of the above course the students made a Bean Bag of cotton fabric, weighing 100g, withmeasurements 15x11cm, filled with different material (rice, peas, beans or buckwheat). During thecourse the students learned how to use the Bean Bags in educational work with children with specialneeds (fine motor skills exercises, various games and motor activities). At the completion of the coursethe students assessed their user experience of utilising the Bean Bags by means of the Estonian languageversion of the UEQ. For that purpose, the participants were first introduced to the questionnaire and theprinciples of assessing user experience. The students were informed that the participation in the studywas voluntary and anonymous.284
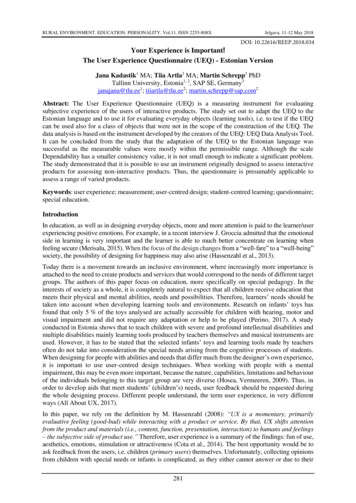
RURAL ENVIRONMENT. EDUCATION. PERSONALITY. Vol.11. ISSN 2255-808XJelgava, 11-12 May 2018Data Collection ProcedureThe Estonian language version of the UEQ was used to measure user experience of special educationleaning tools (Bean Bags). The students participating in the study used a version of the UEQ printed onpaper, marking their responses on the scales with a pen or pencil. To analyse the received data, weapplied the UEQ Data Analysis Tool, which is available free of charge on the UEQ homepage. The goalof this tool is to facilitate the analysis of UEQ data. First, the data obtained from respondents needs tobe entered into the Data Worksheet. The tool then calculates all the statistics necessary to interpret theresults and automatically creates diagrams (User Experience Questionnaire, 2017).Results and DiscussionThe First Evaluation of the Estonian VersionThe data analysis was carried out by means of the instrument developed by the creators of the UEQ: UEQData Analysis Tool, which is downloadable free of charge from the UEQ homepage. The authors of theinstrument have taken into account that UEQ does not produce an overall score for the user experience.Because of the construction of the questionnaire it does not make sense to build such an overall score (forexample by calculating the mean over all scales), since this value cannot be interpreted properly.Detect Suspicious DataNot all participants will always answer all items seriously. To detect such more or less random or notserious answers a simple heuristic is used. All items in a scale should measure a similar quality aspect.The idea to detect random or not serious answers is to check how much the best and worst evaluationsof an item in a scale differ. If there is a big difference ( 3) this is seen as an indicator of a problematicdata pattern. Such situations can also result from random response errors or misunderstanding of anitem. Thus, it makes no sense to consider a response as problematic if this occurs just for a single scale.But if this is true for 2 or 3 scales, it is of course a clear hint that the response is unreliable (UserExperience Questionnaire, 2017).In our study, response errors or misunderstandings were identified in three respondents out of 51participants. Two respondents’ value of the indicator for a problematic data pattern was “4” and that forone respondent was “5”. This means that overall the Estonian language version of the UEQ had beenunderstandable and the majority of the respondents had answered seriously.Cronbach’s Alpha coefficientCronbachs Alpha coefficient (Cronbach, 1951) was calculated for each of the sub-scales. TheCronbach’s Alpha value are: attractiveness 0.86; perspicuity 0.6; efficiency 0.65; dependability 0.52;stimulation 0.8; novelty 0.76. Only the scale Dependability has a smaller consistency value. Similarresults with Cronbach’s Alpha coefficient 0.7 were also received for some subscales on the first-timeuse of the Portuguese and Indonesian language versions (Cota et al., 2014; Santoso et al., 2016). TheIndonesian version also assessed learning tools (although digital ones, in an e-Learning Environment)and the Dependability value was lower (α 0.58), which was associated with the less important role ofthis property for the user experience of a learning platform or with possible problems with theinterpretation of the items in this scale (Santoso et al., 2016). The same may be true of the Estonianversion and, in addition, it may be an effect of the size of the sample. Regarding the Estonian version,some variation may be due to the learning tool (Bean Bag) chosen for the assessment. Although thescale Dependability has a smaller consistency value, it is not small enough to indicate a significantproblem. According to this result, the reliability of the Estonian version of the UEQ is satisfactory.The BenchmarkThe benchmark graph from the Excel-Tool shows the UX quality of the evaluated product. The benchmarkis invaluable in the first-time application of the UEQ to measure a product, i.e. there are no earlierevaluation results available (Schrepp, Hinderks, Thomaschewski, 2017b). The benchmark can be used tocompare the results measured with the UEQ to the results of other products (Santoso et al., 2016). Since285
RURAL ENVIRONMENT. EDUCATION. PERSONALITY. Vol.11. ISSN 2255-808XJelgava, 11-12 May 2018at the present time the benchmark data set only contains a limited number of evaluation results, a decisionwas taken to limit the feedback to 5 categories per scale (Schrepp, Hinderks, Thomaschewski, 2017a): excellent: the product that is evaluated appears among the best 10% of results; good: in the benchmark 10% of the results are better than the evaluated product and 75% areworse; above average: in the benchmark 25% of the results are better than the evaluated product and50% are worse; below average: in the benchmark 50% of the results are better than the evaluated product and25% are worse; bad: the evaluated product is among the worst 25% of the results.The Figure 3 below illustrates the benchmark of the Bean Bags.Figure 3. Visualization of the benchmark of Bean Bags.The line represents the results for the evaluated product. The coloured bars represent the ranges for thescales’ mean values.The creators of the UEQ have taken into account that over time the expectations of the general UX haveincreased. Given the fact that the benchmark also includes data from the measurements of establishedproducts, it is necessary for a new product to achieve the Good standard in all scales (Schrepp, Hinderks,Thomaschewski, 2017b). The results reveal (Figure 3), that the only value that is lower is related toNovelty. This is fully justified, as the Bean Bags were made to match the existing bags that had beenused before and students merely learned to use them as tools to support learning. The benchmark can beused to compare the results of a product measured with the UEQ to the results of other products(Santoso et al., 2016). The developers of the UEQ recognise the need to create different benchmarks fordifferent product categories in the future (Schrepp, Hinderks, Thomaschewski, 2017b).ConclusionThe task of this study was to adapt the UEQ to the Estonian language and to carry out the initialassessment of user experience. It proved a great challenge to test for the first time if the measuringinstrument originally devised to evaluate user experience of interactive products is applicable to assessa non-interactive tool (Bean Bag) used in special needs education. The study allows us to conclude thatthe adaptation of the UEQ to Estonian was successful, since the measurable values were mostly withinthe permissible range. Although the scale Dependability has a smaller consistency value, it is not smallenough to indicate a significant problem. According to this result, the reliability of the Estonian versionof the UEQ is satisfactory.UEQ allows a quick and easy analysis of user feedback on a product. Our study showed that aninstrument originally developed for measuring interactive products could also be used to assess noninteractive objects. This proves that the questionnaire is suitable for evaluating very diverse products.Obviously, in the future when the UEQ is going to be used to assess non-interactive products, it isessential to develop a separate benchmark for that category.The authors of this article were interested in using the UEQ to evaluate learning tools for special needseducation. The UEQ allows, for instance, assessing teachers’ user experience and comparing the receiveddata to students’ user experience. Unfortunately, the UEQ is not suitable for getting feedback form infantsand children with intellectual disabilities (assessment by means of behavioural indicators would be more286
RURAL ENVIRONMENT. EDUCATION. PERSONALITY. Vol.11. ISSN 2255-808XJelgava, 11-12 May 2018appropriate for them, e.g. eye tracking). Presumably, the implementation of the UEQ could be feasiblefor basic school students. At the same time, in the studies of infants and children with intellectualdisabilities (they could be called primary users) a significant role belongs to parents, carers and teachersas well as various specialists (secondary users), who support the children and the cared for in their dailyactivities and learning. They may be considered very important sources of background information. TheUEQ is a perfect tool for assessing the user experience of secondary users, which allows collecting a widerange of background information. Currently the Estonian language version is available free of charge onthe UEQ homepage and for that reason a copy of it has not been attached to the article.Bibliography1. All About UX. (2017). WordPress. Retrieved from http://www.allaboutux.org/2. Alsos O.A., Svanæs D. (2011). Designing for the secondary user experience. In P. Campos, N. Graham,J. Jorge, N. Nunes, P. Palanque, M. Winckler (Eds.), The Proceedings of the International ConferenceHuman-Computer Interaction – INTERACT 2011, 13. Lisbon, Portugal: INTERACT, 84-91.3. Cota M.P., Thomaschewski J., Schrepp M., Goncalves R. (2014). Efficient Measurement of the UserExperience. A Portuguese Version. (5th International Conference on Software Development andTechnologies for Enhancing Accessibility and Fighting Info-exclusion, DSAI 2013). ProcediaComputer Science, 27, 491-498.4. Cronbach L.J. (1951). Coefficient alpha and the internal structure of tests. Psychometrika, 16(3),297-334. Retrieved 03000cac310ffbc5b2cb4fbb9dd5.pdf5. Hassenzahl M. (2008). User experience (UX): Towards an experiential perspective on product quality.In E. Brangier, G. Michel (Eds.), Proceedings of the International Conference of The AssociationFrancophone d'Interaction Homme-Machine, IHM'08, 20, 11-15. Retrieved 2807 User experience UX Towards an experientialperspective on product quality6. Hassenzahl M., Eckoldt K., Diefenbach S., Laschke M., Len E., Joonhwan K. (2013). Designing Momentsof Meaning and Pleasure. Experience Design and Happiness. International Journal of Design, 7(3), 21-31.7. Hosea S.I., Vermeeren A.P.O.S. (2009). Experiences in designing for and with mentally impaired users:the design of a device to structure time and activities. In B. Sapio, L. Haddon, E. Mante-Meijer,L. Fortunaki, T. Turk, E. Loos (Eds.), Conference Proceedings The good, the bad and the challenging –The user and the future of information and communication technologies. Koper: ABS-Center, 816–824.8. Laugwitz B., Held T., Schrepp M. (2008). Construction and evaluation of a user experiencequestionnaire. In A. Holzinger (Ed.), HCI and Usability for Education and Work (USAB 2008), LNCS,5298. Berlin, Heidelberg: Springer, 63-76.9. Laugwitz B., Schrepp M., Held T. (2006). Konstruktion eines Fragebogens zur Messung der UserExperience von Softwareprodukten (Construction of a questionnaire to measure the user experience ofsoftware products). In A.M. Heinecke, H. Paul (Eds.), Mensch und Computer im Strukturwandel.Munchen: Oldenbourg Verlag, 125 – 134. (in German)10. Merisalu M. (2015). Professor: oppimises on olulised ka emotsioonid (Professor: Emotions areimportant in learning). Retrieved from d-ka-emotsioonid11. Perino O. (2017). Play, Toys and Low Technology. The First LUDI Training School “Play and Toysfor All”. Heerlen, NL: Zuyd University.12. Santoso H., Schrepp M., Isal R.Y.K., Utomo A.Y., Priyogi B. (2016). Measuring user experience of EducatorsOnline,13(1),58- 79. Retrieved from oSchreppKartonolsalUtomoPriyogi.pdf13. Schrepp M. (2017). User Experience Questionnaire (UEQ). Retrieved from http://www.ueq-online.org/14. Schrepp M., Hinderks A., Thomaschewski J. (2017a). Design and Evaluation of a Short Version of theUser Experience Questionnaire (UEQ-S). International Journal of Interactive Multimediaand Artificial Intelligence, 4(6), 103-108. Retrieved les/files/2017/09/ijimai20174 6 14 pdf 20309.pdf15. Schrepp M., Hinderks A., Thomaschewski J. (2017b). Construction of a Benchmark for the UserExperience Questionnaire (UEQ). International Journal of Interactive Multimedia and ArtificialIntelligence, 4(4), 40-44.16. User Experience Questionnaire. (2017). (17.11.2017). Retrieved from http://www.ueq-online.org/287
The User Experience Questionnaire (UEQ) provides an opportunity to quickly assess the experience of the users of interactive products. The questionnaire is designed in a format that allows users to instantly express the feelings, impressions and attitudes that they experience when using a product. The scales of


